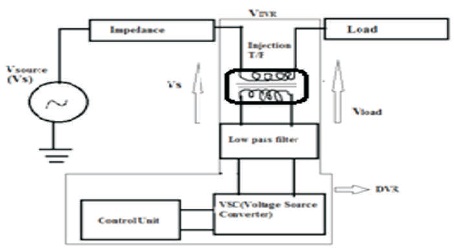
Figure 1. Schematic Diagram of DVR
This paper proposes Fuzzy Logic controller (FLC) based on Dynamic Voltage Restorer (DVR) Controller along with Directquadrature- zero (dq0) transformation for power quality improvement in a distribution system. Distribution needs protection against the power quality problems like Sag and Swell for providing good supply at the load. Sag and Swell can be compensated by injecting the compensating voltage method using Dynamic Voltage Restorer (DVR). In this research work, DVR is used for the improvement of power quality in distribution systems by using SPWM and SVPWM techniques. Total Harmonic Distribution (THD) and Power Factor (PF) values are compared for both the conditions with and without PI and FLC. The desired compensations are confirmed by the results of the simulation in MATLAB / SIMULINK Software.
Nowadays quality of power is an important issue for industries, which are operating in a highly competitive business area. The reason for demanding high quality power is to improve productivity and economy. Industries use Modern devices such as power electronics devices and Programmable Logic Controllers (PLC) power quality problems (Omar & Rahim, 2008). These devices are more sensitive to power quality problems such as harmonics, sag, swell and voltage flickers, etc. Where as Voltage Sag and Voltage Swell are severe disturbances in distribution system. According to IEEE standard 1159 Voltage Sag is a “decrease in RMS AC voltage between 0.1pu and 0.9pu. Event duration is limited from half cycle to 1 minute”. Similarly IEEE standard 1159 defines Voltage Swell as an increase in RMS AC voltage greater than 110% (1.1pu) and 180% (1.8pu) at the power frequency for a duration longer than 1 minute (Hingorani, 1995; Iltaf & Reddy, 2015). The power quality issues mainly in the area of distribution systems are Voltage Sag and Voltage Swell, these have two main parameters including magnitude and time duration.
Voltage supports at a load can be maintained constant by injection voltage in case of reactive power at the load Point of Common Coupling (PCC), with the help of mechanically switched shunt capacitors. The disadvantage is that due to switching operations, high speed transients cannot be compensated (Kantaria, Joshi, & Siddhapura, 2010).
The DVR is a more reliable solution to these power quality issues and it is used to compensate the power quality issues by injecting voltage (Kantaria et al., 2010). CU (Control Unit) is a main part of the DVR and it is used to detect the power quality issues in the system. The conventional, Proportional Integrater Controller (PI) requires precise linear mathematical models and are difficult perform satisfactory under parameter variations, nonlinearity load issues etc., (Bhumkittipich & Mithulananthan, 2011).
The Fuzzy Logic Controllers (FLC) obtained great attention in some applications because they do not need an accurate mathematical rule, they can work with imprecise inputs and can handle nonlinear controllers. Conventional FLC can reduce the time needs and this controller needs many membership functions. In such cases researchers tried reduce membership functions. A FLC controller is introduced with proposed technique to enhance the effectiveness and robustness in compensating the missing voltage (Zhang & Bollen, 1998). The DVR with proposed control technique was developed in a suitable system with linear load considering various fault conditions in the systems.
The inventor of fuzzy logic Lotfi Zadeh, observed that unlike computers, human decision making includes a range of possibilities between YES or NO and conventional logic block that computer can understand, takes precise input and produces a definite output as TRUE or FALSE. John McCrthy was the father of Artificial Intelligence (AI), it is “The science and engineering of making intelligent machines, especially intelligent computer programs”. Science and technology is based on the disciplines such as Computer Science, Biology, Psychology, Linguistics, Mathematics and Engineering. A major thrust of AI is in the development of computer functions associated with human intelligence, such as reasoning, learning and problem solving. The principles of fuzzy systems are dealt in depth with the information and the useful knowledge available for computing processes. The various algorithms and the solutions to the problems are pertinent to the fuzzy systems research projects, labs and university level college studies (Sivanandam, Sumathi, & Deepa, 2007). Kang and Joung (2012) proposed a method to increase the number of output levels of a simple and easily controlled cascaded H-bridge Multilevel Inverter (MLIs), using minimum bidirectional switches. The researchers claimed that their economical module, which was flexible in increasing voltage and power levels, delivered 9 level output voltage with lower THD, reduced switching losses and having longer life span.
Figure 1 shows DVR diagram, it consists of an Coupling Transformer, LP (Low passs filter), VSI (Voltage Source Inverter) and Control System (Control Unit). The two main tasks of Coupling Transformer are connecting DVR to the distribution network via the HV winding of coupling transformer and generating compensating voltage from Voltage Source Converter (VSC) i.e. injected in to the distribution network through coupling transformer. The main task of low pass filter (harmonic filter) is eliminating the disturbances present in the compensating voltage generated by the VSC. The purpose of Energy devices is to supply DC source to the VSC for generating the compensate voltage. A VSC consists of a power electronic devices switching, which can generate phase and magnitude of a sinusoidal wave at any required frequency. The DVR is used in compensation of Sag and Swell and is to manage constant DC voltage (at the nominal DC voltage) as shown in Figure 2 (Bhaskar & Satish, 2015).
Figure 1. Schematic Diagram of DVR
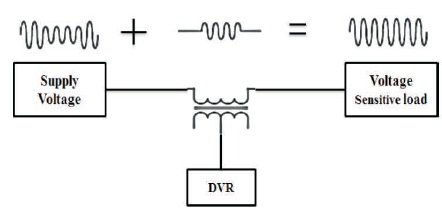
Figure 2. DVR Block Diagram
The main function of DVR is to substitute the dynamically voltage required, where sag and swell occurs. The working mode is the compensation mode. The DVR will turn to injection mode as soon as sag and swell are detected. Compensating voltage (V ) is injected in the distribution DVR lines in series with load with the required amount of magnitude and phase for compensation (Bhaskar & Satish, 2015).
The DVR is to compensate the Voltage Sag and Voltage Swell occurred in the system. For the compensating voltage, to generate trigger pulse Pulse Width Modulation is used. In this research work the d-q-o park transformations is used in calculation of voltage. The d-q-o transformation is a transformation of co-ordinate from the three phase constant coordinate system (Omar & Rahim, 2008). This dqo method gives the information of the direct axes (d) and shift of phase (q) or quadrature axes.
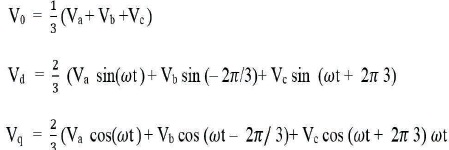
After conversion, the 3 phase voltages are Va, Vb, Vc become two constant voltages Vd and Vq are easily controlled (Omar & Rahim, 2008).
PI controller is a controller which drives the plant to be controlled with a sum of the error and the integral of that value. The proportional response can be adjusted by multiplying the error by constant Kp, called proportional gain. The contribution from integral term is proportional to both the magnitude of error and duration of error. The error is first multiplied by the Integral Gain, Kl and then was integrated to give an accumulated offset that had corrected previously (Suryanarayana & Mishra, 2008).
The FLC is one of the most successful operations of fuzzy set theory, its major features are the use of linguistic variables rather than numerical variables. This control technique relies on human capability to understand the systems behaviour and is based on quality control rules. Fuzzy logic provides a simple way to arrive at a definite conclusion based upon vague, ambiguous, imprecise, noisy or missing input information (Srinivas, Bharathi, Wilson, & Sridevi, 2005).
The block diagram of FLC is represented in Figure 3 and it has four principal components:
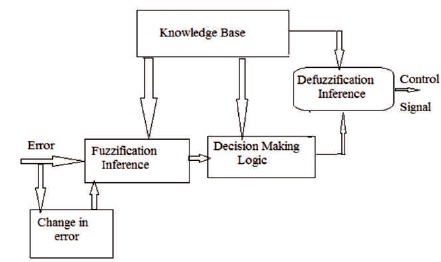
Figure 3. Basic Structure of FLC
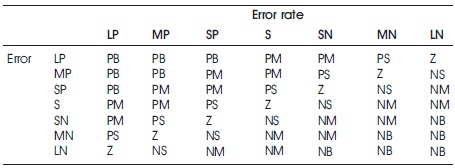
Table 1. Decision Table for Logic Control (Member Functions of Error and Change in Error)
In this paper two FL controller blocks, Error(e) and change in error (Δe )are the inputs to the fuzzy controller are shown in Figure 4.
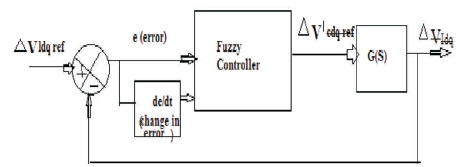
Figure 4. Feedback Control Loop of DVR
A cascaded 3, 5, 7, and 9 levels H-bridge inverter was designed with three legs in VSC (voltage source converter) of DVR and it is connected to three phase supply through series injection transformer. As number of levels increases in MLI the output of the DVR harmonics decreases. The number of levels of phase voltages is defined by m = 2N+1, where “N” is the number of separate DC sources.
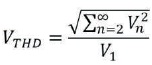
Where Vn = RMS voltage nth harmonic
V1 = RMS Voltage of the fundamental frequency
From the simulation block diagram of normal inverter (two level inverter i.e. without MLI) shows the complete simulation of the proposed DVR systems using MATLAB / simulink under the conditions without PI Controller, with PI Controller and Fuzzy Logic Controller by using SPWM and SVPWM techniques. The values assigned to the parameters of the blocks used for simulation are listed in Table 2. Simulation diagrams shows that the three phase programmable voltage Source acts as the Source Supply for distribution line. RL circuit is connected in both the source side and load side, it is represented by the transmission block, which is in fact, a three phase series RLC element. The R and L values are given in Table 2 and capacitance effect is assumed to be zero. Three phase faults created in distribution lines, causes Sag in distribution lines (Sag occurs 0.2 to 0.6). Large load suddenly changes it means start or stop in to the source supply this causes Swell (Swell occurs 0.8 to 1.2). So these two harmonics occurs very severe in distribution lines or transmission lines and this consequences stoppage or damage to sensitive equipment. DVR is a static series device connected in series to the line and it act as high speed switching device to compensate the Sag and Swell. It is mandatory to track all three phase line voltages and to compare them with their respectively reference three phase quantities continuously. The comparison is realized through abc to dqo transformation, which transform a three phase abc quantity into a single revolving reference frame, i.e a three phase AC is reduced into two DC quantities in order to eliminate time varying inductances. The output and references equivalent DC quantities are compared and error is fed to the PI controller which in turn generates the controlled dqo output, based on the magnitude of the error signal. The dqo output from the PI controller is fed to a dqo to abc converter to transform the dqo quantity back to three phase AC form. This AC serves as a reference sine input to the PWM generator and along with triangular carrier, PWM generator generates the gating pulses for the switching devices of inverter circuit. This makes the inverter circuit to generate the required compensating voltage in correct sequence, phase and magnitude and to inject the same in to the distribution line through injection transformer, and returns the line voltage back to the its nominal value. The measuring blocks are included at a position or place that affords a way to track the performance of the DVR.
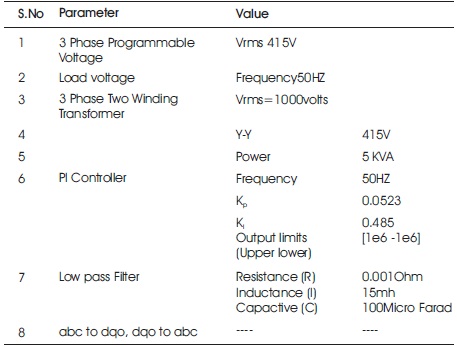
Table 2. DVR System Parameters
A Three-phase structure of 3, 5, 7, and 9-level cascaded inverter is illustrated in 12, 24, 36, and 48 IGBTS are used in MLI with three legs. Each separate DC source (SDCS) is connected to a full-bridge or H-bridge inverter. Each inverter level can generate three different voltage outputs +Vdc, 0, and –Vdc by connecting the DC source to the AC output by different combinations of the four switches S1, S2, S3, and S4. To obtain +Vdc, switches S1 and S4 are turned ON, whereas –Vdc can be obtained by turning ON switches S2 and S3. By turning Off S1, S2, S3, and S4, the output voltage is 0. The AC outputs of each of the different full-bridge inverter levels are connected in series such that the synthesized voltage waveform is the sum of the inverter outputs. 3 level CHMLI output voltage generate 3 levels those are Vdc, 0, -Vdc, 5 level CHMLI output voltage generates 5 levels, they are 2Vdc, Vdc, 0, -Vdc,-2Vdc, 7 level CHMLI output voltage generates 7 levels those are 3Vdc, 2Vdc, Vdc, 0, -Vdc, -2Vdc, -3Vdc, and 9 level CHMLI output voltage generates 9 levels those are 4Vdc, 3Vdc, 2Vdc, Vdc, 0, -Vdc, -2Vdc, -3Vdc, -4Vdc. The number of output phase voltage levels 3, 5, 7, and 9 levels in a cascaded inverter is defined by m = 2N+1, where “N” is the number of separate DC sources.
A cascaded 3, 5, 7, and 9 levels H-bridge inverter was designed with three legs in VSC (voltage source converter) of DVR and it is connected to three phase supply through series injection transformer. When number of levels increases in MLI the output of the DVR harmonics decreases.
For circuit (Figure 5) simulation model designed for compensation of voltage sag and swell in distribution lines and load side voltage is maintained constant. DVR is a custom power device and it is connected in series to three phase (415V, Three Phase, 50Hz) distribution lines in between source supply and load. DVR consists of coupling Transformer, low pass filter and VSC. Two level inverter constructed in VSC. In the circuit designed without PI controller gives poor voltage or poor performance. This systems generating harmonics THD% = 18.73 and Power Factor=0.7349. SPWM technique is used in simulation circuit shown in Figure 5 for generating triggering pulses to trigger the two level power electronic circuits for generating compensating voltage.
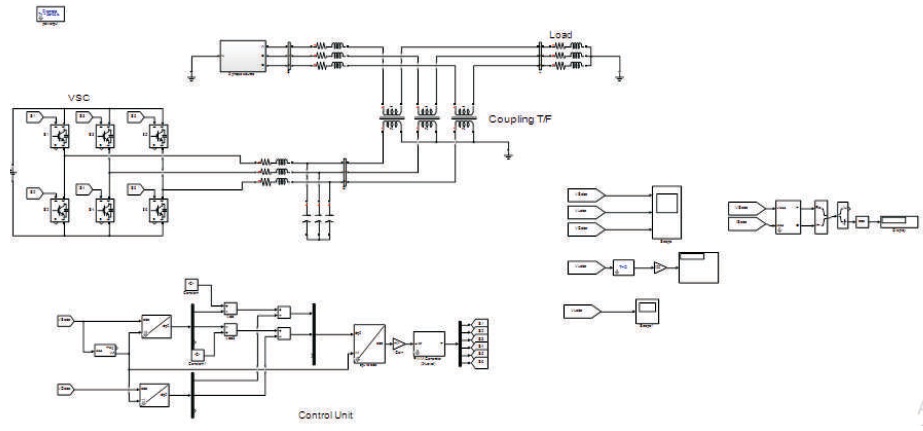
Figure 5. Main Circuit: Without PI based on DVR using SPWM Technique for Compensated Sag and Swell
From Figure 6 the first waveform shows voltage sag and swell. Decrease in voltage values is called as voltage sag which occurs because of three faults on distribution lines. Increases in voltage values is called voltage swell because of switching lines and large load additions in distribution lines. Second waveform is called load voltage i.e. constant voltage. Here observing without PI controller DVR performance is poor thats why some harmonics are generated in second waveform and some disturbances are generating in load voltage. Third waveform is called as compensating voltage or injecting voltage and this voltage is generated by DVR, it is injected in distribution lines through low pass filter and coupling transformer.
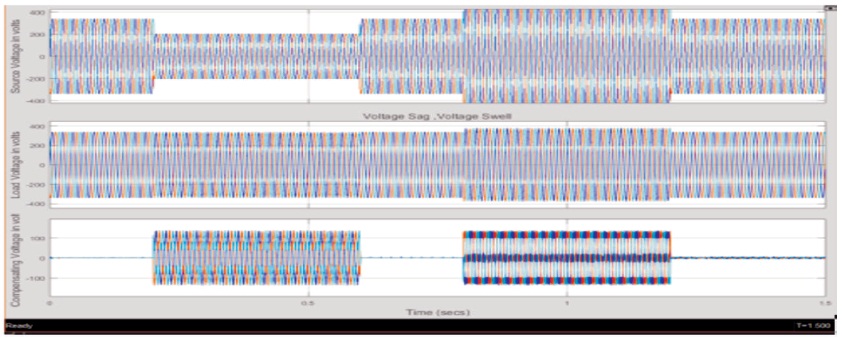
Figure 6. Simulation Results of without PI based on DVR using SPWM Technique
Figure 7 is a simulation circuit for compensated harmonics like voltage sag and swell based on DVR using SVPWM technique without PI controller. In this circuit SVPWM techniques used for generating the control signals. SVPWM technique generating low harmonics compared to SPWM technique. Two level inverter circuit is designed in VSC. SVPWM technique is more preferred in industrial purposes because there used more nonlinear loads and drives. This simulation circuits generated THD% =17.55 and Power factor=0.758.
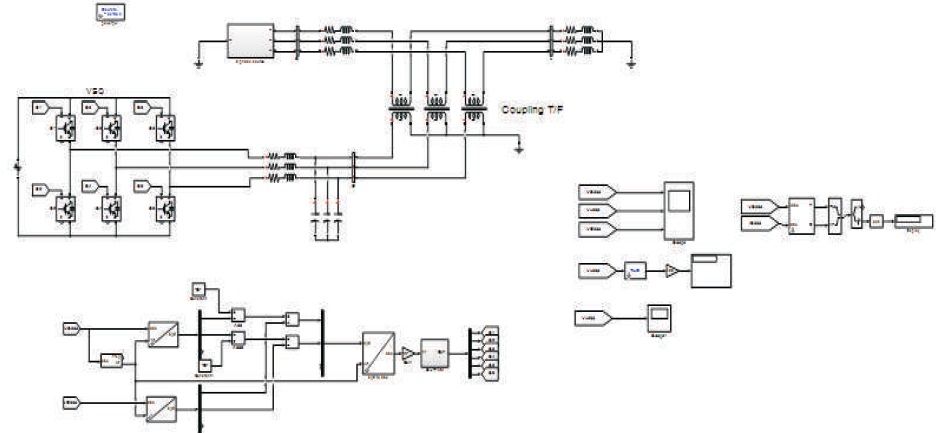
Figure 7. Main circuit: Without PI based on DVR using SVPWM Technique for Compensated Sag and Swell
Figure 8 shows the simulation results using SVPWM technique. These simulation results shows three waveforms, first one is with voltage sag and voltage swell, these occurs because of faults, large load additions in utility service area and power line switching. These harmonics are very harmful to sensitive devices thus decreasing its lifespan and cause damage. SVPWM technique is better compared to SPWM technique because its generated harmonics are little bit less. Second waveform is called as constant load voltage, but here observing without PI controller produced some harmonics, so clearly its shown harmonics are in load voltage. Third waveform is called injecting voltage by DVR for injecting into the distribution lines through coupling transformer and LPF filter.
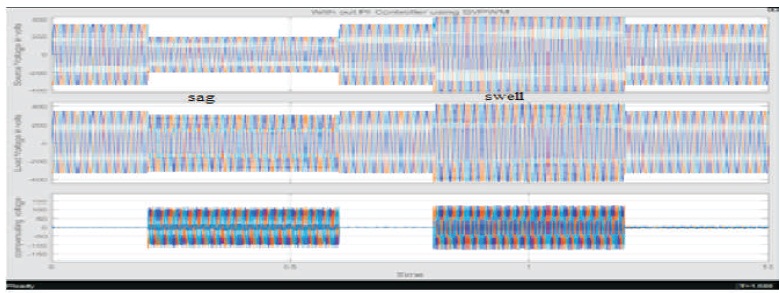
Figure 8. Simulation Results of Without PI based on DVR using SVPWM Technique
Figure 9 (a) main circuit diagram of with PI controller using SPWM technique based on DVR for compensating Voltage sag and swell, so load voltage is maintained constant. With PI Controller DVR performance is improved. Compensating voltage produced by DVR is pure compared to the without PI controller and this compensating voltage is injected in to the distribution lines, low harmonics generated in load voltage. Figure 9(b) shows the PI controller technique simulation diagram and it is a conventional technique. Systems generated THD with PI controller THD%=11.18 and Power factor=0.7804.
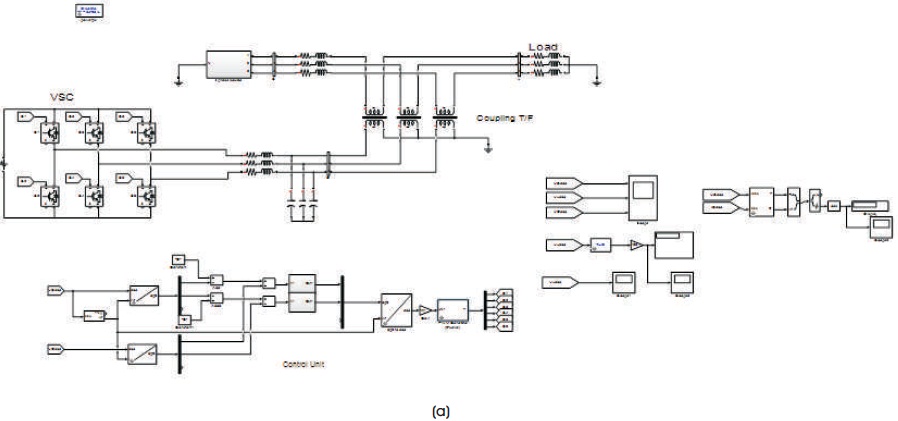
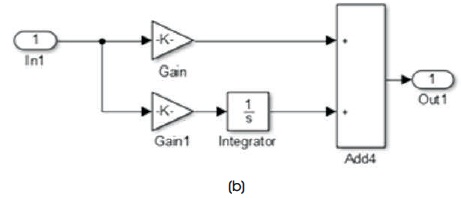
Figure 9. (a) Main Circuit Diagram and (b) PI Controller, Figures are using SPWM Technique for Compensated Voltage Sag and Swell
Figure 10 shows the simulation results generated by Figure 9 (a) and (b). From these simulation waveforms, first one is called harmonics like voltage sag and swell and second waveform is called constant load voltage. Third wave form is called compensating voltage for injecting into the distribution lines for maintaining constant load voltage. With PI controller performance is better compared to the without PI Controller.
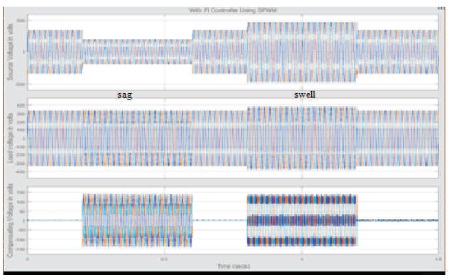
Figure 10. Simulation Results of with PI using SPWM
Circuit diagram in Figure 11 is called as simulation circuit diagram of SPWM technique with Fuzzy logic controller for compensated voltage sag and swell based on DVR. This circuit generated low harmonics compared to conventional type of PI Controller. Now-a-days Fuzzy logic is modern technology. Fuzzy has low sampling time but it does not gives accurate values. When FLC, SPWM are used in circuits control unit connected automatically DVR performance get improved. The circuit diagram for fuzzy logic controller is given in Figure 12.
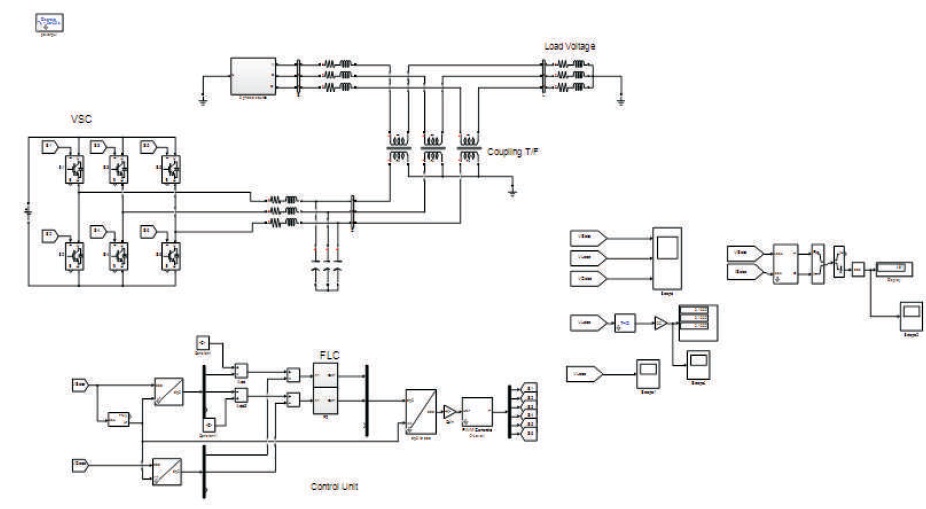
Figure 11. Main Circuit Diagram of SPWM for Compensated Sag and Swell with FLC
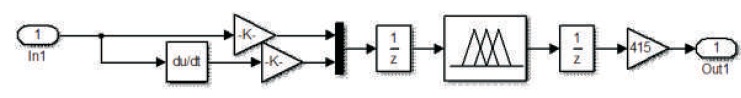
Figure 12. Circuit Diagram of Fuzzy Logic Controller
Figure 13 shows less harmonics in the second waveform because Fuzzy logic controller used. Fuzzy logic controller result are good when compared to PI Controller results. In load voltage disturbances are very less. Pure Injecting voltage is generated by DVR. To minimise the harmonics in distribution lines the load voltage is maintained constant i.e. shown in second waveform. DVR generated compensating pure voltage is shown in third waveform of Figure 3.
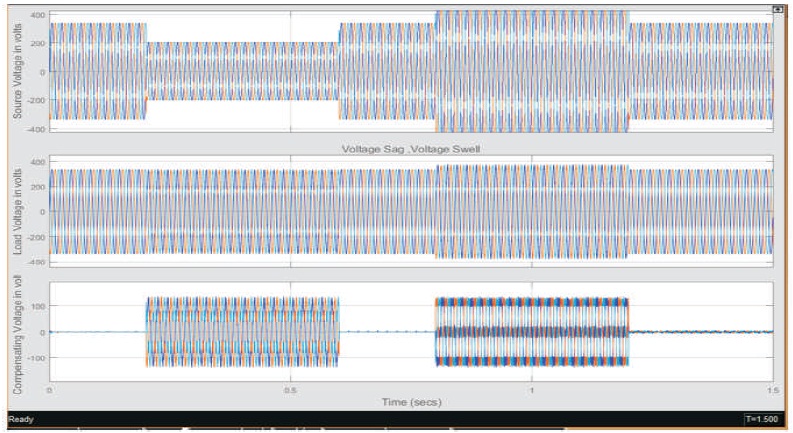
Figure 13. Simualtion Results of Fuzzy Logic Controller using SPWM
Figure 14 shows the main circuit diagram of SVPWM technique with Fuzzy Logic Controller based on DVR for compensating voltage sag and voltage swell. This circuit diagram generated THD%=9.32 and Power factor = 0.823.This diagram is generates best results when compared to other simulation diagrams. Fuzzy logic controller combination is super with SVPWM technique because this diagram results are best or it generates waveforms with low harmonics.
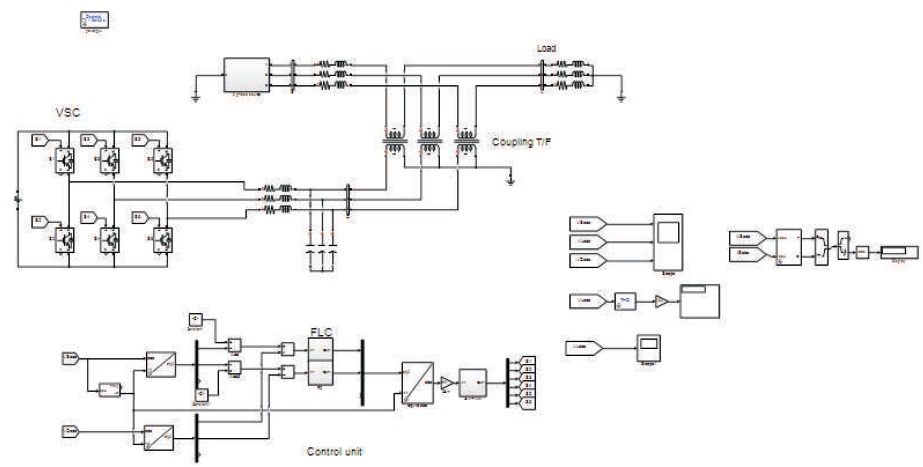
Figure 14. Main Circuit Diagram of SVPWM Technique with Fuzzy Logic Controller
Figure 15 simulation circuits is called as control unit of SVPWM technique and another one is called Fuzzy logic controller. SVPWM technique generates switching pulses and trigger the VSI power electronics circuit. Fuzzy logic controller is used in this system to improve the performance of DVR.
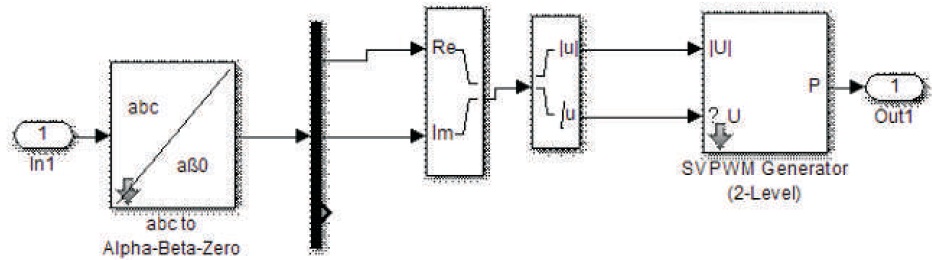
Figure 15. SVPWM Technique with Fuzzy Logic Controller
Figure 16 is the simulation circuit of 3 levels three phase CHMLI based on DVR using SPWM technique with PI Controller for compensating sag and swell. In VSC, designed power electronics circuits that is three level CHMLI. This CHMLI generated low harmonics compared to normal inverter, where THD %=9.16 and Power factor= 0.837.
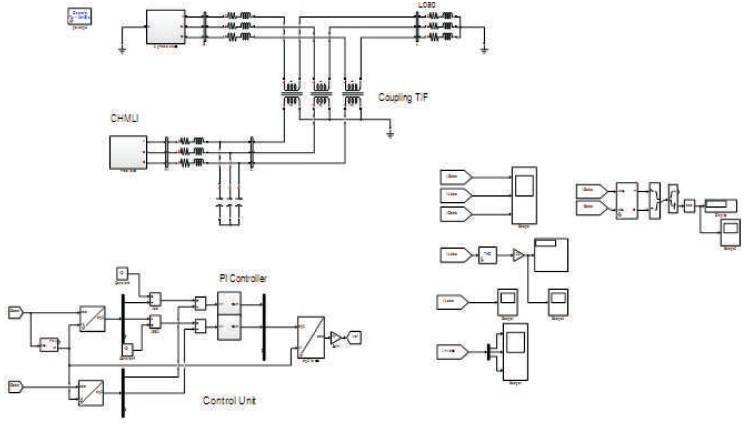
Figure 16. Main Circuit of 3 Levels CHMLI with PI Controller using SPWM
Figure 17 (a) shows the simulation diagram of three phase three levels CHMLI. Generally, multi level inverter is generates low harmonics. Here eight IGBTs and three H-Bridge are used. This circuit diagram generated three out put levels +Vdc,0,-Vdc.
Figure 17(b) is called control unit of SPWM technique for generating pulses for power switches in VSC of DVR.
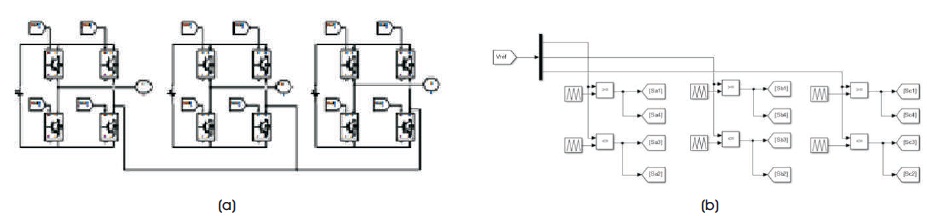
Figure 17. (a) Three Phase Three Levels CHMLI, (b) 3 Levels of CHMLI with SPWM Technique
Figure 18 is simulation main diagram of three phase three level of CHMLI using SPWM with Fuzzy logic controller based on DVR for compensating Sag and swell in distribution lines. This circuit diagram is generated less harmonics i.e. THD%=9.07 and Power Factor = 0.84. Fuzzy logic controller results better compared to PI controller in three level CHMLI.
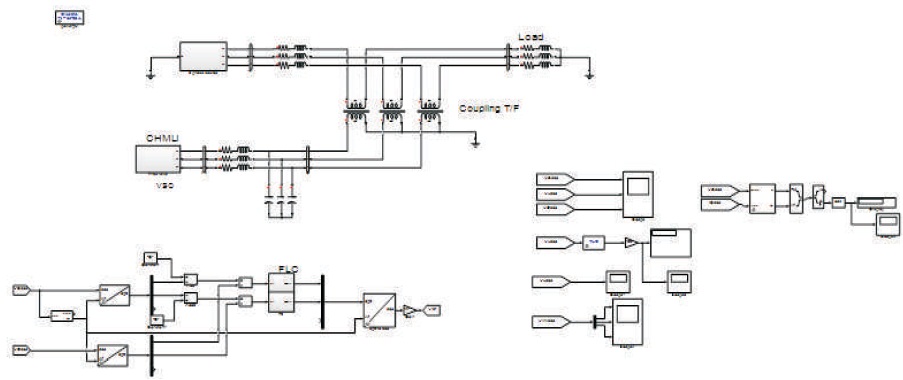
Figure 18. Three Level of CHMLI using SPWM and Fuzzy Logic Controller
Figure 19 is the simulation circuits of 3 level CHMLI using SVPWM with PI controller based on DVR for compensating sag and swell in distribution lines. SVPWM technique is excellent compared to SPWM technique.
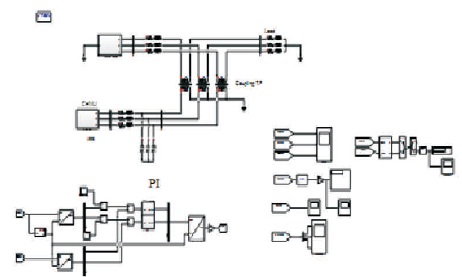
Figure 19. Main Circuit: 3 Levels CHMLI using SVPWM with PI Controller
Figure 20 (a) shows the simulation diagram of three phase 3 levels of CHMLI using SVPWM technique. Figure 20(b) is a simulation circuit for generated switching pulses for switching the power switches of VSC.
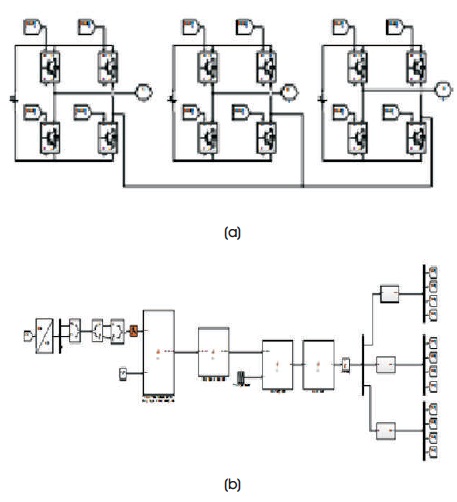
Figure 20. (a) Three Phase 3 Levels of CHMLI, (b) Control Unit of 3 Levels CHMLI using SVPWM Technique
Figure 21(a) shows that the waveform of output signals of FLC is better compared to PI Controller in three levels of CHMLI. Figure 21(b) shows the simulation results of input source voltage, load voltage and compensating voltage or injecting voltage.
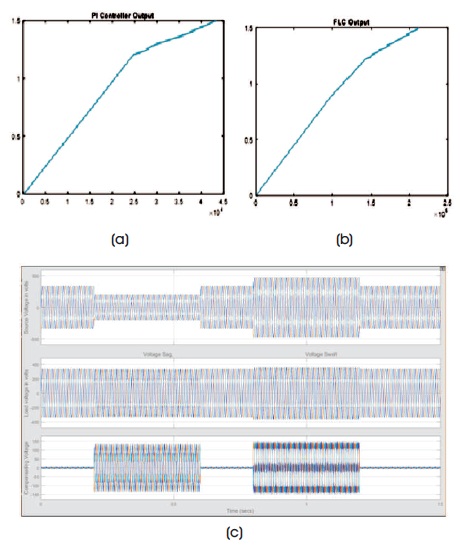
Figure 21. (a) Output Signal of PI and FLC Controllers (3 levels CHMLI), (b) Waveforms of Voltage Sag Swell, Compensating Voltage and Load Voltage (SVPWM)
Figure 22 is called as three phase 5 levels of CHMLI. In this circuit diagram 6 H-Bridge circuits and 24 IGBTS are used. This circuit generated 5 levels those are +2Vdc, +Vdc, 0, -Vdc, +2Vdc. This type of circuit generated low harmonics compared to 3 levels of CHMLI. Figure 23 is five levels CHMlI the SVPWM control unit.
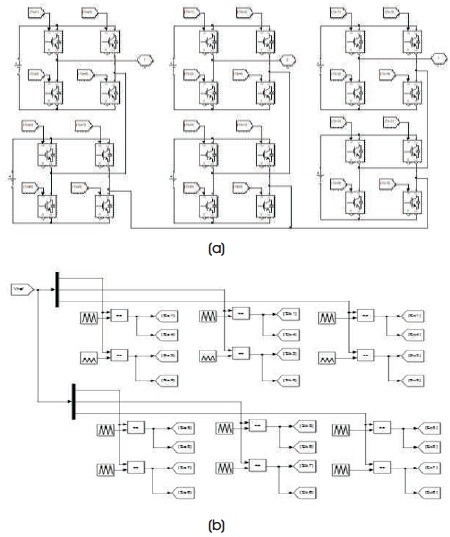
Figure 22. (a) Three Phase 5 Levels of CHMLI, (b) 5 Levels CHMLI with SPWM Control Technique
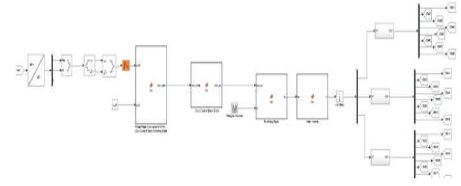
Figure 23. 5 Levels CHMLI SVPWM Control Unit
Figure 24 clearly observed that the output signals of FLC controller is better compared to output signal of PI controller.
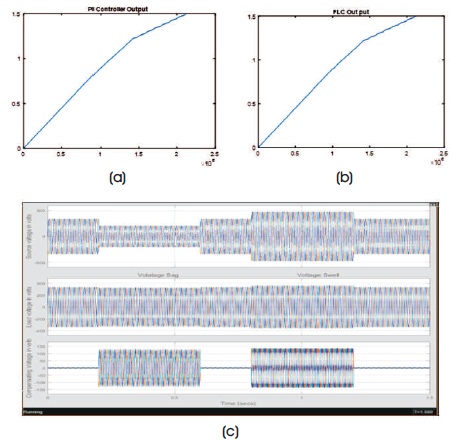
Figure 24. (a) Output Signal of PI and FLC Controllers (5 Levels CHMLI), (b) Waveforms of Voltage Sag Swell, Compensating Voltage and Load Voltage (SVPWM)
Figure 25 shows the circuit designed using Nine H-Bridges, 36 IGBTS switches and 9 DC sources. This type of circuit generates low harmonics.
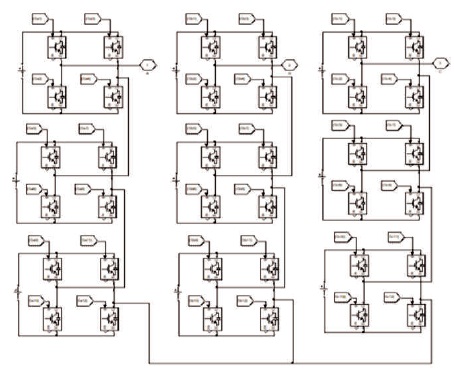
Figure 25. 7 Levels CHMLI (In this case using SPWM with PI and with Fuzzy Logic)
Figures 26 and 27 shows the M control technique for seven level CHMLI.
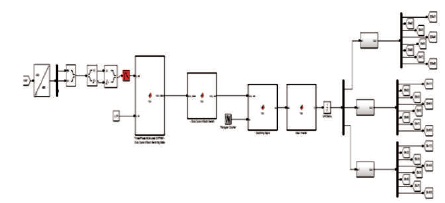
Figure 26. SVPWM Control Technique for 7 Level CHMLI
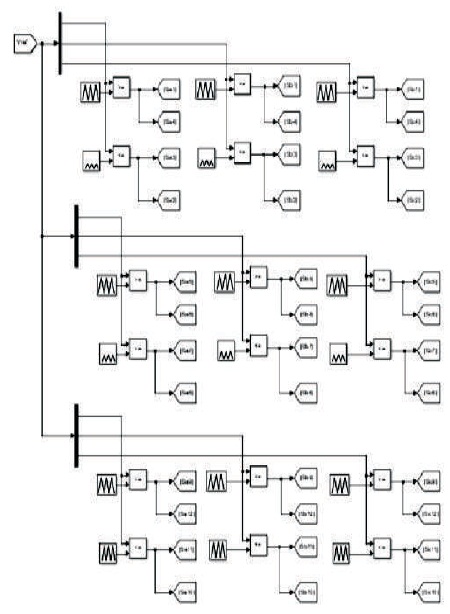
Figure 27. SPWM Control Technique for 7 Level CHMLI
Figure 28 (a) shows the output signals of PI and FLC controllers (7 levels CHMLI). and Figure 28 (b) shows the waveforms of voltage sag and swell, compensating voltage and load voltage (SVPWM).
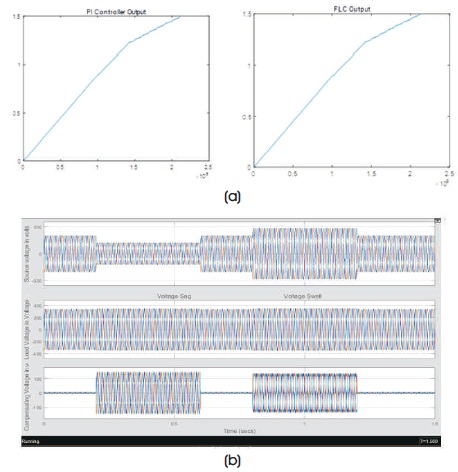
Figure 28. (a) Output Signals of PI and FLC Controllers (7 Levels CHMLI) (b) Waveforms of Voltage Sag Swell, Compensating Voltage and Load Voltage (SVPWM)
Figure 29 is a simulation circuit of three phase 9 levels CHMLI. This circuit generates low harmonics compared to other 3, 5, 7 levels of CHMLI. When the number of levels in CHMLI increases automatically the harmonics decreases gradually. This circuit has 12 DC sources, 48 IGBTs and 12 H-Bridges. This circuit cost is more compared to other MLI.
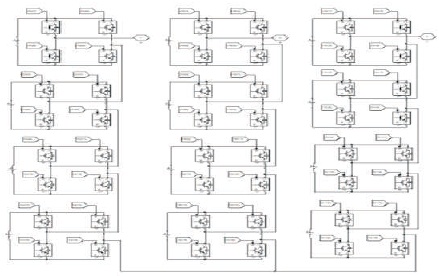
Figure 29. 9 Level CHMLI
Figures 30 and 31 shows the SVPWM control technique for 9 level CHMLI.
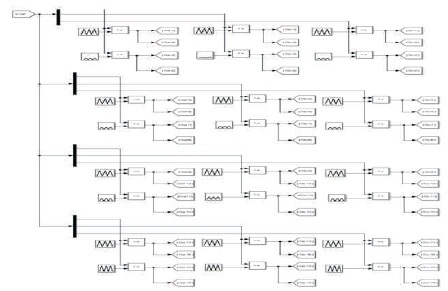
Figure 30. SPWM Control Technique for 9 Level CHMLI
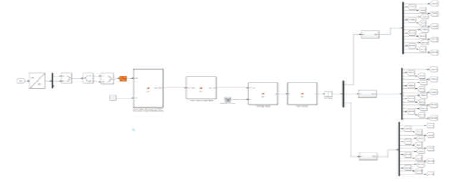
Figure 31. SVPWM Control Technique for Nine Level
Figure 32(a) shows 9 level CHMLI circuit diagrams generated results. From simulation waveforms second one is called constant load voltage, this wave form is looking perfect. Completely DVR performance improved in this case of 9 level CHMLI and SVPWM technique with Fuzzy logic controller. THD results and Power factor results shown in Table 3 clearly.
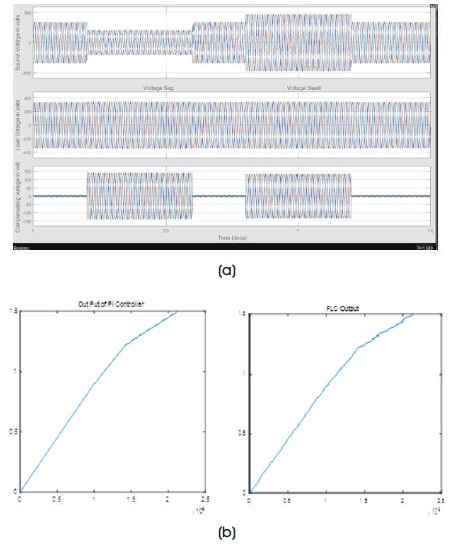
Figure 32. (a) Waveforms of Voltage Sag Swell, Compensating Voltage and Load Voltage (SVPWM) (b) Output Signal of PI and FLC Controllers (9 Levels CHMLI)
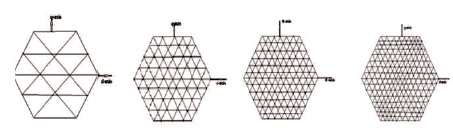
Figure 33. Vector Diagram of 3, 5, 7, and 9 Levels CHMLI
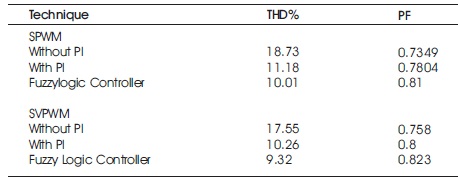
Table 3. THD% and PF Results of Three Phase Normal Inverter
Figure 32 (b) shows the output signal of PI and FLC controllers (9 levels CHMLI).
As per Table 3 and Figure 34, Fuzzy logic controller gives the best performance compared to PI Controller in DVR systems. Without PI Controller the system gives poor performance. Fuzzy logic controller is used in DVR systems to improve the Performance.
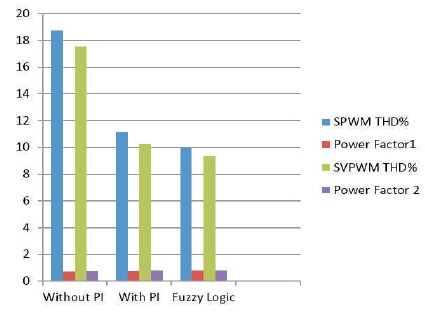
Figure 34. Figure for without PI, with PI and Fuzzy Logic Controller
As per Table 4 and Figure 35 the number of levels increases in CHMLI, harmonics gradually decreases. In industries more preferred CHMLI is the 9 levels CHMLI which generates lower harmonics compared to other levels of CHMLI.
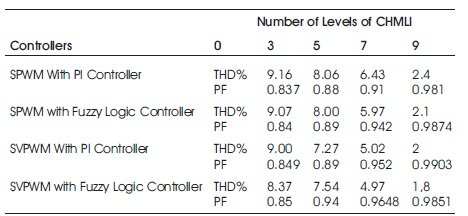
Table 4. THD% and PF Results of Three Phase CHMLI
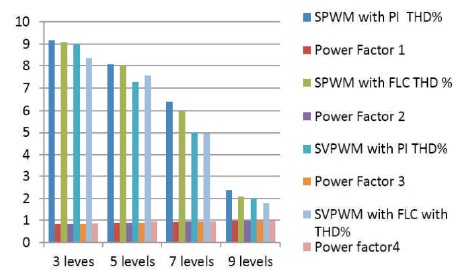
Figure 35. 3, 5, 7, and 9 Levels of Three Legs Three Phase CHMLI
In this research work, simulation of normal Inverter (two level inverter) and CHMLI based on DVR is carried out. MLI results better results compared to normal inverter as per Table 4. The DVR has been simulated with both SPWM and SVPWM techniques. Fuzzy logic with SVPWM using CHMLI results in good performance compared to SPWM technique results as per Table 3 values. In this research work, simulation diagrams clearly shows that how the power quality disturbances like Voltage sag and swell in distribution lines are compensated for power quality improvement. This research work enhance the power transfer capacity and maintains good power factor.