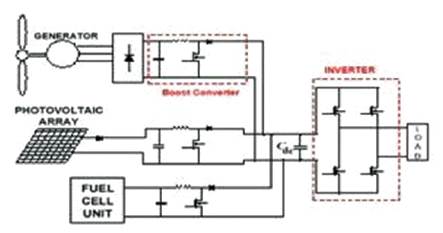
Figure 1. Hybrid system with Multi-connected Boost Converter
This paper presents a new system configuration of the front-end rectifier stage for a hybrid wind/photovoltaic energy system. This configuration allows the two sources to supply the load separately or simultaneously depending on the availability of the energy sources. The inherent nature of this Cuk-SEPIC fused converter, is that, additional input filters are not necessary to filter out high frequency harmonics. Harmonic content is detrimental for the generator lifespan, heating issues, and efficiency. The fused multi input rectifier stage also allows Maximum Power Point Tracking (MPPT) to be used to extract maximum power from the wind and sun when it is available. An adaptive MPPT algorithm will be used for the wind system and a standard perturb and observe method will be used for the PV system. Operational analysis of the proposed system will be discussed in this paper. Simulation results are given to highlight the merits of the proposed circuit.
With increasing concern of global warming and the depletion of fossil fuel reserves, many are looking for sustainable energy solutions to preserve the earth for the future generations. Other than hydro power, wind and photovoltaic energy hold the most potential to meet our energy demands. Wind energy alone is capable of supplying large amounts of power, but its presence is highly unpredictable, as it can be here one moment and gone in another. Similarly, solar energy is present throughout the day, but the solar irradiation levels vary due to sun intensity and unpredictable shadows cast by clouds, birds, trees, etc. The common inherent drawback of wind and photovoltaic systems are their intermittent natures that make them unreliable. However, by combining these two intermittent sources and by incorporating Maximum Power Point Tracking (MPPT) algorithms, the system's power transfer efficiency and reliability can be improved significantly. When a source is unavailable or insufficient in meeting the load demands, the other energy source can compensate for the difference. Several hybrid wind/PV power systems with MPPT control have been proposed and discussed in works[1]- [5]. Most of the systems in literature use a separate DC/DC boost converter which is connected in parallel in the rectifier stage as shown in Figure 1 to perform the MPPT control for each of the renewable energy power sources [1]-[4]. A simpler multi-input structure has been suggested by[5] that combines sources from the DC-end, while still achieving MPPT for each renewable source. The structure proposed by[5] is a fusion of the buck and buck-boost converter. The systems in literature require passive input filters to remove the high frequency current harmonics injected into wind turbine generators. The harmonic content in the generator current decreases its lifespan and increases the power loss due to heating.
Figure 1. Hybrid system with Multi-connected Boost Converter
In this paper, an alternative multi-input rectifier structure is proposed for hybrid wind/solar energy systems. The proposed design is a fusion of the Cuk and SEPIC converters. The features of the proposed topology are: 1) the inherent nature of these two converters eliminates the need for separate input filters for PFC 2) it can support step up/down operations for each renewable source (can support wide ranges of PV and wind input); 3) MPPT can be realized for each source; 4) individual and simultaneous operation is supported. The circuit operating principles will be discussed in this paper. Simulation results are provided to verify the feasibility of the proposed system.
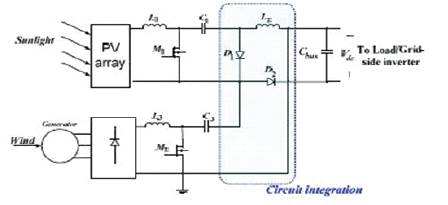
Figure 2. Proposed rectifier stage for a Hybrid wind/PV system
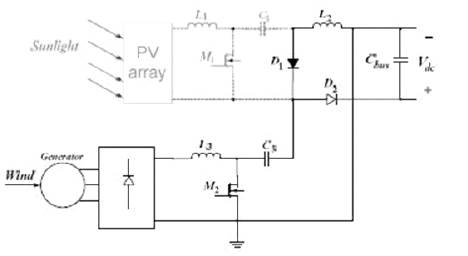
Figure 3. Only wind source is operational (SEPIC)
A system diagram of the proposed rectifier stage of a hybrid energy system is shown in Figure 2, where one of the inputs is connected to the output of the PV array and the other input connected to the output of a generator. The fusion of the two converters is achieved by reconfiguring the two existing diodes from each converter and the shared utilization of the Cuk output inductor by the SEPIC converter. This configuration allows each converter to operate normally and individually in the event that one source is unavailable. Figure 3 illustrates the case when only the wind source is available. In this case, D turns off and D 1 2 turns on; the proposed circuit becomes a SEPIC (Single- Ended Primary Inductor Converter) and the input to output voltage relationship is given by equation (1). On the other hand, if only the PV source is available, then D turns off and 2 D will always be on and the circuit becomes a Cuk 1 converter as shown in Figure 4. The input to output voltage relationship is given by equation (2). In both cases, both converters have step-up/down capability, which provide more design flexibility in the system if duty ratio control is utilized to perform MPPT control.
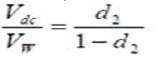

Figure 5 illustrates the various switching states of the proposed converter. If the turn on duration of M is longer 1 than M , then the switching states will be state I, II, V. Similarly, 2 the switching states will be state I, III, IV if the switch conduction periods are vice versa. To provide a better explanation, the inductor current waveforms of each switching state are given as follows, assuming that d2 > d1 ; hence only states I, III, IV are discussed in this example. In the following, Ii, PV is the average input current from the PV source; Ii, W is the RMS input current after the rectifier (wind case); and Idc is the average system output current. The key waveforms that illustrate the switching states in this example are shown in Figure 6. The mathematical expression that relates the total output voltage and the two input sources will be illustrated in the next section.
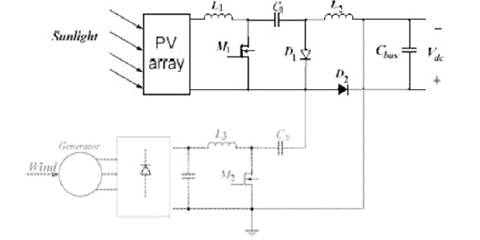
Figure 4. Only PV source is operational (Cuk)
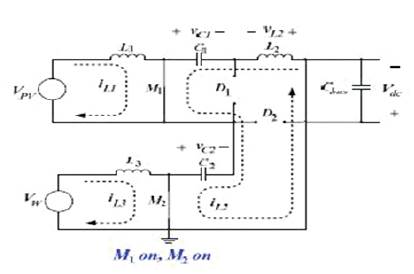

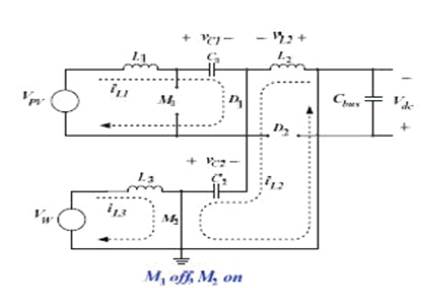
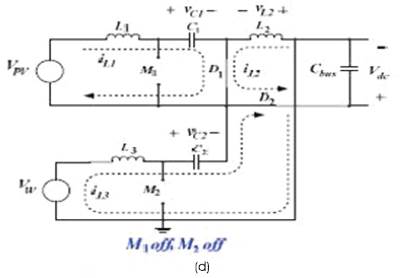
Figure 5. (a-d). Switching states within a switching cycle
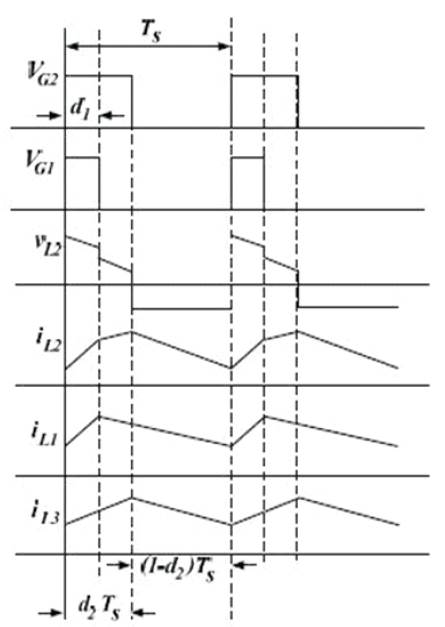
Figure 6. Proposed circuit inductor waveforms
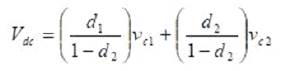
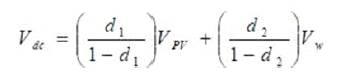
To find an expression for the output DC bus voltage, Vdc , the volt-balance of the output inductor, L2 , is examined according to Figure 6 with d2 > d1 . Since the net change in the voltage of L2 is zero, volt-balance is applied to L2 results in equation (3). The expression that relates the average output DC voltage (Vdc ) to the capacitor voltages (vc1 and vc2 ) is then obtained as shown in equation (4), where vc1 and vc2 can then be obtained by applying volt-balance to L1 and L3[9]. The final expression that relates the average output voltage and the two input sources (Vw and Vpv ) is then given by equation (5). It is observed that, Vdc is simply the sum of the two output voltages of the Cuk and SEPIC converter. This further implies that Vdc can be controlled by d1 and d2 individually or simultaneously.

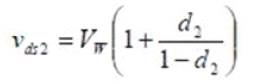
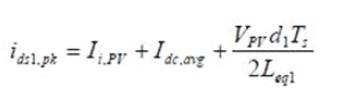
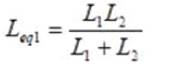
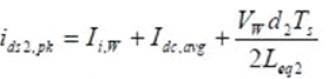
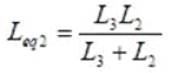
The switches’ voltage and current characteristics are also provided in this section. The voltage stress is given by equations (6) and (7) respectively. As for the current stress, it is observed from Figure 6 that the peak current always occurs at the end of the on-time of the MOSFET. Both the Cuk and SEPIC MOSFET current consists of both the input current and the capacitors (C1 or C2 ) current. The peak current stress of M1 and M2 are given by equations (8) and (10) respectively. Leq1 and Leq2 , given by equations (9) and (11), represent equivalent inductance of Cuk and SEPIC converter respectively.
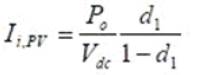
The PV output current, which is also equal to the average input current of the Cuk converter is given in equation (12). It can be observed that the average inductor current is a function of its respective duty cycle (d1 ). Therefore, by adjusting the respective duty cycles for each energy source, Maximum Power Point Tracking can be achieved.

A common inherent drawback of wind and PV systems is the intermittent nature of their energy sources. Wind energy is capable of supplying large amounts of power, but its presence is highly unpredictable, as it can be here one moment and gone in another. Solar energy is present throughout the day, but the solar irradiation levels vary due to sun intensity and unpredictable shadows cast by clouds, birds, trees, etc. These drawbacks tend to make these renewable systems inefficient. However, by incorporating Maximum Power Point Tracking (MPPT) algorithms, the systems' power transfer efficiency can be improved significantly. To describe a wind turbine's power characteristic, equation (13) describes the mechanical power that is generated by the wind.

Where
ρ=air density,
A=rotor swept area,
Cp (λ,β) =power coefficient function ,
λ= tip speed ratio,
β= pitch angle,
νw=wind speed
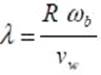
The power coefficient (Cp ) is a nonlinear function that represents the efficiency of the wind turbine to convert wind energy into mechanical energy. It is dependent on two variables, the Tip Speed Ratio (TSR) and the pitch angle. The TSR, λ, refers to a ratio of the turbine angular speed over the wind speed. The mathematical representation of the TSR is given by equation (14). The pitch angle, β, refers to the angle in which the turbine blades are aligned with respect to its longitudinal axis.

Figures 7 and 8 are illustrations of a power coefficient curve and power curve for a typical fixed pitch (β =0) horizontal axis wind turbine. It can be seen from Figure 7 and 8 that, the power curves for each wind speed have a shape similar to that of the power coefficient curve. Because the TSR is a ratio between the turbine rotational speed and the wind speed, it follows that each wind speed would have a different corresponding optimal rotational speed that gives the optimal TSR. For each turbine, there is an optimal TSR value that corresponds to a maximum value of the power coefficient (Cp , max) and therefore maximum power. Therefore, by controlling rotational speed, (by means of adjusting the electrical loading of the turbine generator) maximum power can be obtained for different wind speeds.
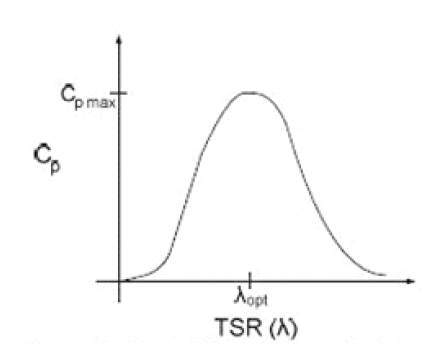
Figure 7. Power Coefficient Curve for a typical wind tubine
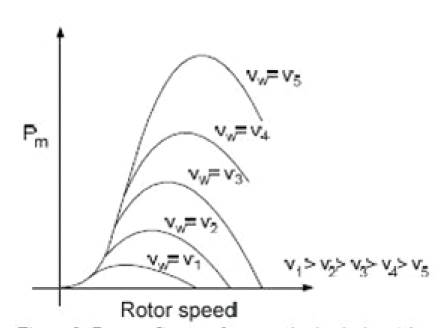
Figure 8. Curves for a typical wind turbine
A solar cell is comprised of a P-N junction semiconductor that produces currents via the photovoltaic effect. PV arrays are constructed by placing numerous solar cells connected in series and in parallel[5]. A PV cell is a diode of a large-area forward bias with a high voltage and the equivalent circuit is shown by Figure 9. The current-voltage characteristic of a solar cell is derived as follows:

Where
Iph = photocurrent
ID = diode current,
Io = saturation current,
A= ideality factor,
q = electronic charge 1.6x10⁻⁹,
kB = Boltzmann;s gas constant (1.38x10⁻²³).
T = cell temperature,
Rs = series resistance,
Rsh = shunt resistance,
I = cell current,
V = cell voltage

Figure 9. PV Cell equivalent circuit
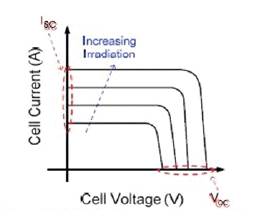
Figure 10. PV Cell voltage-current characteristic
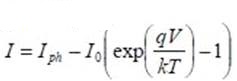
Typically, the shunt resistance (Rsh ) is very large and the series resistance (Rs ) is very small[5]. Therefore, it is common to neglect these resistances in order to simplify the solar cell model. The resultant ideal voltage-current characteristic of a photovoltaic cell is given by equation (17) and illustrated by Figure 10.[5].
The typical output power characteristics of a PV array under various degrees of irradiation is illustrated by Figure 11. It can be observed in Figure 11 that, there is a particular optimal voltage for each irradiation level that corresponds to maximum output power. Therefore, by adjusting the output current (or voltage) of the PV array, maximum power from the array can be drawn.
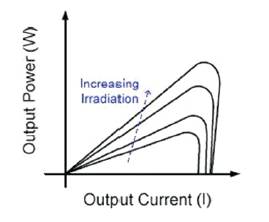
Figure 11. PV cell power characteristics
Due to the similarities of the shape of the wind and PV array power curves, a similar Maximum Power Point Tracking scheme known as the Hill Climb Search (HCS) strategy is often applied to these energy sources to extract maximum power. The HCS strategy perturbs the operating point of the system and observes the output. If the direction of the perturbation (e.g an increase or decrease in the output voltage of a PV array) results in a positive change in the output power, then the control algorithm will continue in the direction of the previous perturbation. Conversely, if a negative change in the output power is observed, then the control algorithm will reverse the direction of the pervious perturbation step. In the case that the change in power is close to zero (within a specified range), then the algorithm will invoke no changes to the system’s operating point since it corresponds to the maximum power point (the peak of the power curves).
The MPPT scheme employed in this paper is a version of the HCS strategy. Figure 12 is the flow chart that illustrates the implemented MPPT scheme.
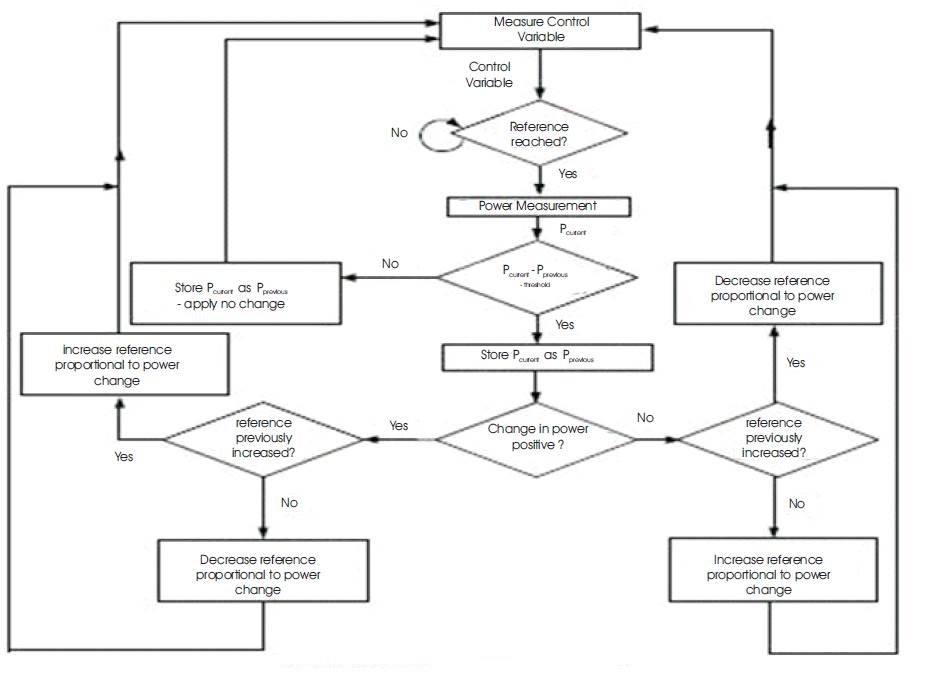
Figure 12. General MPPT Flow Chart for wind and PV
In this section, simulation results from PSIM 8.0.7 are given to verify that the proposed multi-input rectifier stage can support individual as well as simultaneous operation. The specifications for the design example are given in Table 1. Figure 13 illustrates the system under the condition where the wind source has failed and only the PV source (Cuk converter mode) is supplying power to the load. Figure 14 illustrates the system where only the wind turbine generates power to the load (SEPIC converter mode). Finally, Figure 15 illustrates the simultaneous operation (Cuk-SEPIC fusion mode) of the two sources where M2 has a longer conduction cycle (converter states I, IV and III in Figure 5).
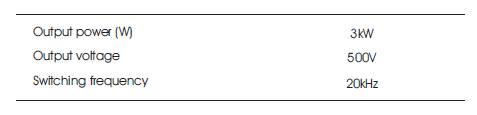
Table 1. Design Specifications
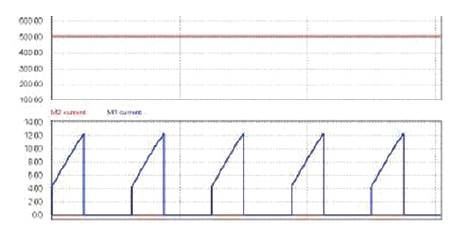
Figure 13. Individual operation with only PV source (Cuk operation) Top: Output power, Bottom: Switch currents (M1 and M2)
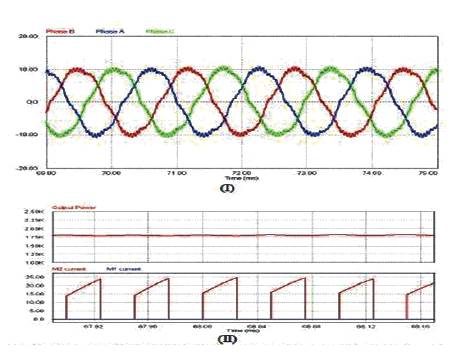
Figure 14. Individual operation with only wind source (SEPIC operation) (I) The injected three phase generator current, (II) Top: Output power, Bottom: Switch currents (M1 and M2 )
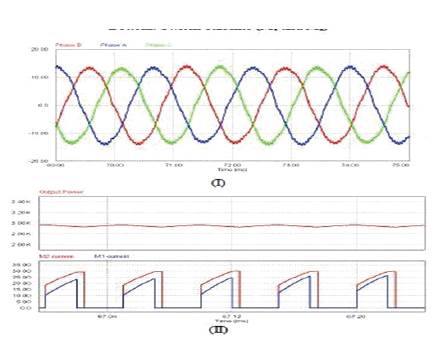
Figure 15. Simultaneous operation with both wind and PV source (Fusion mode with Cuk and SEPIC)(I) The injected three phase generator current, (II) Top: Output power, Bottom: Switch currents (M1 and M2 )
Figures 16 and 17 illustrate the MPPT operation of the PV component of the system (Cuk operation) and the Wind component of the system (SEPIC operation) respectively
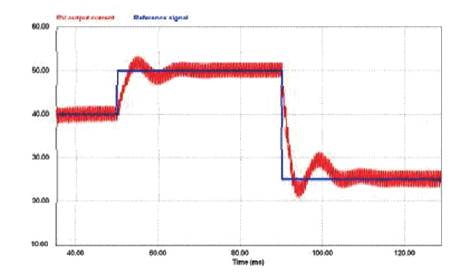
Figure 16. Solar MPPT-PV output current and reference current signal (Cuk operation)
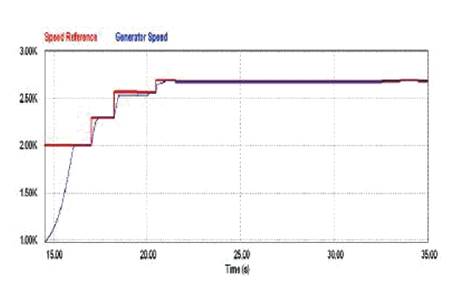
Figure 17. Wind MPPT- Generator speed and reference speed signal (SEPIC operation)
In this paper, a new multi-input Cuk-SEPIC rectifier stage for hybrid wind/solar energy systems has been presented. The features of this circuit are: 1) additional input filters are not necessary to filter out high frequency harmonics; 2) both renewable sources can be stepped up/down (supports wide ranges of PV and wind input); 3) MPPT can be realized for each source; 4) individual and simultaneous operations are supported. Simulation results have been presented to verify the features of the proposed topology