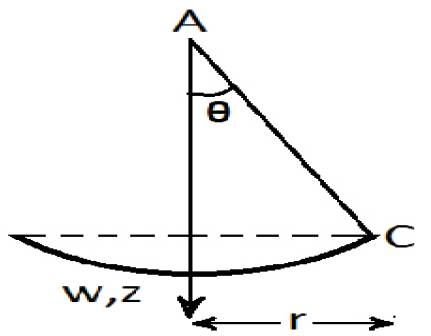
Figure 1. Portion of a thin plate or diaphragm bent to a specific radius
MEMS offer various fabrication process to fabricate diaphragms for various applications such as microphones, capacitive sensors, pressure sensor, micro-pumps etc. The working principle of all the devices is based on the force uniformly applied on the diaphragm and cause the diaphragm to deflect. The parameter optimization of the diaphragm is a challenge in order to achieve the best performance of the device.
Combination of mechanical and electrical parts in micro scales causes new challenges in both mechanical and electrical concepts. The mechanical behaviour of each component in micro and nano-scales is different from normal dimensions due to various factors that affect the normal operation of the entire device. Therefore, the design and fabrication of this kind of systems becomes more complicated which lead to get more consideration in advance. It also highlights the role of analytical approaches and simulation results to achieve the best design. Diaphragms as mechanical components of many MEMS sensors and actuators are the most important part of many systems which has to design properly [1].In this paper mechanics of diaphragm structure for circular shape will be studied according to the theory of elasticity.
When a uniform pressure is applied to a silicon micro diaphragm, deflection occurs and the internal strain of the diaphragm changes. Silicon is a piezoresistive material [2] such that its resistance changes when the internal strain varies. If the pressure sensing resistors are placed on top of the thin diaphragm, pressure can be measured by monitoring the resistance changes. In this paper along with the detailed analysis of stress, bending and displacement of circular diaphragm, a wheatstone bridge type circuitry has been used to give voltage outputs for pressure measurement. Two sensing resistors are placed inside the diaphragm and the other two reference resistors are placed outside the diaphragm.
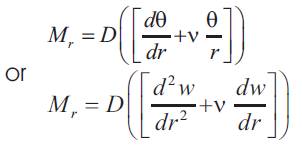
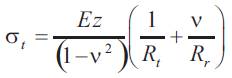
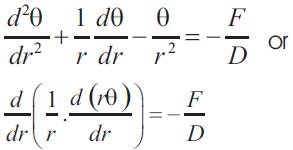
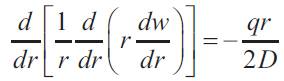
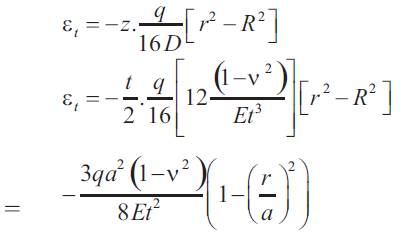
When a circular plate is under a uniform pressure, q, the governing equation can be derived in terms of cylindrical co-ordinate system as shown in Figure 1 [3]. The stress, bending moment and deflection can be derived as follows:
Figure 1. Portion of a thin plate or diaphragm bent to a specific radius
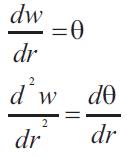
Let w be out of plane deflection at any radius 'r', as shown in Figure 1 so that:-
And let:-
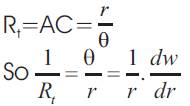
Rt= tangential or circumferential radius of curvature at r=AC
Rr=radial or meridional radius of curvature at r=BC
(refer Appendix-I)
Now from Figure 1.
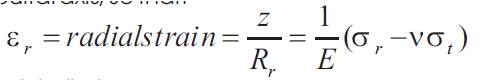
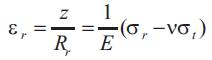
Now let z= the distance of any fibre on the plate from its neutral axis, so that:
(refer Appendix-ii)
Now since
So we can show that :-
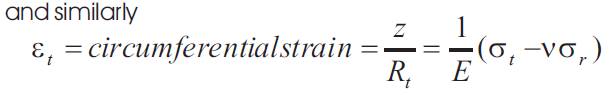
Similarly
Put equation (4) in equation (3)
Since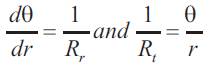 as shown above.
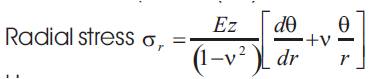
Similarly we can show that :-
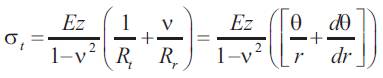
Where σr = Radius stress due to bending
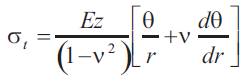
σt = Circumferential stress due to bending.
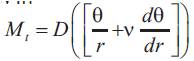
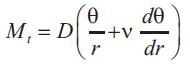
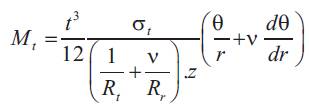
We now evaluate the bending moments in the two planes to determine maximum stress [4]
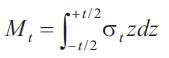
From above equation (6)
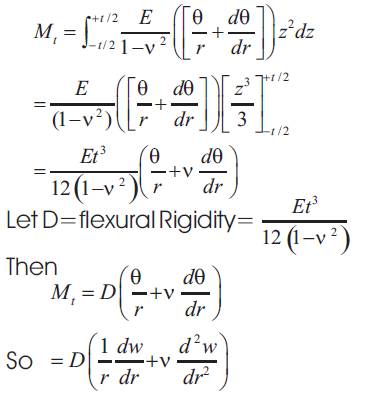
Where t= Plate thickness
So similarly the radial bending moment per unit circumferential length,
Now if:
Since
Putting equation (10) in equation (9) we get:-
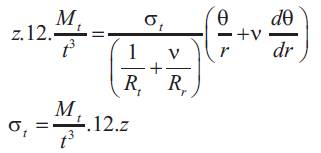
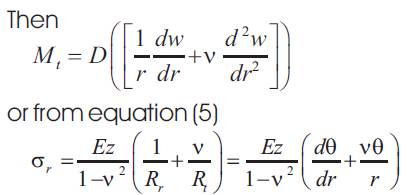
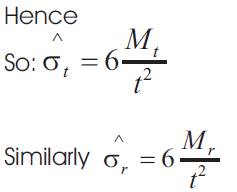
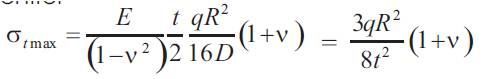
Since maximum stress is at centre at z=
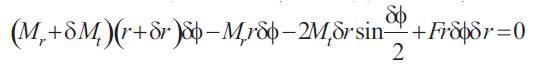
The plate differential equation can now be obtained by considering the equilibrium of the plate element as shown in the Figure2.
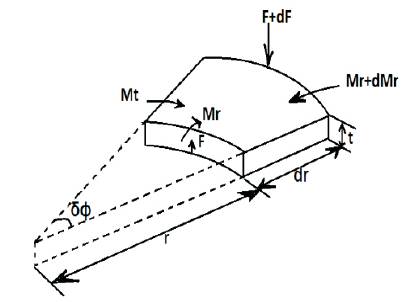
Figure 2. Small deflection of circular plate showing applied moments and forces per unit length
Now from Theory of Plates (refer Appendix-iii)
On applying limit we get:
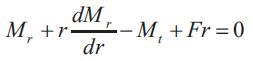
Where (F) is the shearing force per unit length
Now substituting the above equation (12) in equation (7)
After differentiating once:
Equation (12) can be re-written as:
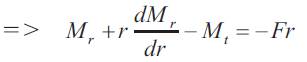
Inserting Mr ,Mt and dMr in equation (13)
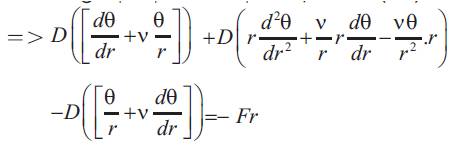
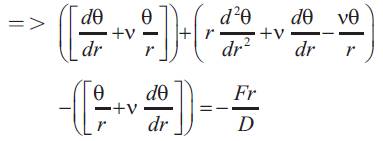
Dividing by r on both sides:-
So
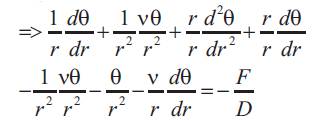
Replacing  in equation (15) we get
In the case of applied uniformly distributed loads, i.e pressure (q),the effective shear load F per unit length for use in equation (16) is found as follows[5].
At any radius r, for equilibrium, 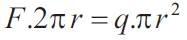
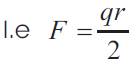
Thus for applied pressure equation (16) may be re-written as:
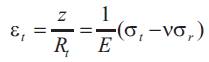
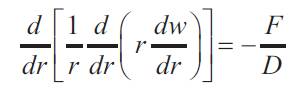
The relevant fundamental equation for the loading condition has been shown in [section 2.3] the previous section:
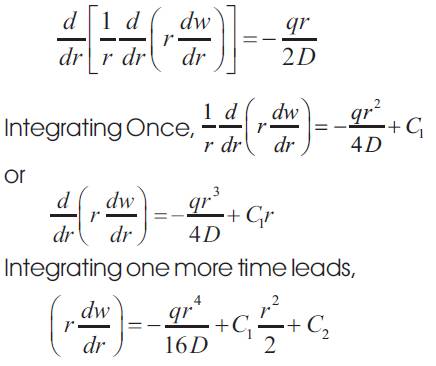
Again further integrating expression for deflection leads,
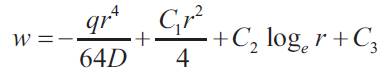
Now if the slope q is not to be infinite at the centre of the plate C2=0. Taking the origin at the centre of the deflected plate w=0 when r=0.
Therefore from equation(19) C3=0.
At the outside ,clamped edge where r=R,
Therefore substituting in the slope equation (18) leads
The maximum deflection of the plate will be at the centre, but since this has been used as the origin the deflection equation will yield w=0 at r=0; indeed. This was one of the conditions used to evaluate the constants. We must therefore determine the equivalent amount by which the end supports are assumed to move up relative to the “fixed” centre.
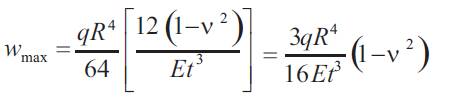
Substituting r=R in the deflection equation (19) yields [6-8]
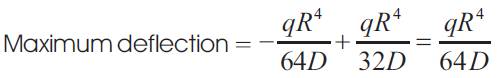
The positive value indicates, as usual, upwards deflection of the ends relative to the centre, i.e. along the positive y direction. The central deflection of the plate is thus, as expected, in the same direction as the loading, along the negative y direction (downwards).
Substituting for D,
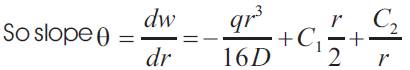
Similarly from equation (18) ,
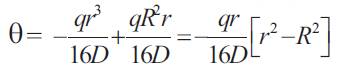
Hence slope
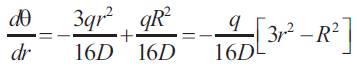
Now from equation (23)
Hence
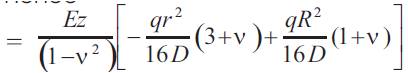
The maximum stress for the clamped edge condition will thus be obtained at the edge where r=R and at the surface of the plate where z=t/2,
Now since it has already been derived that
So using equation(23) we get:
 to zero since this only gives the point where the slope of the curve is zero. The value of the stress at this point is not as great as the value at the edge.
Similarly, We know that :
Similarly as equation (24) we have:
Unlike sr, this has the maximum value when r=0, i.e at the centre.
Now since it has already been derived that :
So using equation (22) we get:
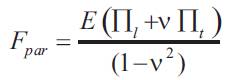
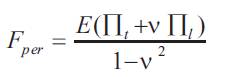
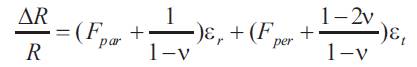
Piezoresistivity of silicon can be analyzed in terms of two directions: parallel and perpendicular to the direction of the electrical current respectively. Fpar and Fper are the gauge factors.They can be represented with respect to the piezoresistive constant as [9]:
And the change in resistance is hence written as:
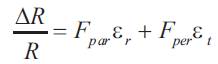
Which can further be written as:
The sensitivity of the circular diaphragm can be calculated according to the above analytical equation.
After the sensitivity distribution for the piezoresistive resistor is calculated, the optimal positions for sensing resistors are obtained. The next step is to determine the geometry of the resistors including length and shape for optimal sensitivity. In order to maximize the piezoresistive effects, line shapes resistors are designed for strain changes parallel to the direction of the input current. These line shape resistors are placed at the edges of the circular diaphragm to gain maximum sensitivity. Since misalignments are unavoidable during the fabrication processes, the sensing resistors are designed to have an non-effective portion of 2µm outside the diaphragm. Only the effective parts of the sensor that are inside the diaphragm will be active during pressure measurement.
Figure (3a) and (3b) illustrates the overall circuit design and configuration for the pressure sensor that is considered in this analysis and the wheatstone bridge circuit is used to drive and sense the response of pressure sensor respectively. A quarter sensors bridge, rather than half or full, is all that is needed to demonstrate the effect of strain on the sensor. Here R1 is the piezoresistor that is patterned on the membrane, across which a pressure differential is applied. Also R2 is the variable resistor that is used to null the voltage output Vout = VA - VB , as shown in Figure (3b), when the pressure is not applied across the membrane. Also R3 is fixed resistance to balance the bridge and R4 is the reference resistor that is identical in dimension and nominal resistance to R1. The wheatstone bridge is used since this configuration has maximum sensitivity of the output voltage Vout ,over the varied resistance. A constant voltage (RMS or dc),Vin , is used for the experimental input source for the sensor.
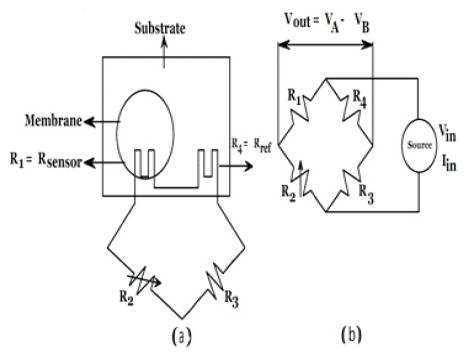
Figure 3. a). The physical configuration of the pressure sensor and circuit fabricated on a membrane suspended on a Si substrate. Rsensor is a piezoresistor that changes resistance with the strain of the membrane, across which a pressure differential is applied. b).The wheatstone quarter bridge circuit used to sense the change in resistance of Rsensor
When no pressure is applied, the output Vout can be expressed for the quarter bridge circuit [10] as shown in Figure 4 as
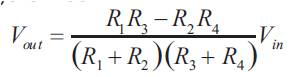
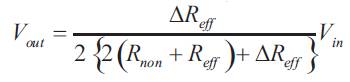
If all the resistances are the same as R at the initial stage and the pressure is applied, Vout can be expressed as
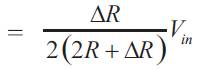
Where ΔR is the varied resistance of R.
Hence the output voltage can be written by as
The optimal length of the effective resistor can be calculated by using the above derivation.
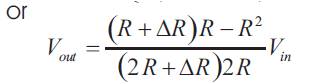
Where Δreff is the variation of the effective resistance. From equation (31), it can be seen that it is important to maximize Δreff in order to maximize the output voltage and Δrnon is the magnitude of non-effective resistance. Δreff is the value of the effective resistance. It can be derived as:
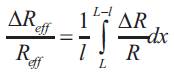
Where l is the length of the effective resistor is the characteristic length of the diaphragm(radius for a circular shape diaphragm)
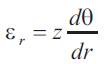
Based on the derived formulas in previous section, Figure 4 shows the strain distributions of a circular diaphragm (100 µm in diameter, 2 µm in thickness) which is under a uniform pressure of 100 psi.
Only half of the diaphragm is plotted due to symmetry. It is observed that radial strain goes from the compressive state (at the center) to the tensile state (at the edge).The circumferential strain is all the way compressive and the maximum value is at the center of the diaphragm. It can be concluded from Figure 4 that the radial strain at the edge of the diaphragm has a higher value than other positions. Figure 5 shows the simulation result for a 100µm in diameter,2µm in thickness ,circular shape diaphragm. It is observed that the effective resistor length is about 8-12 µm, the diaphragm has an optimal output. Decreasing the length will reduce the output voltage.
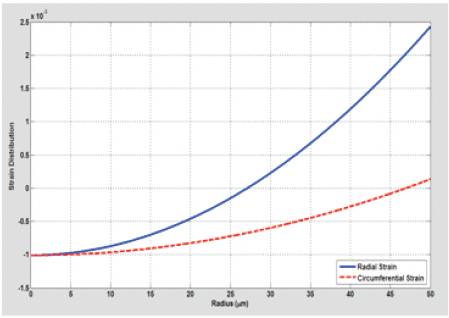
Figure 4. Radial and circumferential strain distributions of a circular shape diaphragm
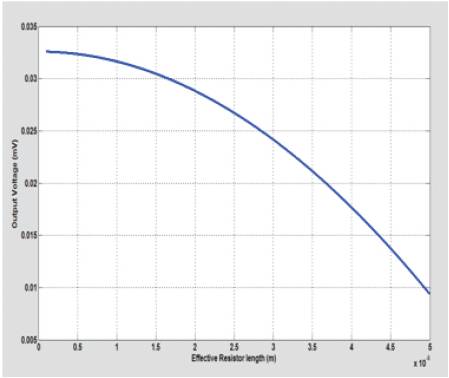
Figure 5. Optimization analysis of effective resistor length on a circular shape diaphragm
In this paper the authors provided all the analytical steps for the calculation of the various cases. The results have been matched with the existing literature. Design and modelling of pressure sensor have been successfully established. The orientation, length and position of the sensing resistors have been fully analyzed. Several specific conclusions can be drawn for the sensors geometries discussed in this paper. For circular shape diaphragms, the most sensitive portions are to be found at the edge of the diaphragm. The sensing resistors must be placed in the radial directions and the optimal length is 12µm.These optimal designs have been analyzed based on the conventional solid mechanics theories of shell and plates. Instead of using numerical analysis, analytical solutions are derived. These analytical solutions provide important design guidelines when the dimensions, shapes and orientations of the diaphragm or the sensing resistors are changed.
Summarizing, In this paper, stress, bending, displacement and deflection (small) analysis is considered which affect the operation of diaphragm under applied pressure. The shape here considered for diaphragm is circular. The purpose of this paper is to show the detailed analysis of stress and related deflection and to measure the pressure in terms of voltage signal by the use of piezoresistor sensor across a wheatstone bridge.
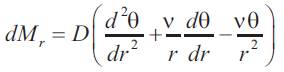
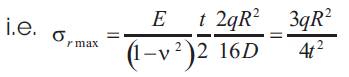
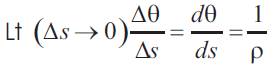
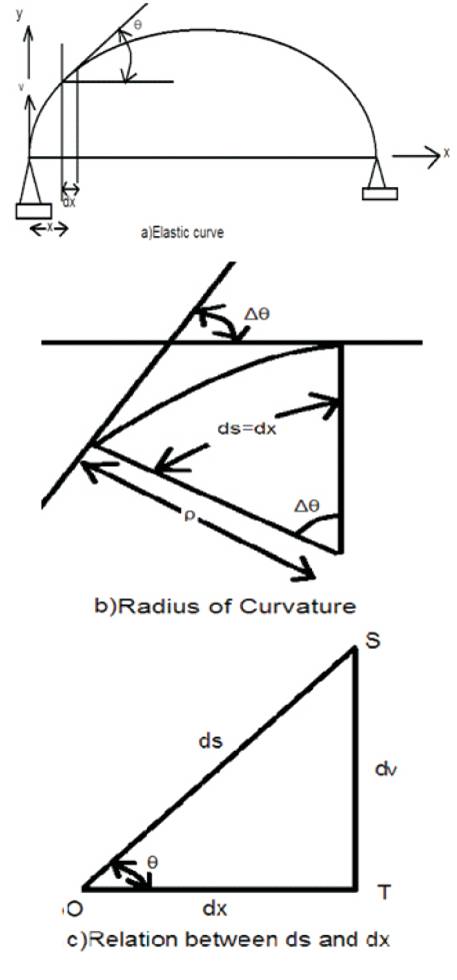
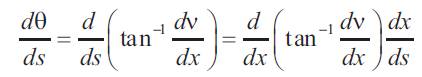
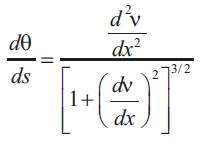
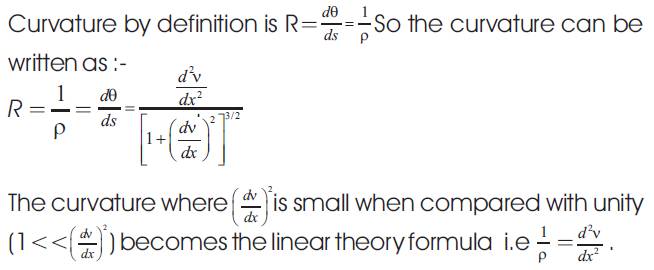
The moment-curvature relation can be derived via the radius of curvature (ρ). The elastic curve of the beam is shown in Figure (a) An elemental beam length in an enlarged section is depicted in Figure (b). The change in slope in the elemental length is Δθ. The rate of change of the slope with respect to the beam length is the inverse of the radius of curvature(ρ).
Remarks on the Moment Curvature Relationship(MCR)
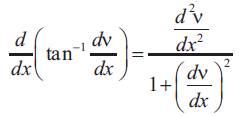
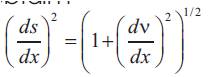
The MCR given by equation (1) assume that ds = dx, q=tan and cos q=1 because of the linear small displacement theory. MCR can be derived without the assumptions. The arc length (ds) ,axial distance (dx) and included angle (q) are marked in Figure (c). Because dx is small and in the limit, the length (ds) can be assumed to be the diagonal of the right triangle OST. The following relationships can be written for the triangle OST.
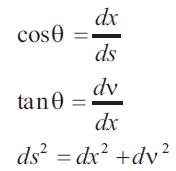
Differential calculus yields
Differentiate ds2 =dx2 + dv2 with respect to (x) obtain:
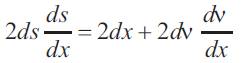
Divide both sides of equation (5) by dx and simplify to obtain :-
Substitute equation (4) and(6) in equation (3) to obtain :-
When a point of a body is acted upon by stress σx and σy in mutually perpendicular directions, the strains are found by superposing the strains due to σx and σy acting separately.
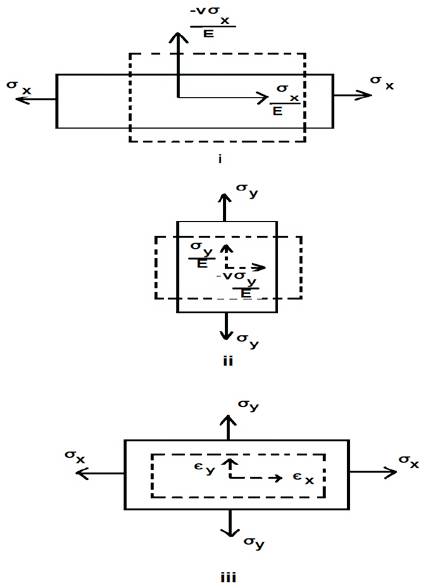
Strains in a two dimensional linear elastic stress system, the strains can be regarded as compounded of two systems corresponding to uni-axial tension in the x and y directions.
The rectangular element of material in Figure (i) is subjected to a tensile stress in the σx direction the tensile strain in the x direction is  and the compressive strain in the y-direction is
  in which E is Young's modulus ν is poisson ratio. If the element is subjected to a tensile stress σy in the y-direction as shown in figure (ii), the compressive strain in the x-direction is
  and the tensile strain in the y -direction is
The elastic strains are small and the state of strain due to both σx and σy, acting simultaneously as in Figure (iii) is found by superposing the strains of Figure (i and ii) ; taking tensile strain as positive and compressive strain as negative, the strains in the x-direction and y-direction are given; respectively by
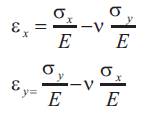
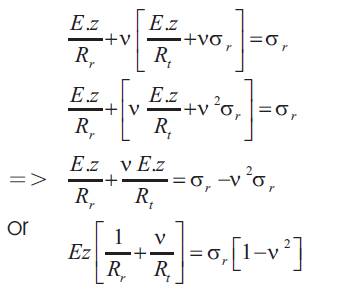
On multiplying each equation by E, we have
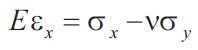
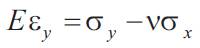
These are the elastic stress-strain relation for two dimensional system of direct stress.
Mr and Mt denote bending moments per unit length. The moment Mr acts along circumferential sections of the plate, such as the section made by the conical surface with the apex at B. Mt acts along the diameter section rz of the plate as shown in below Figure.
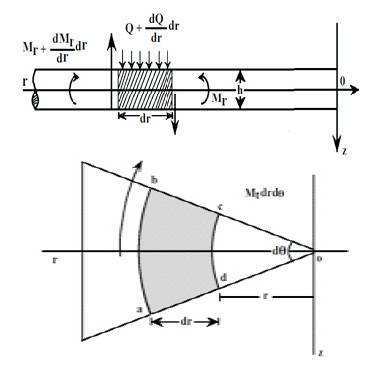
Figure shows : an element of the plate
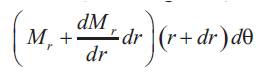
Consider an element of the plate such as element abcd as shown in above figure ,cut out from the plate by two cylindrical sections ab, cd and two diametrical sections ad and bc. The couple acting on the side cd of the element is :

The corresponding couple on the side ab is :
The couple on the side ad and bc of the element are Mtdr, and they give a resultant couple in the plane roz equal to:
From symmetry it can be concluded that the shearing force that ma act on the element must vanish on the diametrical sections of the plate but that they are usually present on cylindrical sections such as sides 'cd' and 'ab' of the element.
Denoting by 'Q' the shearing force per unit length of the cylindrical section of radius 'r', the total shearing force acting on the side 'cd' of the element is :

and the corresponding force on the side 'ab' is:
Neglecting the small difference between the shearing forces on the two opposite sides of the element , we can state that these forces give a couple in the 'rz' plane equal to:
Summing up the moments in equation (1) to equation (4) with proper signs and neglecting the moment due o external load of the element as a small quantity of higher order , we obtain the following equation of equilibrium of the element abcd:
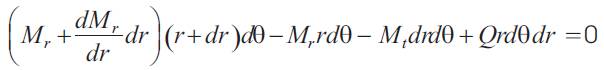
From which we find ,by neglecting a small quantity of higher order,