(1)
Now-a-days, renewable energy sources have gained a lot of importance which reduces the greenhouse gas emission and fossil fuel pollution [19]. Renewable energy is not stable and it does not give firm output power. Power grids face a major transformation for integrating renewable energy sources for the improvement of energy efficiency and allowing consumers for more control over the consumption of their energy. Renewable energy bases such as wind-turbine and photovoltaic power generators has an impact on the stability due to the variations in their outputs because of change in weather conditions. Especially the solar energy is available in day time and not in night time. To overcome the variation of output powers from wind and solar, a proper energy storage system is required. The energy storage gains lot of importance in future power supply due to increased renewable sources [5], [22]. Due to continuous demand for smart technology implementation such as batteries with renewable sources will become huge economic progress [8]. In this paper, a 25 KW BESS (Battery Energy Storage System) is considered as a countermeasure for the above mentioned contention. BESS requires bidirectional converters (AC-DC & DC-AC), here converter efficiency is to be improved for increasing the efficiency of the BESS. The performance of 25 KW converter for BESS by using novel multi inverter topology, which is estimated to be a disparate convertor topology for improving the performance and efficiency of the BESS. Finally, the results are simulated for the voltage controlled multi inverter topology at different loads, grid power, load sharing at charging, and discharging conditions are also conferred.
In the area of electricity generation and distribution system, two developments have occurred recently. The increase of renewable energy sources such as wind and solar recently and also significant activity in the design and development of good and cheaper storage devices such as batteries [12]. In electricity generation, the intermittency and variability of renewable sources, i.e., wind and solar respectively are made constant using these energy storage devices. General application for storage which can implement cleaner energy are reducing the stress of variable generation from renewable energy system on system stability [2]. In order to meet the load demand, energy generated from the renewable sources is to be dispatched. To provide peak shaving and also back-up power at distribution sub-station or at consumer site [1]. Since renewable sources’ outputs are variable in nature and requires reserve for compensating to their variability [11].
Hybrid energy storage system has featured and investigations are made as it combines two types of existing power generation sources and storage devices, which provides eminence power and performance of the storage system [19]. In order to feed constant power to the utility, storage system is required, i.e., Battery Energy Storage System. To overcome the above mentioned issues, a novel multi converter for BESS is developed, which uses control strategy for the best performance and can be implemented for different applications.
The rest of the paper is organized as follows. Section 1 presents the introduction and Battery Energy Storage Systems. Section 2 discusses about different types of battery arrangements and the analysis of the results is described in Section 3. Finally the paper is concluded.
A battery is used to store electrical energy. It is in the form chemical electro, which is advanced as electrical energy. By passing a direct current through the cell, it can be recharged after discharge, in order to discharge current which is in opposite direction [14], [15]. When the cell charges, it becomes in reverse state and is discharged, during the chemical reaction of the cell. So, electrical energy is stored in the charged cell as chemical energy which can be improved as electrical energy when cell discharges [10]. The two principal separations of a battery are as follows.
These are non-chargeable, Eg., “Dry cell” which are flash light batteries. The chemical reactions are non-reversible in these batteries.
These are rechargeable, Eg., “lead acid battery”. A general cell consists of anode and cathode electrodes, absorbed in an electrolyte appropriately. When electrodes are connected to electrical load, separation of charge takes place at the interface between one electrode and the electrolyte are both liberate electron and ion. The electron flows over the external load and ion over the electrolyte combines other electrode [13] [16].
(OCV) Open circuit voltage, the cell terminal voltage with R load = , i.e. no load. The battery capacities are of three types. They are, Energy stored (watt-hour or kilowatt-hours), Energy stored weight (watt-hours/kg), and Energy 3 stored/volume (watt-hours/m ).
The rate at which the energy stored should be taken safely out of a battery and can be restored is known as power capacity. The battery is supplemented with extreme rated power output per kg is called as specific power [10].
Specific power rating of several batteries certificates speedy performance comparisons of different types of batteries.
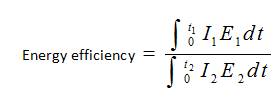
Energy efficiency of the battery is defined as,
Energy efficiency = useful energy output (watt-hrs.)/recharge- energy (watt-hrs.).
where,
I = Battery discharge current,
E =Battery charging current,
I =Battery charging current,
E =Battery charging terminal voltage,
t =Battery discharging time,
t =Battery charging time.
The above equation has two special cases, if the discharge and charge happens at constant voltages, the equation reduces to,
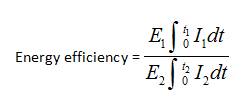
The terminal voltage multiplication provides input or output watt-hours.
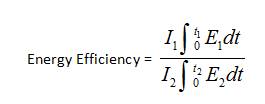
At constant currents, if the discharge and charge occurs, then equation reduces to,
The many times charging and discharging of battery at specified condition is called cycle life. This battery cycle life may vary according to the depth of discharge, as deep discharge leads to short cycle life.
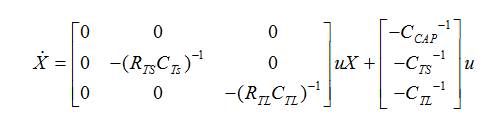
Therefore, cells combination provides desired power output. The energy storage capacity of a battery is frequently expressed in ampere hours, this is the product of the current (in amperes) the battery can deliver, multiplied by the delivery time (in hours) [17], [18]. The usable energy (in watt hours) stored in the ampere hour capacity multiplied by the emf of 12 volts and 50 ampere hour capacity, delivers 12×50=600 watt-hours (or 0.6 kilowatthours) of energy. The equivalent circuit of the battery is shown in Figure 1.
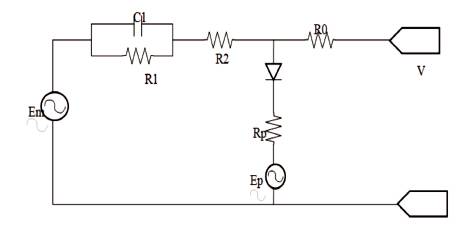
Figure 1. Battery Equivalent Circuit
The practical storage capacity of a battery depends on the discharge rate or discharge time. Increases in the discharge rate (or decrease in discharge time) for a given battery results in a decrease in the amount of electrical energy that can be delivered. This effect is marked in the lead- acid battery commonly used in automobiles. For example, an energy capacity battery of 0.6 kilowatt hour (kW-hr) at 2.5 amperes discharge rate might have a capacity of only 0.24 kW-hr at 150 amperes. However, upon standing after a rapid discharge, Partial recovery and transfer are the terms which a battery can experience extra energy storage. In a lead acid cell, the recovery arises mainly from local readjustments in the acid concentration which decreases when the cell is discharged [9].
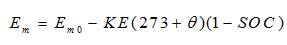
where,
E is the open-circuit voltage (EMF) in volts,
E is the open-circuit voltage at full charge in volts, m0
KE is a constant in volts / °C,
KE is a constant in volts / °C,
is electrolyte temperature in °C,
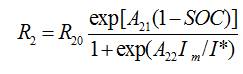
SOC was battery state of charge. Terminal Resistance,
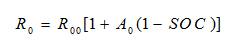
where,
R was a resistance in Ohms,
R was the value of R at SOC=1 in Ohms,
A was a constant
SOC was battery state of charge.
Main Branch Resistance, R ,
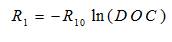
where,
R was a main branch resistance in Ohms,
R was a constant in Ohms,
DOC was battery depth of charge.
Main Branch Capacitance,
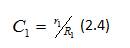
C was a main branch capacitance in Farads,
r was a main branch time constant in seconds
R was a main branch resistance in Ohms.
Main Branch Resistance R ,
R was a main branch resistance in Ohms,
R was a constant in Ohms,
A was a constant,
A was a constant,
E was the open- circuit voltage (EMF) in volts,
SOC was battery state of charge,
I was the main branch current in Amps,
I* was the a nominal battery current in Amps.
Parasitic Branch Current is,
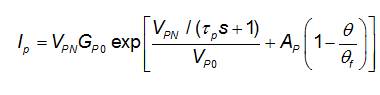
I was the current loss in the parasitic branch,
V was the voltage at the parasitic branch,
G was a constant in seconds,
T was a parasitic branch time constant in seconds,
V was a constant in volts,
A was a constant,
q was electrolyte temperature in °C,
q was electrolyte freezing temperature in °C.
Extracted Charge,
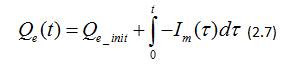
Q was the extracted charge in Amp-seconds
Equinity was the initial extracted charge in Amp-seconds,
I was the main branch current in Amps,
was an integration time variable, t was the simulation time in seconds. Total Capacity,
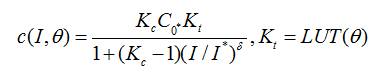
where,
K was a constant,
C was the no-load capacity at 0 °C in Amp-seconds
K was a temperature dependent look-up table,
was electrolyte temperature in °C,
I was the discharge current in Amps [7],
I was the a nominal battery current in Amps,
constant.
State of Charge and Depth of Charge,
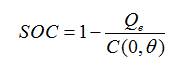
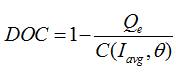
SOC was battery state of charge,
DOC was battery depth of charge,
Q was the battery's charge in Amp-seconds,
C was the battery's capacity in Amp-seconds,
temperature in °C
was the mean discharge current in Amps.
Estimate of Average Current,
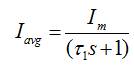
where,
I was the mean discharge current in Amps,
I was the main branch current in Amps,
was a main branch time constant in seconds.
Electrolyte model,
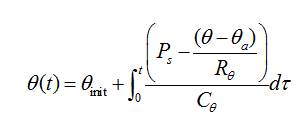
where,
was the battery's temperature in °C,
was the ambient temperature in °C,
the battery's initial temperature in °C, assumed to init be equal to the surrounding ambient temperature,
was the I R power loss of R and R in Watts,
was the thermal resistance in °C / Watts,
was the thermal capacitance in Joules / °C,
T was an integration time variable,
t was the simulation time in seconds.
An equivalent Ordinary Differential Equation (ODE) is,
The state of charge over the entire test period was found using the current data obtained from the test [23]. Equation (18) was obtained from (17) and used to perform this calculation.
Several voltage source SPWM inverters uses signals of common sinusoidal modulating and phase shifted triangular carrier operates in tandem with coupled outputs over current sharing inductors, increasing the overall rating to megawatt range. The multi-inverter system based on phase shifted triangular carrier technique involves two or more SPWM inverters are connected in series and/or parallel [3]. This not only increases the megavolt amperes rating of the system, but also enables the triangular carrier frequency f to be increased effectively to N.f .
The multi-converter system exhibits direct control of magnitude and/or frequency, output to input linearity, and power quality with the possibility of implementation of sophisticated modern control theory.
In the multi-converter system, the paralleling of inverters is done through coupling inductors. The power circuit of each inverter consists of six IGBTs. The switching devices are numbered in the sequence in which they are triggered to obtain voltages V , V , and V at the output terminals of ab bc ca the inverter [20], [21]. The control circuit of the two inverters is similar to that of the single Sinusoidal Pulse Width- Modulation (SPWM) inverter. The only difference is that the triangular carrier wave for the second inverter is phase shifted by T /2 period vis-à-vis respect to the triangular C carrier wave of the first inverter.
A salient feature or property of the phase shifted triangular carrier technique is that the amplified modulating signals in all the converter modules have the same constant gain and there is no phase shift for low values of carrier ratio such as, f = 3 f .
The two side band components have the same fundamental frequency, f . The phasor addition of the two m sideband components to the amplified modulating signal yield fundamental frequency output voltage, which are unbalanced. Therefore the modules cannot be linked directly in parallel for low value of the carrier ratio since the resulting “unbalance currents” will be disappointingly high.
Large value of carrier ratio permits to connect the converter modules in parallel without serious AC current unbalance from the individual modules. The equivalent carrier to modulation frequency ratio N. f is reflected in the high c quality waveform of the total current. When f = 9 and c higher, the side band harmonics do not interface with the modulating signals [4]. All the fundamental components are equal in magnitude and are in phase, so that the converter modules can be connected directly in parallel. The currents through individual modules will still contain harmonics associated with the triangular carrier frequency, which must be reduced by filter inductance [6].
In this work, multi inverter topology is used, these two are connected in parallel. The components design and developments are discussed below.
Figure 2 explains the operation of Battery based power conditioning system. It shows the fixed DC voltage of battery is converted to variable DC voltage by boost converter and also the way it is inverted back to AC by the help of three phase fully controlled voltage source inverter. Here, two power conditioning units are connected in parallel to the utility/load by the means of three phase isolated transformer. The variation in load power is observed by connecting a circuit breaker [24]. A proper control strategy is applied to maintain proper synchronisation with the load and to maintain a constant voltage for the changes in load. The above mentioned control strategy is explained with the help of control blocks shown in Figure 3.
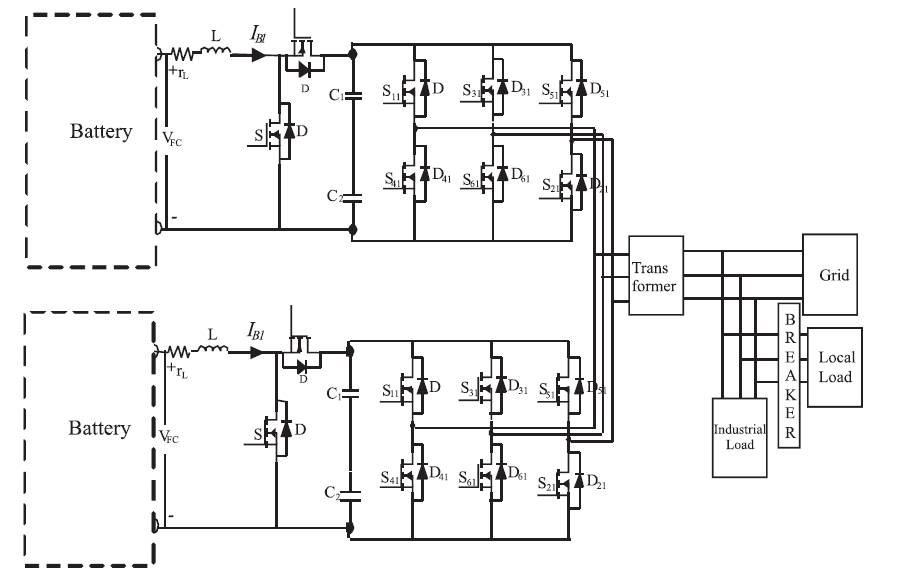
Figure 2. BESS based Power Conditioning System
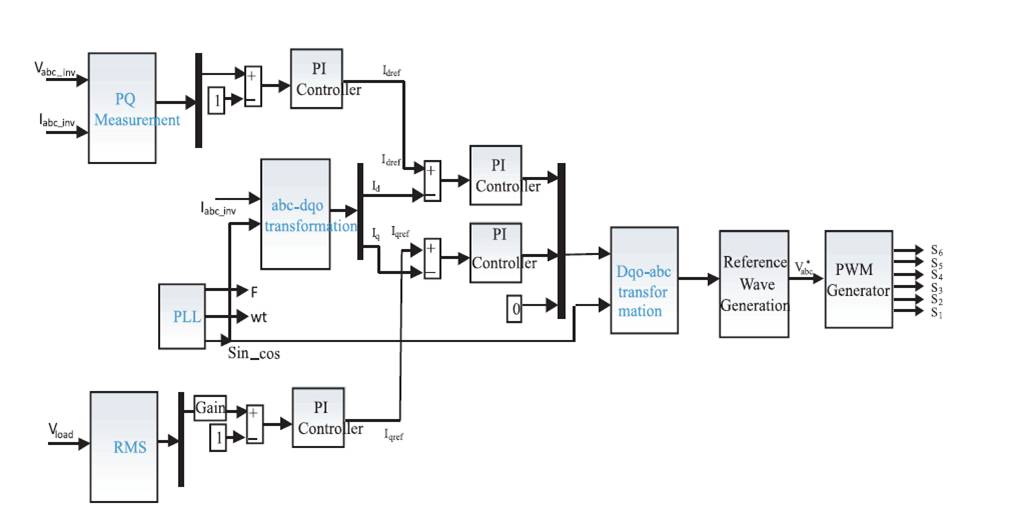
Figure 3. Control Strategy of Grid Connected Battery Energy Storage System
Figure 4 shows the response of different battery parameters. X-axis represents the time in sec and Y-axis consists of battery parameters, i.e. Battery voltage (V ), b battery current (I ), State Of Charge (SOC). During the time 0 to 0.5 sec, the battery is in charging condition and during 0.5 to 1 sec, the battery is in discharge condition. In charging condition, the voltage is shown constant at 920 V and battery current is in between 0 to 100 A with SOC at 100%. In discharging condition, voltage is constant at 920 V, current is -100A, by maintaining constant SOC at 100%, whereas for SOC at 0 sec, slight variation takes place due to starting condition and from 0.4 to 0.6 sec, slight variations takes place due to the change from charge condition to discharge condition.
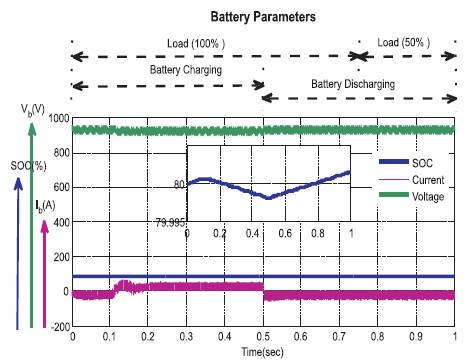
Figure 4. Battery Parameters under Load varying and Battery Charging and Discharging Conditions
Figure 5 shows the variation of direct axis current i , d quadrature axis current i for the battery charging, and q discharging conditions with the variation of loads. Here Xaxis is the time and Y-axis is the I , I components. From the d q figure it is noticed that during the time interval 0 to 0.5 sec, battery is in charging condition, whereas 0.5 to 1 battery is in discharge condition and in battery charging condition, I d values lies in between 2 to 4 and I value is in 0. In battery q discharging condition, the values of I and I are in same d q values, but in negative dimensions. At 100% load, i.e. at 0.75 sec, the values of i and i are constant and at d q remaining 50%, load the values of I and I are constant.
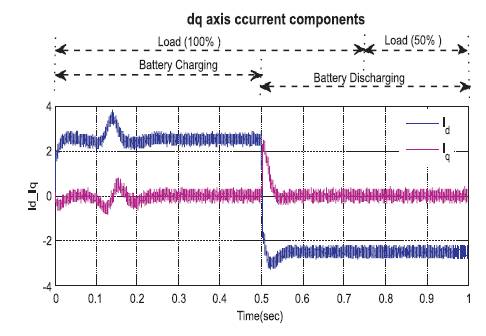
Figure 5. dq-axis Current Components under Load varying and Battery Charging and Discharging Conditions
Figure 6 explains the direct axis current I (A) and quadrature current I (A). Here the wave form explains the perfect q operation of control applied. From the figure it is clearly shown that, the actual value of current I actual exactly d tracking the reference value I ref, and the quadrature d current I at exactly 0. This entire operation was specified q during the charging time of 0 to 0.5 sec and discharging time of 0.5 to 1 sec.
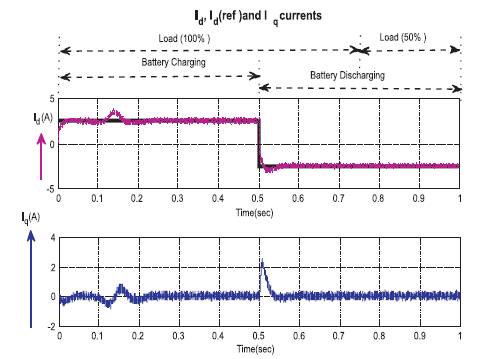
Figure 6. i , i (ref) and I Currents under Load varying and d q q Battery Charging and Discharging Conditions
Figure 7 gives the flow of current to the utility/load from the inverters. The current Iinv shows the total value of current flowing to the grid from the inverter. The current Iinv1 shows the current flowing from inverter 1 and the current Iinv2 shows the current flowing from inverter 2. Both the currents from inverters 1 and 2 combine together and flows into the load.
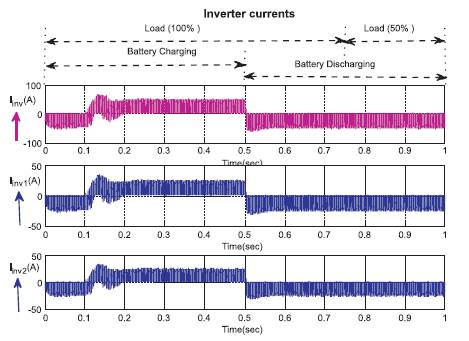
Figure 7. Inverter Currents under Load varying and Battery Charging and Discharging Conditions
As the voltage maintains constant and currents keep varying during the time of charging and discharging, the required power is generated as shown below in Figure 8.
In Figure 8, time (sec) lies on x-axis and P (KW) on y-axis. bat During the time 0 to 0.5 sec, the battery is in charging condition and during 0.5 to 1 sec, the battery is in discharge condition. The battery power is 25 KW during charging and same 25 KW in discharging condition.
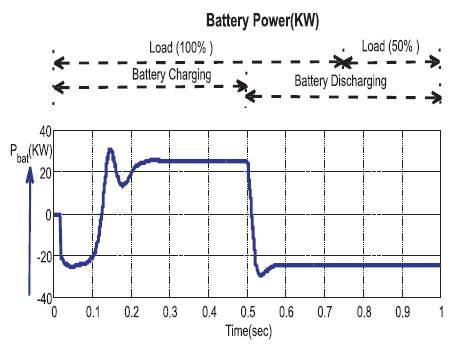
Figure 8. Battery Power under Load varying and Battery Charging and Discharging Conditions
Figure 9 explains the results of load power variation during the charging and discharging modes. Here, it is shown that the battery gets and delivers a power of 20 kW during the charging mode and delivers the power of 10 kW in the discharging mode. It is clearly shown that during the time of battery charging from 0 to 0.75 sec, the battery continuously delivers a power of 20 kW and from 0.75 to 1 sec delivers a power of 10 kW.
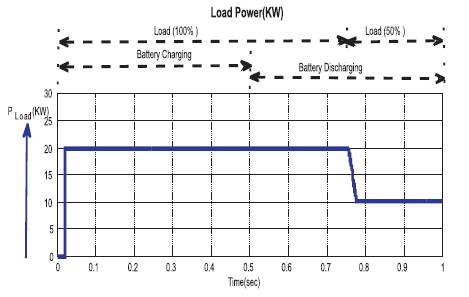
Figure 9. Load Power (KW) under Load varying and Battery Charging and Discharging Conditions
Figure 10 shows the grid power variation when connected from a battery to the load. Here it shows that the grid delivers power to the load at the time of battery charging and draws the power at the time of discharging of battery.
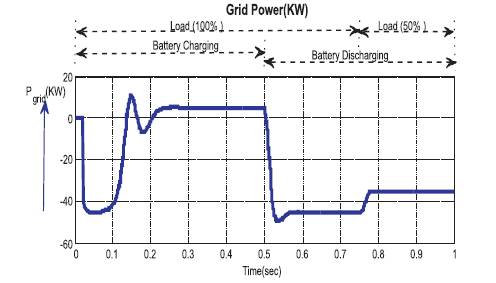
Figure 10. Grid Power (KW) under Load varying and Battery Charging and Discharging Conditions
Figure 11 shows the voltage across the point of common coupling. It shows that a voltage is applied during the time of battery charging and discharging conditions. The control circuit proves that the voltage is perfectly constant even though there is a change in battery operating conditions.
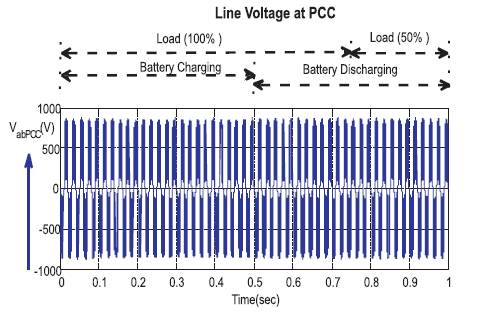
Figure 11. Line Voltage at PCC under Load varying and Battery Charging and Discharging Conditions
Figure 12 shows the line voltages of the inverter. It shows that a constant voltage from DC side to AC side by means of a simple three phase inverter. The inverter operates perfectly during the time of battery charging and discharging conditions by continuously converting a constant voltage.
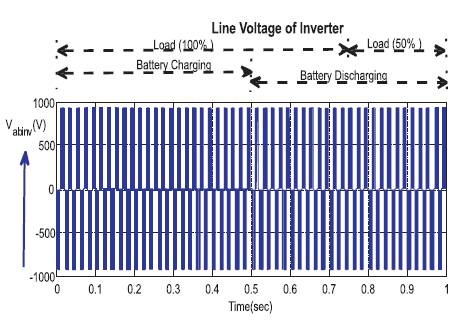
Figure 12. Line Voltage of Inverter under Load varying and Battery Charging and Discharging Conditions
Fi g u r e 1 3 s h o w s t h e g r i d c h a r a c t e r i s t i c s o f delivering/utilisation of power from the battery to the load. During the time of charging of battery and if there is a requirement to deliver a load of 100%, then the grid is used to deliver the power to the load in addition to battery. During the time of discharging or if there is a sudden reduction in load, the battery itself use to supply the power, in this case the current can be observed minimum as the voltage has to be maintained constant and if battery power is more the grid use to draw the remaining value of power.
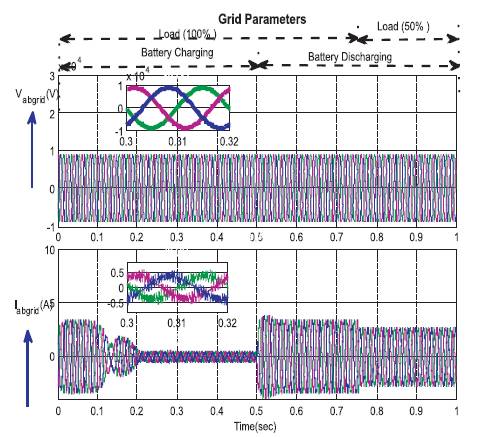
Figure 13. Grid Parameters such as Voltage and Currents under Load varying and Battery Charging and Discharging Conditions
Figure 14 shows the inverter parameters of three phase line voltages and current waveforms. It is observed that a constant voltage is maintained throughout the operation and constant current flowing into the primary of the transformer even when the battery changes its mode from charging to discharging.
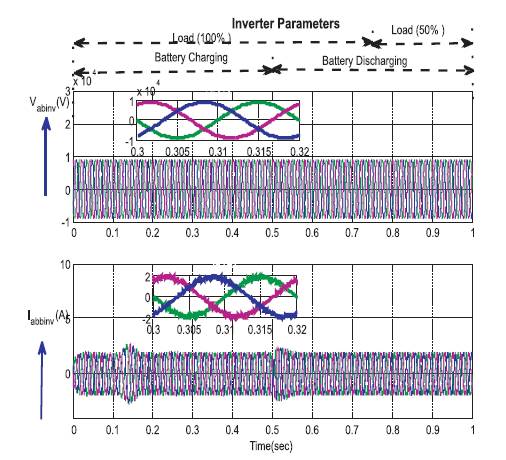
Figure 14. Inverter Parameters such as Voltage and Currents under Load varying and Battery Charging and Discharging Conditions
Figure 15 gives the behaviour of load side voltages and currents. It is shown that when the battery is in charging mode and a 100% load is applied, the voltage is maintained constant and doesn't change even the load Griddrops to 50% or battery jumps to discharging mode. As the voltage is maintained constant throughout the operation, it is observed that the fall of current at 0.75 sec when the load drops to 50%. For the above operation, the modulation index is shown in Figure 16 and a sudden transition can be observed when the battery is shifting from charging mode to discharging mode.
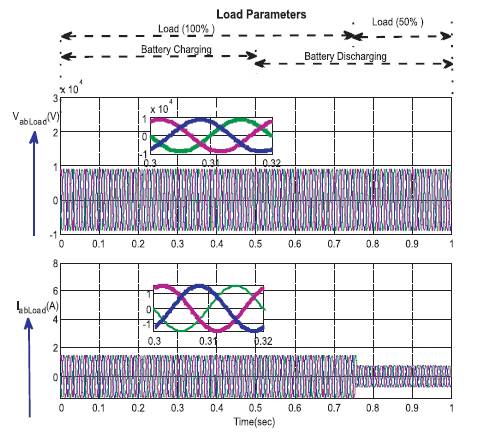
Figure 15. Load Parameter such as Voltage and Currents under Load varying and Battery Charging and Discharging Conditions
Figure 17 shows the load sharing between the utility and the battery when it is connected to a variable load. During the charging mode for a time period of 0 to 0.5 sec and when the load is about 20 kW, the battery delivers a power of 25 kW and thereby the grid draws the additional power of 5 kW which was excess to the load and during the discharging mode of operation from 0.5 sec to 0.75 sec as the load continued to be 20 kW and the battery is to inject the required power and the remaining power is fed again to load.
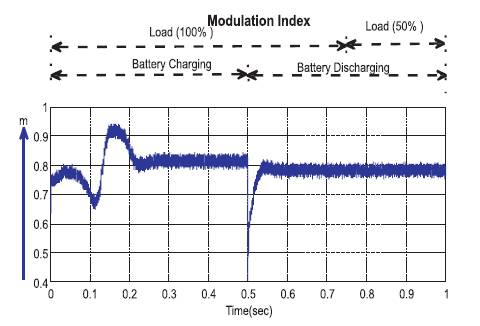
Figure 16. Modulation Index
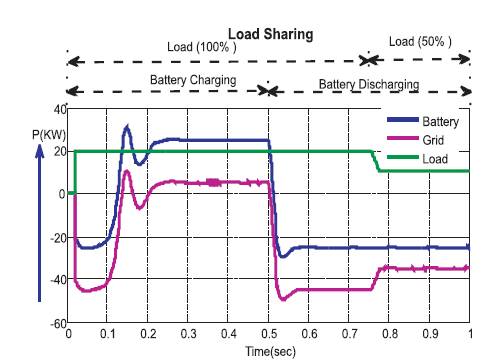
Figure 17. Load Sharing
This paper demonstrates the relevance of energy storage system to the grid power and the simulation of the designed voltage controlled multi-inverter topology for battery based power conditioning system has been developed and made possible for practical applications. A proper control strategy is applied to maintain proper synchronisation and to obtain constant voltage for any changes in load. The battery power conditioning system behaves well during charging and discharging conditions at different load levels, the State Of Charge is also within the range. In the BESS system, dq axis current maintained is exactly coincident with the reference value. In the presence of BESS system voltage is maintained constant and currents vary during the time of charging and discharging and required power flow with variation in load. Inverter output voltage and current are uniformly maintained irrespective of the charging and discharging mode of the Battery. Load sharing between the utility and battery at different load conditions are also analysed.
It can be implemented for practical applications which improves the continuity, reliability, and stability of the system. The control strategy can be changed to digital controllers for still better accuracy and operation of the system. Further 'N' number of batteries can be extended for improving the range of the systems’ performance. As the extension for the paper, renewable sources can be included at each of the BESS.