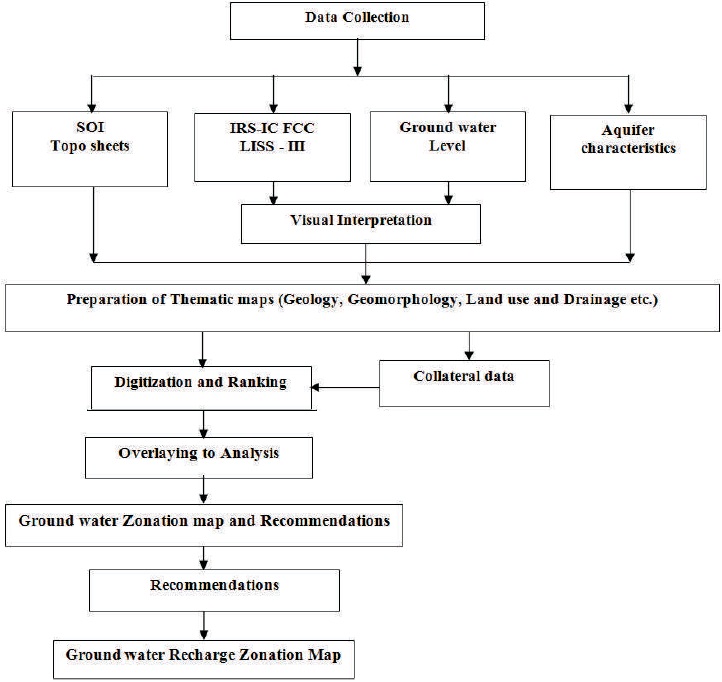
Figure 1. Flowchart showing the Proposed Methodology to Identify the Groundwater Recharge Zonation
Water is an essential source to people and the largest available source of freshwater lies underground. Groundwater is an important source of water supply throughout the world. With the increasing demand of groundwater for various activities, the groundwater potential quickly declines. In order to prevent the aquifers from drastic depletion, the groundwater recharge is very essential. This study attempts to identify the favorable areas for groundwater recharge zones and to suggest the suitable recharge structures to augment the aquifer system of the study area using Remote Sensing (RS) and Geographical Information System (GIS). The various thematic maps, such as Geomorphology, Geology and lineaments, Soil, Slope, Land use/Land cover, Drainage, Runoff, Depth to weathered zone, Groundwater level fluctuation, and Water quality are taken for the analysis. The favorable areas for groundwater recharge have to be categorized as highly favorable, moderately favorable, less favorable, and poor.
Water is an essential commodity for the advancement of civilization and rapid growth of industrial sectors besides agricultural activities. Groundwater is one of the most important natural resources. In India, more than 90% of rural and nearly 30% of urban population depend on groundwater to meet their domestic requirements. In addition it accounts for nearly 60% of total irrigation potential in the country. Groundwater distribution is not uniform and is subject to wide spatio-temporal variations depending upon the underlying geometry, surface expressions, etc. Hence to understand the movement and occurrence of groundwater, the characteristics of aquifer, such as Geology, Geomorphology, structural setup, and recharging conditions need a thorough study. In Tamil Nadu, the available surface water has been utilized to a maximum extent. The excessive utilization of groundwater and deficit rainfall lead to rapid depletion of groundwater. This has created a greater interest in identifying the recharge areas and storing seasonally variable rainfall from runoff into sea. In order to locate groundwater potential zones, groundwater investigation has been carried out. The occurrence and movement of the groundwater is not visible directly on the surface of the earth. From the interpretation of satellite imageries, in conjunction with sufficient ground truth information, it is possible to derive significant information on geology, geomorphology, structural pattern, and recharge conditions, which ultimately define the groundwater regime.
With the tremendous population, rapid industrial development, and advancements in civilization, the demand for water has also been increasing multiple folds. Proper planning and development of the two potential resources such as surface water and groundwater can meet the increasing water demand. The construction rate of multistoried apartment buildings has vastly increased during last decades and indiscriminate sinking of borewells to a depth of 15 m to 40 m in each complex to augment the water supply has depressed the water table to critical levels in some of the areas. Since there is very little natural ground surface left for infiltration, the major portion of the rainfall is discharged as surface runoff. An integrated study covering the aspect of groundwater recharge is a crucial requirement of the present day (Choudhury, 1999).
The GIS technology provides suitable alternatives for efficient management of large and complex databases. The study focuses on development of remote sensing and GIS based analysis and groundwater recharge studies in the area. The use of remote sensing technology involves large amount of spatial data management, which requires an efficient system to handle data. Agilasankar (1990) identified locations for water harvesting structure in drought prone areas using Remote Sensing techniques.
The themes, that are most applicable for the groundwater potential zones targeting, are Geomorphology, Soil, Slope, Drainage, etc., and these thematic maps were prepared and used as input data in GIS Environment (Burrough, McDonnell, McDonnell, & Lloyd, 2015). Rao, Chakradhar, and Srinivas (2001) have discussed to assess groundwater favorable zones for development and exploration with the help of geomorphological units and associated features. Intersection of lineaments and lineaments parallel to the drainage network can give better yield than the other areas.
The following are the objectives of this study,
The recharge of groundwater takes place directly by infiltration of the precipitation or of the surface water in the outcrop areas of water bearing formations or indirectly by contributions of other hydrogeological structures or of adjacent aquifers (Gheorghe, 1978). The groundwater recharges seldom lend it to be measured directly (Penman, 1950; Grindley, 1970), viewed recharge as a function of effective precipitation (Precipitation minus Evapotransipiration), which depends on land use pattern. Though only very few studies have been made using remotely sensed data and GIS and Groundwater recharge.
Bobba, Bukata, and Jerome (1992) have investigated the use of digital satellite data as a tool in identifying the potential groundwater flow system areas. Krishnamurthy and Srinivas (1995) have described a methodology to demarcate the groundwater potential zones of Marudaiyar basin, Tamil Nadu. In the study, the different thematic maps were prepared using remotely sensed data as well as drainage density and slope classes from survey of India topographical sheets. All the thematic layers were integrated and analyzed using a model developed with logical conditions in the GIS.
Rao and Jugran (2003) have identified the applications of Remote Sensing and Geographical Information Systems (GIS) and provided an effective method for development and management of water resources. Using remote sensing and GIS technology, locations like hard rock terrain were delineated with high groundwater potential.
Jegankumar, Indira, Libiha, and Rahaman (2018) have studied to demarcate the groundwater potential zones of Jalluttu watershed, for resourceful use of available water resources carried out by the Multi-Criteria Decision Making technique. For each theme, weightage and ranks were applied to work out the groundwater potential. Based on the derived data, groundwater potential of the study area was categorized into excellent, good, moderate, and poor.
Savita et al. (2018) have identified the groundwater potential zones by using RS and GIS. The behavior of geology, geomorphology, soil, slope, land use/ land cover, and drainage density characteristics with respect to groundwater potential zones were also delineated, viz., very good, good, moderate, and poor.
In the present study, attempts are made to develop a suitable GIS based model, for delineating groundwater potential zones by integrating different thematic layers, which have direct control on groundwater occurrence. The thematic layers are prepared either from remote sensing data or from data collected by conventional surveys. The GIS based groundwater demarcation developed in the present exercise is built with the relevant logical conditions and reasoning, hence the same method can be used with appropriate modifications.
A Subwatershed of Lower Varaha Watershed (4C1D2c), Varahanadhi Basin, Tamilnadu, India is considered for this study. The study area has the extend of North Latitudes 11° 55' and 12° 30' and East Longitudes 79° 05' and 80° 05' with an area of 177.05 sq.km. The river Varaha Nadhi has it source at Periyeri in Melumalayanur Taluk of Villupuram District in Tamil Nadu. The Vedur reservoir is located at 15 km from Thindivanam. Its capacity is 18 MCM. It has two canals for discharging outflow. The main tributaries of Varaha Nadhi are Annamangalam, Nariyar, Tondiar, Pambaiyar, Pambai channel, and Chengai Odai. The Varaha Nadhi basin is bounded by Palar Basin on the North, Ponnaiyar Basin on the West and South, and Bay of Bengal on the East. Basically, this is a rural watershed with more than 50% of cropland. The main source is tanks and dug wells apart from rainfall.
The climate in the study area is tropical with an average temperature of 30.6 °C, which includes average maximum of 32 °C and average minimum of 29.4 °C. About 45% of annual rainfall occurs during the Northeast monsoon and about 43% of annual rainfall occurs during the Southwest monsoon. The least rainfall months are February, March, and April. The annual average monthly rainfall for the past 30 years is about 1100 mm (Gingee).
The major part of the area is covered by hornblende biotite gneiss charnokite of crystalline rocks and alluvium deposits.
The predominant landform in the study area is Structural hills. Besides this the other landform units observed are buried pediment deep, buried pediment shallow, pediment, flood plain, outcrop, and bazada.
The general slope of the land is from West to East and there is no appreciable change in level from North to South.
The soils are, in general, moderately deep to very deep, calcareous fine loamy to fine clay loam, moderately drained and developed from gneissic parent material. The surface soil ranges from sandy clay loam to sandy clay in texture with the subsoil ranging from sandy clay to silty clay loam. The following Hydrological soil group A, B, and C exist in this area.
The major land uses, found in the study area are Agriculture and Waterbody. About 80% of total land is utilized for agricultural purpose and the remaining area covers the waterbodies, settlement, etc.
The main objective of the present study is to identify the groundwater potential recharge zones for the development of groundwater resources using Remote Sensing data and GIS techniques (Dileep, Jacob, Martin, Jose, & George, 2019). The study area is part of Lower Varaha watershed comprising parts of Vikravandi, Koliyanur, Gingee, and Kannai blocks of Villupuram district, Tamil Nadu.
The data and data products, used in the present study, can be classified into two categories namely,
Quantitative assessment of groundwater recharge is an important issue in groundwater development. Estimation of groundwater recharge requires proper understanding of the recharge and discharge process and their interrelationship with geological, geomorphological, soil, land use, and climatic factors. There are various methods in use for the quantitative evolution of groundwater recharge, (a) Groundwater fluctuation and specific yield method (b) Rainfall infiltration method, and (c) Soil moisture balance method (Thornthwaite & Mather, 1957). In the present study, the groundwater recharge is evaluated by using the GWEM-1997 (Rajagopalan, 1998).
Central Groundwater Board, Ministry of Water Resources, Government of India developed “Groundwater Estimation Methodology – 1997” (GEC norms), for groundwater assessment in India (Rajagopalan, 1998). The main aim of this methodology is to achieve uniformity in the groundwater assessment throughout our country. For this purpose, the GEC-1997 methodology is found very useful to prepare unique groundwater resources availability database for the whole country. Instead of going for complicated groundwater models, this methodology will provide a simple and uniform formatted procedure for groundwater assessment.
This report also recommends the watershed-based groundwater assessment in hard rock terrain for the following reasons: (i) The undulating topography in the hard rock terrain allows easy demarcation of a hydrologic unit like watershed, (ii) The boundary of a watershed in hard-rock terrain mostly coincides with the groundwater divide as a result of which the groundwater balance can be made a veritable very conveniently (Tyagi & Seethapathi, 1997). The report recommends block or taluk based groundwater assessment in alluvial terrain, as it is difficult to demarcate the boundaries of the watershed due to flatness of the alluvial areas.
Water Level Fluctuation method for Monsoon season,
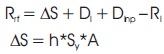
Groundwater balance equation
Rrf = ∆S + Di + Dinp - Ri
∆S = h*Sy*A
where,
∆S = Change in Storage; h = Rise or Fall in GW level
Sy = Specific yield; A = Area of well thiessen polygon
Di = Draft for irrigation
Dinp = Draft for domestic and industrial uses and,
Ri = Recharge from field irrigation
Rainfall infiltration factor method for Non-monsoon season,
Rainfall recharge = f*A* Normal non-monsoon rainfall
where,
f = Rainfall infiltration factor
A = Area of computation for recharge
Total recharge = Monsoon recharge + Non-monsoon recharge
Central Groundwater Board, Ministry of Water Resources, (Rajagopalan, 1998), Government of India specifies the details, for groundwater assessment in India, as given below:
5.5.1 Groundwater Year
South West (June to September) and North East (October to December) monsoons.
Groundwater year : June – May
Monsoon Season : June – December
Non-monsoon Season : October – May
Pre-monsoon interval : May (Previous)
Post-monsoon interval : January (Next)
The methodology as recommended here may be adopted in future groundwater resource estimation, the proposed methodology Flowchart in this study is presented in Figure 1.
Figure 1. Flowchart showing the Proposed Methodology to Identify the Groundwater Recharge Zonation
Groundwater potential zones can be located by proper selection of themes like geomorphology, geology, soil, slope, lineament density, etc. The integration of the themes to achieve the goal is dealt in this study. Each thematic map is assigned weightages based on their importance and consensus. Then, in each the thematic map numbers of variables are studied and the ranks are assigned based on their influence over other parameter.
The decision rule developed for the analysis of groundwater potential is prescribed in Table 1.
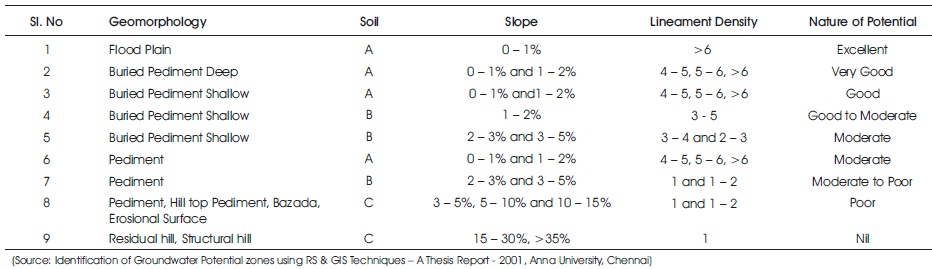
Table 1. Decision Rule
All the above analyzed maps are superimposed, one over other in the ARC/INFO Environment, to get the final map showing the groundwater potential zones. The overlay analysis is carried out to get the final output map showing the groundwater potential zones for the further exploration works pertaining to the water supply schemes. The final output has four groups based on the priority as Excellent, Good, Moderate, and Poor (Nagarajan, 2013).
The areas having Excellent to Good groundwater potential zones have a higher lineament density, less slope (0 – 1 %), double-crop land use pattern, with more water bodies available for recharging this potential area. The areas having Good to Moderate potential has Moderate lineament density.
The areas having Moderate to Poor potential has the less devoid of lineament, the location of these observation wells and the thiessen polygon representing these controlled wells in Table 2 and also block-wise domestic and irrigation draft of the study area are presented in Table 3. The Thiessen polygon map is prepared using GIS software, there are eight observation well located with the influence of groundwater level polygon map are shown in Figure 2.
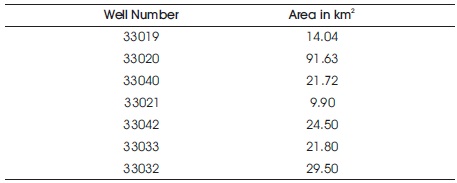
Table 2. Location Well and Area
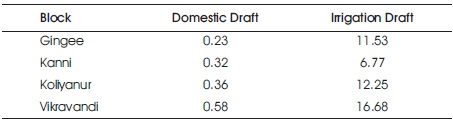
Table 3. Block Wise Domestic and Irrigation Draft
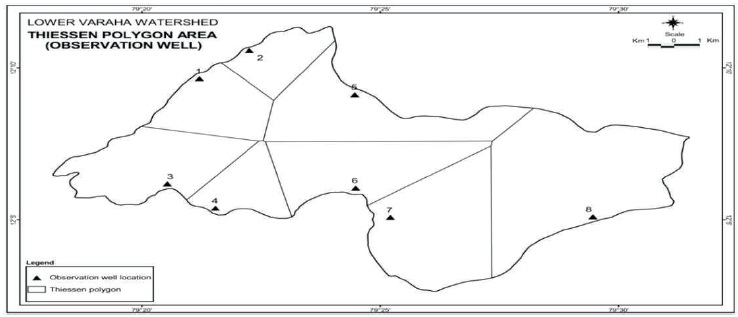
Figure 2. Thiessen Polygon Map of Observation Well in the Study Area
There are two approaches recommended by the GEC norms for groundwater assessment namely,
8.1.1 Water Level Fluctuation Method for Monsoon Season
Groundwater balance equation,
where,
∆S – Change in storage
h – Rise or fall in GW level
Sy – Specific yield
A – Area of well Thiessen polygon
Di – Draft for irrigation
Dinp – Draft for domestic and industrial uses and,
Ri – Recharge from field irrigation
8.1.2 Rainfall Infiltration Factor Method: Non-Monsoon Season
Non-monsoon rainfall > 10% of normal annual rainfall
Normal Rainfall: The minimum average of 30 years of rainfall was considered for normal rainfall calculation. For the study area, only 30 years (1971-2018) of rainfall data was available and hence the mean rainfall over 30 years was taken as normal rainfall. As per the GEC norms, the rainfall infiltration factor for the weathered charnockite area is 0.05 and for the weathered gneiss area, it is 0.11 (Rajagopalan, 1998) as presented in Table 4. The areas, falling under gneiss and charnockite, were calculated and the non-monsoon recharge was computed using the following equation,
Rainfall recharge = f*A*Normal non-monsoon rainfall
where f is the rainfall infiltration factor and A is the area of computation for recharge.
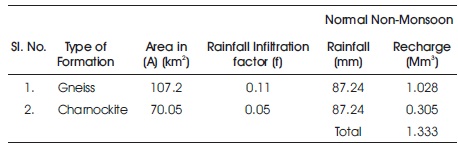
Table 4. Normal Non-Monsoon Rainfall Recharge using Rainfall Infiltration Factor Method
The weightages for each thematic map were assigned based on their importance in priority. In this study area, the geomorphologic features place major role in the occurrence and the movement of groundwater and hence given the highest weightage followed by geomorphology, slope, geology etc are presented in Table 5.
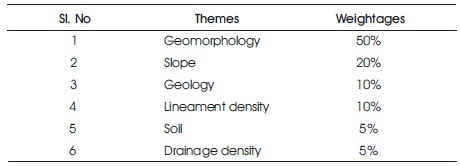
Table 5. Weightages for Thematic Layers
Almost 80% of the study area comprised of HBG and the remaining 20% had Charnokite of Crystalline rocks and Alluvium. The analysis of geomorphological map reveals that almost 70% of the study area is covered by Structural hill. Almost 15% was found with buried pediment and 15% with buried pediment shallow. In the analysis of Geomorphology map, the flood plain places the vital role instead of the buried pediment deep, buried pediment shallow, pediment, erosional surface, HTP, Residual hill, and structural hill categorized in Table 6. In the analysis of Geomorphology map, the flood plain places the vital role than the buried pediment deep, buried pediment shallow, pediment, erosional surface, HTP, Residual hill, and structural hill are shown in Figure 3.
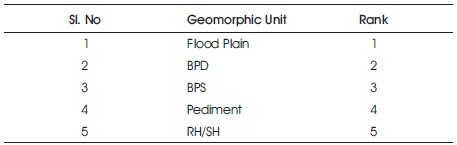
Table 6. Ranks for Geomorphology Map
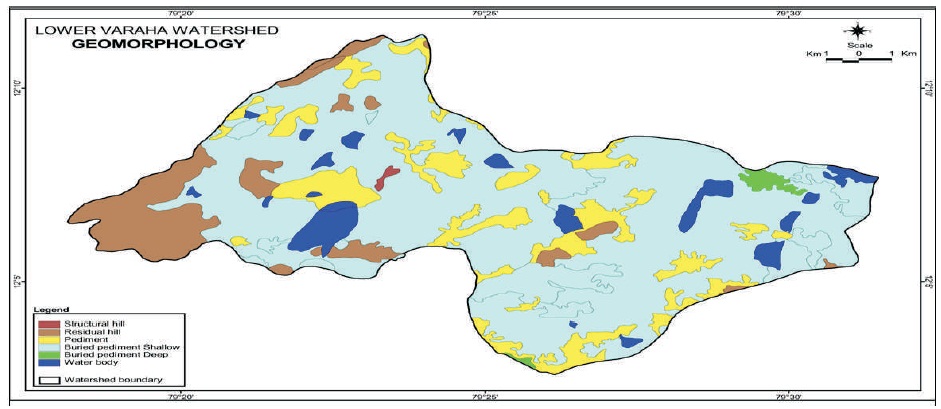
Figure 3. Geomorphology Map of the Study Area
The study area is almost plain with minor undulation and some prominent hill (Structural hill) given in Table 7 and the ranks ranges from 1 to 5.
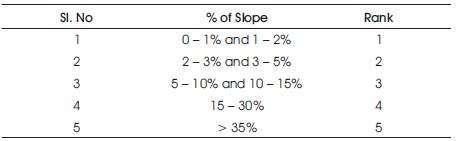
Table 7. Ranks for Slope Map
The analysis of geology map indicated the Archaean formation as consisting dominantly of Charnockite, HBG and Alluvium. For potential groundwater zones, Alluvium is considered the most suitable as the Charnockite. From the geology map, the type of hard rock area is delineated and corresponding percentage of rainfall recharge factor is applied to compute the normal non-monsoon rainfall recharge for the watershed as presented in Table 8 and the rank ranges from 1 - 2.

Table 8. Ranks for Geology Map
For the analysis of structures, the lineament density map was used and analyzed. The lineaments are the major controlling factors in groundwater occurrence and movement in crystalline formation. In this lineament density, more than 1.5 km length per 0.25 Sq.km is taken and ranked as 1 to 5 given in Table 9 (i.e., lineament density range 1 to 6) and Lineament and lineament buffer 250 m of lower varaha watershed as shown in Figure 4.
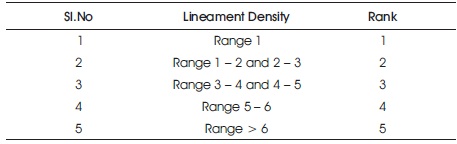
Table 9. Ranks for Lineament Density Map
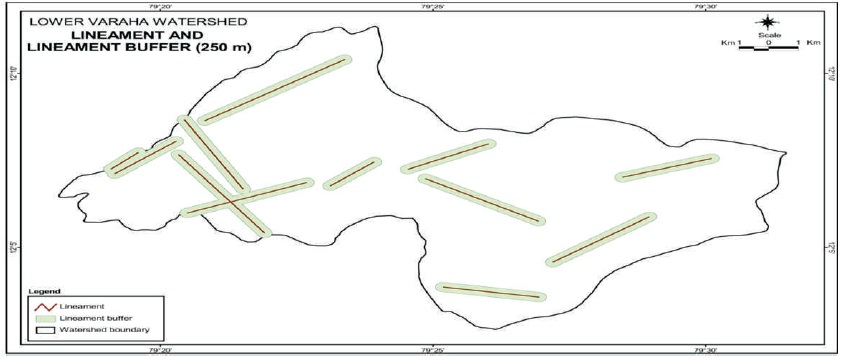
Figure 4. Lineament Map of the Study Area
The soil map was prepared by using the satellite imagery and also using the soil report published by Soil Survey and Land Use Organization, Coimbatore as reference to prepare the soil map of the study area as shown in Figure 5. The hydrological soil group map was also prepared, the majority of the hydrological soil group is B and there is only two other groups, namely A and C. Here, actually the potential groundwater zones fall in the B group presented in Table 10 and also rank ranges from 1 - 3.
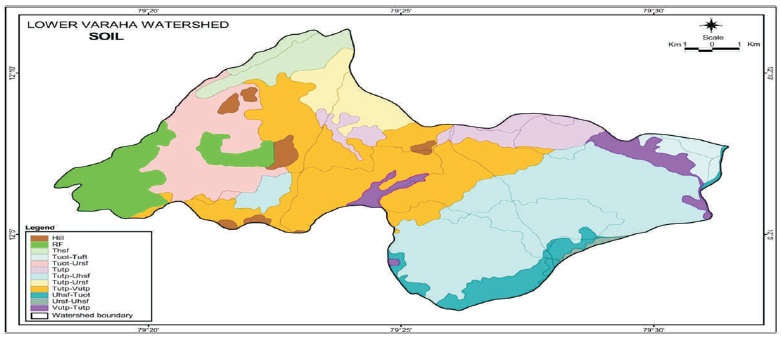
Figure 5. Soil Map of the Study Area
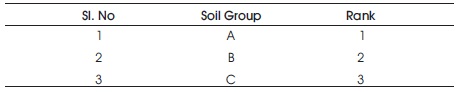
Table 10. Ranks for Hydrological Soil Group
Since the drainage pattern is coarse dendritic and the slope is very less ranging from 1 – 2% and > 35% except, in the structural region, the higher drainage density is taken as the priority rank one because it is a well known fact that drainage in structural hill terrain reflects the fracture/ lineament control. The land use patterns were prepared of the study area by using satellite imageries for the year 1996 from IRS-1C, FCC, LISS-III indicates the study area has ten categories of land uses, viz. Agricultural land, Builtup lands, Crop land, Forest land, Salt affected land, and Waterbodies, etc. deduced as shown in Figure 6.
Figure 6. Land Use/ Land Cover Map of the Study Area
The conclusions have been derived from this study and the remote sensing and GIS provides a powerful tool for demarcate the groundwater potential zones for total rank and weightages ranging from 1 to 16, the integrated map of geomorphology, geology, soil, slope, lineament and land use of the study area are shown in Figure 7.
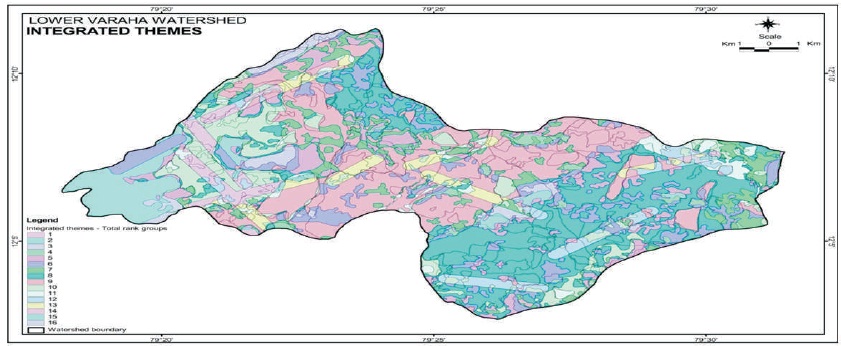
Figure 7. Integrated Themes Map (Weightage Map) of the Study Area
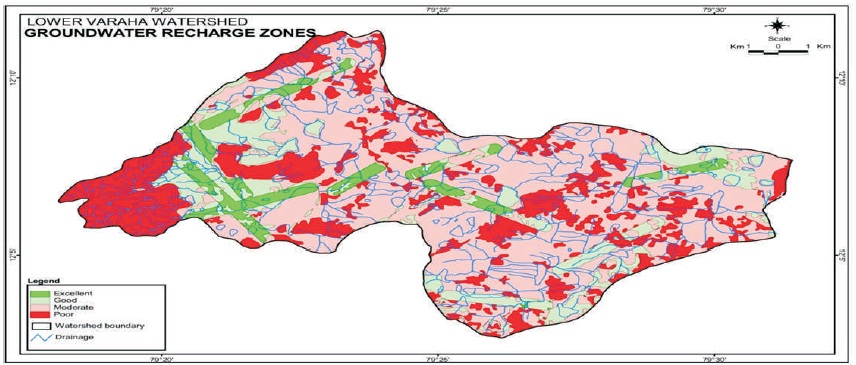
Figure 8. Groundwater Recharge Zonation Map of the Study Area
Recommendations