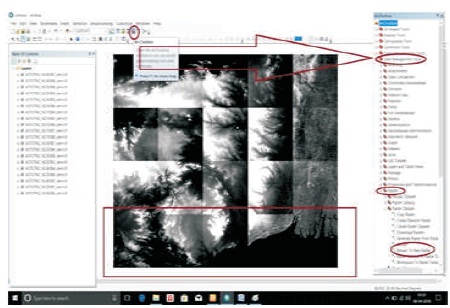
Figure 1. Mosaic DEM
Kangsabati reservoir receives the flow mainly from the river Kangsabati and Kumari, situated in the extreme western part of West Bengal state in eastern India. It is considered as a drought prone area with irregular rainfall. The reservoir is flashy in nature and experiences huge flood with a high peak during heavy storm within a short duration causing the possibility of flood risks. Therefore, it is essential to predict the runoff and flood volumes in the Kangsabati basin. So, there is a requirement to develop the watershed modelling for the said reservoir in HEC-HMS software. The Digital Elevation Model (DEM) based watershed delineation is the primary prerequisite for hydrologic modelling in HEC-HMS. In this study, ASTER DEM of 30 m resolution has been used to delineate the catchment area of a real system Kangsabati reservoir in ArcGIS 10.4. Different intermediate results were generated during the model run and finally catchment area map has been generated and basic parameters were also defined. The watershed area obtained from this delineation process is 3622 2 2 km while it was 3625 km reported in the Department of irrigation, Government of West Bengal. This difference in watershed area is due to errors from the estimation using traditional delineation. The different watershed parameters, such as area, flow path, drainage pattern, river slope, position of rain gauges, etc., generated from delineated watershed shapefile will be used as input in HEC-HMS to develop watershed modelling for investigating the possibility of flood occurrence in the Kangsabati reservoir. It can be useful for further analysis of sedimentation, improved land use practices, watershed management, etc., for the Kangsabati reservoir in future.
A watershed or a drainage basin is an area of land, bounded by a boundary line, where all water drains into a specific stream and it must have an outlet point or pour point. Analysis of remotely sensed data in GIS with computational, hydrological, and geographical aspects can be done with better performance (DeVantier & Feldman, 1993; Sindhu, Ravikumar, & Shivakumar, 2015; Giridhar, & Viswanadh, 2008). Watershed making in ArcGIS is effective for prediction of peak flow to assess the impact of climate change (Nyaupane, Mote, Bhandari, Kalra, & Ahmad, 2018). Watershed delineation is the process to identify the contributing boundary area of a particular river outlet, which is so important for a reservoir in order to know the basic parameter like rainfall runoff relation and drainage features, such as channel networks, surface drainage condition and to quantify subcatchment and channel properties like size, shape, slope, etc., which are required for watershed management in future. Remote sensing data & DEM are useful for estimating streamflow response at the outlet of a watershed (Noto and Loggia, 2007). Terrain analysis and watershed delineation from DEM are the primary steps for HMS modeling (Olivera 2001). There are two methods for delineating catchment, one is traditional method in which topographic map is used for delineating watershed by drawing lines to connect elevation points and contour line, which may be a difficult task to define the watershed precisely and also the map is not easily available and outdated. In this regard, ArcGIS is the best platform to delineate the boundary of a catchment. ArcGIS is an effective mechanism for creating sub-basin and for the drainage management studies (Shea, Grayman, Darden, Males & Sushinsky, 1993). ArcGIS & DEM based technology for evaluating hydrological parameter of a catchment is more precise than other available technique (Singh, Gupta, & Singh, 2014). At the same time, satellite data should require working out the delineation process for which Digital Elevation Model (DEM) of high resolution is needed. Light Detection and Ranging (LiDAR) DEMs are more appropriate than U. S. Geological Survey (USGS) DEMs for watershed boundary delineation due to its better resolution (Charrier & Li, 2012). Estimating watershed characteristics using continuous DEM leads to development of spatial statistics calculation and reproduction over traditional manual processing approaches to improve low flow prediction (Kroll, Luz, Allen, & Vogel, 2004). On the other method, Digital Elevation Model (DEM) and GIS (Geographical Information System) are used as tools for modeling the stream network more accurately. Watershed delineation from satellite data would be more accurate and the results may vary according to spatial resolution of the data (Visharolia, Shrimali, & Prakash, 2017; Daffi & Ahuchaogu, 2017). ArcGIS methodology allows efficient and consistent watershed delineation on DEMS of any size (Abdullah, 2011). Arc Hydro is a valuable tool in ArcGIS for integrating hydrologic applications (Olivera, Dodson, & Djokic, 2003). GIS are proving to be very valuable tool in many natural resource applications (Michael, 2019) and to develop hydrological modelling (Venkatachelam et al., 2001). In this study, a real system Kangsabati reservoir has been chosen for which ASTERDEM of 30 m resolution is used and the catchment is automatically extracted through ArcGIS 10.4. DEM based automated delineation technique is useful to divide too large river basin into sub-basin (Girgin, Akyürek, & Usul, 2005). GIS technique holds good for watershed analysis for better spatial data (Ogden, Garbrecht, DeBarry, & Johnson, 2001; Laura, Mesimer & Bink, 2005).
In the present research study, Kangsabati reservoir system, situated in the Western part of West Bengal, India has been chosen as the study area. It is a single reservoir project in Mukutmanipur of the district of Bankura, West Bengal on the rivers Kangsabati and Kumari (the tributary of river Kangsabati) about 3.2 km upstream of their confluence, is located at 22° 57' 30" N latitude and 86° 45' 30" E longitude.
ASTERDEM (Digital Elevation Model) were downloaded from Bhuvan. It has a spatial resolution of 30 m, which has been used for this study and is shown in Figures 1 and 2. Columns and Rows of this raster dataset are 18001 and 108001, respectively. Spatial extent of this DEM is 25˚0'0.5” at top, 21059'59.5” at bottom, 83059'59.5” at left, and 89000'0.5” at right. Spatial reference of WGS 1984 with a datum of D_WGS_1984 is used.
Figure 1. Mosaic DEM
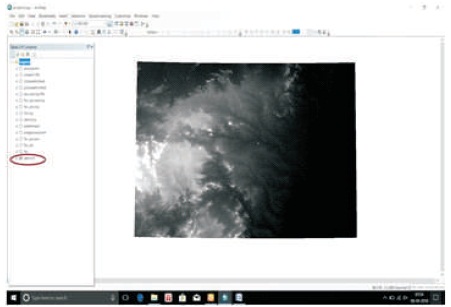
Figure 2. Corrected Mosaic DEM
The flowchart of the watershed delineation is shown in Figure 3.
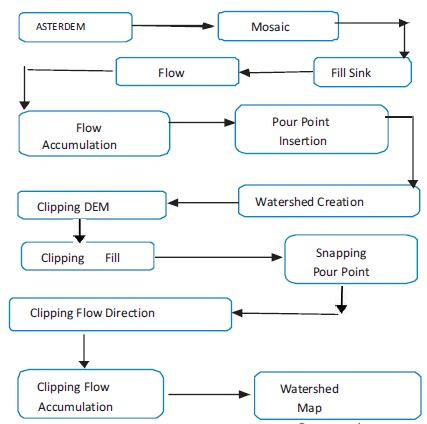
Figure 3. Methodology Flowchart of Watershed Delineation
Several intermediate results are obtained during the whole process of watershed delineation, which are depicted in Figures 4 - 13. Inflow to the Kangsabati reservoir comprises the combined streamflow of Kangsabati and Kumari basins. The Catchment area of the Kangsabati Reservoir is 3625 km2 (I & W, Govt. of WB). Figure 14 shows the upper catchment of the reservoir containing the location of 6 numbers of raingauge stations and 4 numbers of stream gauging stations. In the upper catchment, six raingauge stations (red colour shown in figure) at Mukutmanipur, Khariduar, Simulia, Purihansa, Tusuma, & Fulberia are used to measure the rainfall. Two stations, Khariduar and Purihansa are on the river Kumari, while three raingauge stations, Simulia, Tusuma, and Fulberia are on the river Kangsabati and one raingauge station, Mukutmanipur is on the Dam. Four stream gauges are used to determine the water elevation, two on the river Kangsabati and Kumari each. The shape of the upper catchment is irregular, and it has good forest.
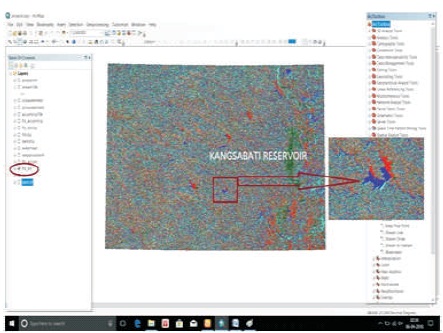
Figure 4. Fill Sink
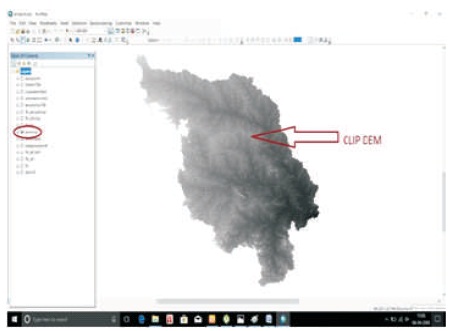
Figure 5. Clip DEM
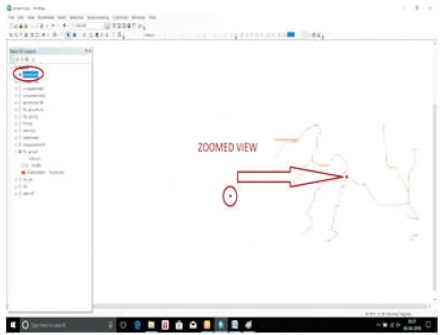
Figure 6. Pour Point Insertion
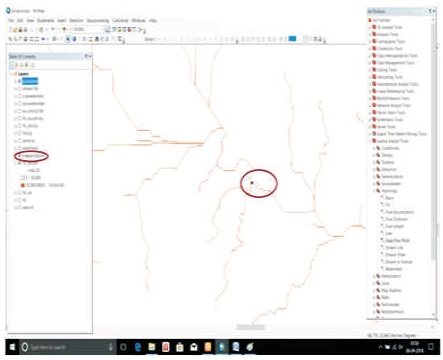
Figure 7. Stream Outlet

Figure 8. Selecting Pourpoint
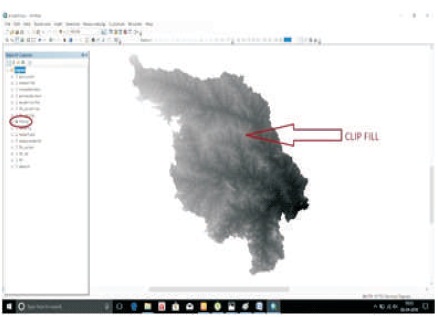
Figure 9. Clip DEM
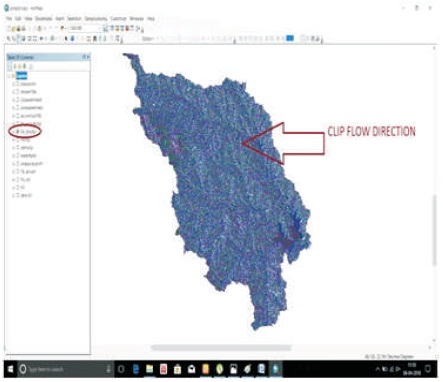
Figure 10. Flow Direction
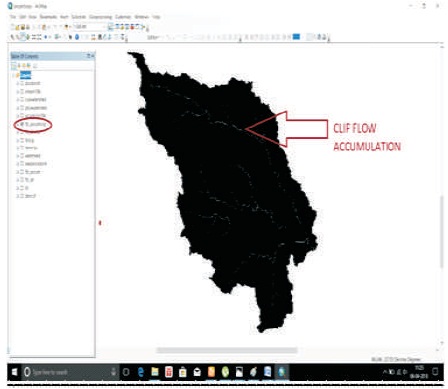
Figure 11. Clip Flow Accumulation
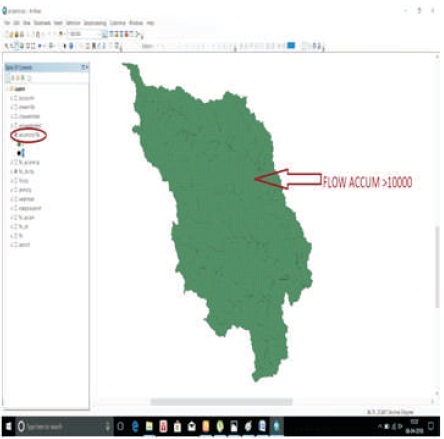
Figure 12. Flow Accumulation
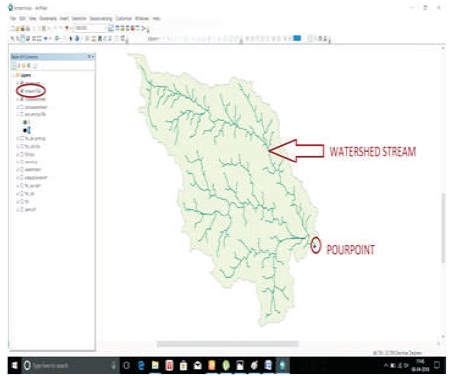
Figure 13. Stream Network
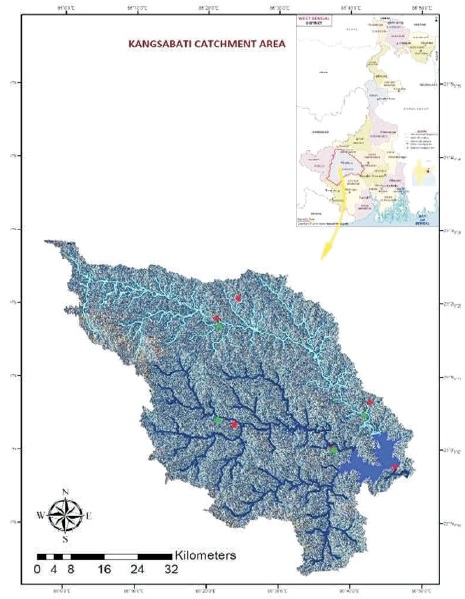
Figure 14. Final Generated Catchment Area Map of Kangsabati Reservoir
Here, the Kangsabati reservoir basin area is generated as 3622 sq km, which is 3 sq km less than the basin area information provided by Irrigation and waterways Department, Govt. of West Bengal. This may occur mainly due to the reasons: i) quality and type of DEM ii) selecting the pour point or outlet point of the basin during the stage of delineation process in ArcGIS iii) It may also vary for different satellite data according to their spatial resolution. Calibrating hydrological model of a delineated watershed, resolution of DEM used play an important role which effects different parameters (Teegavarapu, Viswanathan, & Ormsbee, 2006; Chu, Zhang, Chi, & Yang, 2010).
The capacity of Kangsabati reservoir is reducing year after year due to sedimentation. The live storage and dead storage capacity are reduced by 8.15% and 28.21%, respectively by the year 2006 (CWC, 2015). In this situation, the reservoir experiences high floods, flashy in nature, which may prolong and have high peak value within short duration due to heavy storm and it may damage the downstream area. Therefore, it is necessary to estimate the runoff by establishing rainfall-runoff relation and to predict the flood peak and flood volume generated at the outlet of the Kangsabati basin, which is best achieved by watershed modelling using HEC-HMS software. Hydrological modeling with HEC-HMS is inevitable for accurate and precise estimation of runoff from a watershed. The model requires basic input of watershed characteristics, such as stream network, area of sub-watershed, river slope, drainage pattern, position of rain gauge, etc., for which the prerequisite is the watershed delineation of Kangsabati basin based on DEM.
In the present study, Kangsabati catchment area is delineated effectively in ArcGIS 10.4 with ASTERDEM data. The delineated watershed generates the required different hydrologic features of the basin to develop rainfall-runoff model in HEC- HMS to investigate the possible flooding risks for the Kangsabati reservoir during heavy storm.
This delineated shapefile can be further used for sedimentation analysis, for providing different hydraulic structures and reservoir management of Kangsabati basin in near future. The study also revealed that ArcGIS with DEM based technology is useful to extract watershed of a basin automatically and accurately to determine the different terrain parameters.