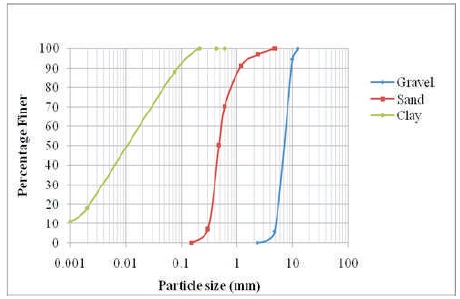
Figure 1. Particle Size Distribution for Clay, Sand, and Gravel
The performance of pavement depends to a large extent on the strength of subgrade. Subgrade should be strong enough to take up the stresses imposed due to loads without shear failure and excessive deformation. Subgrade layer consisting of clay-sand-gravel mixture is advisable for all types of substructure condition. Subgrade soil strength is evaluated in terms of California Bearing Ratio (CBR) and is used in design of flexible pavement. This paper describes the influence of clay content on compaction characteristics, unsoaked CBR values, and undrained shear parameters of clay-sand-gravel mixture. Experiments were conducted on nine different mixtures of clay-sand-gravel under heavy compaction characteristics to measure unsoaked CBR and shear parameters. Clay-sand-gravel mixtures were prepared by mixing clay content to mixture of sand and gravel in varying percentage from 10 to 50% at the increment of 5% by weight. Sand and gravel were mixed in equal proportion by weight. The influence of clay percentage, dry density and moisture content on CBR, cohesion and angle of friction was examined. A functional relationship has been identified to estimate CBR of clay-sand-gravel mixtures. Using multiple linear regression analysis, a relationship is proposed to estimate CBR of clay-sand-gravel mixtures under unsoaked conditions. Based on multiple linear regression analysis, statistical assessment is done to predict the behavior of the variables on CBR. The presented experimental works as well as statistical results are useful in assessing and predicting the performance of subgrade layer in pavement construction.
The performance of pavement depends to a large extent on the strength of subgrade. The subgrade, which is the bottom most layer of a pavement, is often made up of stone aggregates, also known as granular materials. When it is not bounded by any cementing material, it shows strength only under confinement. Subgrade layer consisting of clay-sand-gravel mixture is advisable for all types of substructure condition. The thickness of pavement depends upon the properties of subgrade. It should be strong enough to take up the stresses imposed due to loads without shear failure and excessive deformation. Subgrade soil strength is evaluated in terms of California Bearing Ratio (CBR) and is used in design of flexible pavement. The subgrade of a road pavement, like any foundation, must be capable of supporting the imposed loading without shear failure and excessive loading (Hamidi, Yazdanjou, & Salimi, 2009). Performance of subgrade generally depends on two interrelated characteristics, (1) aggregate inter locking - particle friction (2) cohesion for the stability. Various tests reveal that the grain size has an immediate relationship with cohesion and internal friction. An increased coarse fraction leads to an increase in constant volume shear strength (Li, 2013). With the increase in percentage of gravel content in a particular mix, the shear surface gets rougher as more area is occupied by gravel particles, therefore shear strength of the mixture increases with gravel content (Cho, Dodds, & Santamarina, 2006). On the other hand, with the increase of gravel content, the dilation of sand-gravel mixture increases (Ghosh, 2010). Separation of gravel particles is reduced and particle interlocking is modified by amount of clay fraction. To achieve the higher unit weight, compaction control is the most significant factor affecting the behaviour of soil mass. The load bearing capacity is often affected by degree of compaction, moisture content, and type of soil (Chris & Alex, 1994). The CBR test is essentially a measure of the shear strength of a material at a known density and moisture content. In present study, extensive experiments are carried out to identify the influence of clay content on compaction characteristics, undrained shear parameters, and unsoaked CBR values of clay-sand-gravel mixtures.
CBR value is widely accepted as a performance parameter of a flexible pavement denoting the potential strength of subgrade materials and is dependent on many factors. The CBR of soil is a measure of soil strength and is related to the soil parameters like gradation, mineral type, and compaction parameters, density and shear parameters. Attempts have been made by researchers to develop suitable correlation between CBR and index properties of soil. Black (1962) had developed a chart to estimate CBR value of cohesive soils from plasticity index and liquidity index. Agarwal and Ghanekar (1970) have developed a correlation between CBR, liquid limit, and the Optimum Moisture Content. National Cooperative Highway Research Program (2001) of United States of America discusses relationship between soil index properties and CBR values. Two equations were established, where one was for non-plastic coarse-grained material and the other was for soils which contain some fines and exhibit plasticity.
Debnath and Chaudhuri (2010) studied and analyzed 20 field compacted samples of two different soil types (Clay of low plasticity: CL and Clayey sand: SC) for unsoaked California Bearing Ratio value. The liquid limits for the soil were in the range of 22% to 44% and dry densities of field compacted soils varied from 15 to 21 kN/m3. These parameters were taken separately and analyzed for individual correlation (power and linear). CBR values of unsoaked samples had a good correlation with undrained shear strength. CL type of soil had a better correlation than SC type of soil.
Li (2013) had analyzed the influence of different factors on the CBR value of silt road bed. The CBR value was measured by varying silt particle content, initial water content, salt content, and over load pressure. The specimens were prepared by heavy compaction and soaked in water for four days. The test results show that the CBR value of silt filling became larger as the silt particle content reduced. The initial moisture content has a remarkable influence on CBR values and the CBR value reaches the maximum with Optimum Moisture Content. He also concluded that the CBR value reduced to a great extent as the salt content increases. CBR value of silt became larger as the over load pressure improved because water cannot easily enter the voids of soil that is already soaked in water. Hence, the water film between the particles becomes thinner and CBR value increases.
Hamidi et al. (2009) investigated the shear strength of sandy soils containing different gravel contents. The tests were conducted using a large scale box shear apparatus with a 300 mm x 300 mm x 170 mm shear box. All tests were performed on dry samples in drained condition. The gravel contents of 20, 40, and 60 percent were used in sample preparation with three different densities of 30, 60, and 85 percent and three different surcharges of 150, 300, and 450 kN/m2. Uniform clean quartz sand and gravel grains with a maximum size of 25 mm were used to prepare sand-gravel mixture. It is observed that maximum dry density increases with the gravel content up to 60 percent. The study indicates that dilation increases with increase in shear displacement. The increase in dilation also contributes to the increase in shear strength with increase of gravel content.
Above review indicates that although fine grained soil is given due attention in the computation of CBR, clay- sand-gravel mixture has not been comprehensively attended. However, subgrades are often built of clay- sand-gravel mixtures during road pavement construction. Also no systematic study has been carried out to identify the influence of cohesion on CBR value of soil mixtures consisting of clay-sand-gravel. It is also noticed that no definite relationship exists, which relates behavior of clay-sand- gravel mixture in estimating CBR of subgrade. The present investigation is taken up to fulfill the above mentioned gap.
In the present investigation, clay was collected by excavating at a depth of 450 to 600 mm from natural ground level from Bhal region in Gujarat, India. The properties of the clay were determined as per Indian Standard (IS 2720 Part 3, 4, 5, 8, 11, and 16). Mean particle size of clay was 0.012 mm (Figure 1). The engineering properties of clay material were: Specific Gravity = 2.71, Liquid Limit (LL) = 54%, Plastic Limit (PL) = 27%, and Plasticity Index (PI) = 27%, Optimum Moisture Content (OMC) = 18%, Maximum Dry Density = 17.1 kN/m3, cohesion at OMC = 142 kN/m2, angle of friction at OMC = 12o. The free swell index was 44%. Based on the liquid limit and plasticity index, soil was classified as CH type. Clay was identified as kaolinite using XRD test.
Sand and gravel used in the present investigation were collected from Sabarmati river basin. Gravel finer than 10 mm and retained on 4.75 mm sieve was used. The mean size of gravel was 7.1 mm (Figure 1). It is a fine gravel with a sub angular type shape. The co-efficient of uniformity is 0.94 and coefficient of curvature is 1.52 for fine gravel. The sand finer than 2.36 mm and retained on 600μ sieve is used. The co-efficient of uniformity is 0.96 and coefficient of curvature is 1.62 for sand. The mean size of sand was 0.47 mm (Figure 1). The main purpose of using uniform size is that as the material grading changes from a well graded to uniformly graded, the influence of shape is reduced. For both the materials, value of Cc is less than 2, which indicate that it is a uniformly graded material. Sand and gravels are designated as SP and GP, where SP indicates poorly graded sand with little or no fines and GP indicates poorly graded gravel with no fines.
Figure 1. Particle Size Distribution for Clay, Sand, and Gravel
Clay obtained from the field was dried in the sunlight and grinded to convert into powder form. This powder clay was used in the preparation of cohesive soil mixture. Clay in various proportions by weight was mixed with sand and gravel and blended to form a homogeneous mix. Nine different mixtures were prepared by varying clay content from 10% to 50 % at the increment of 5%. Sand and gravel were mixed in equal proportion by weight.
2.2.1 Measurements of Dry Density and Optimum Moisture Content
Maximum dry density and Optimum Moisture Content of clay-sand-gravel mixtures were evaluated as per the procedure of modified Proctor test using guidelines of IS: 2720 (Part-8). The variation in optimum moisture content and maximum dry density with varying proportion of clay percentage was recorded and shown in Figure 2. It can be revealed from the figure that maximum dry density decreases with the increase in clay percentage. However, dry density decreases with the increase in water content. In a dry soil, better compaction is achieved by first adding water to raise its moisture content to near optimum. This water softens clay bonds, provides lubrication, and reduces surface tension forces within the soil. However, optimum water content increases with the increase in clay content in the clay-sand-gravel mixtures.
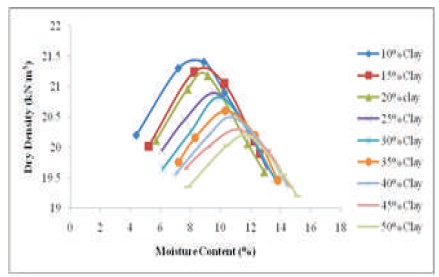
Figure 2. Variation in Dry Density and Optimum Moisture Content of Clay-Sand-Gravel Mixtures
2.2.2 Measurements of California Bearing Ratio
California Bearing Ratio test for clay-and-gravel mixtures were conducted as per the IS: 2720 (Part-16). CBR test is conducted under unsoaked condition and CBR values are evaluated to understand the effect of clay on clay-sand-gravel mixtures. Generally, the CBR value at 2.5 mm penetration is greater than that at 5 mm penetration. The CBR results with variation in clay percent are shown in Figure 3. The value of CBR decreases with the increase of clay content in the mixture. It is clear from the figure that CBR is maximum for the tests conducted at OMC and its value reduces as moisture content is varied from OMC. It is also evident from the figure that larger is the moisture content in the mixture, smaller is the CBR value.
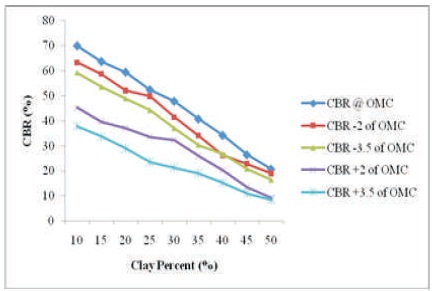
Figure 3. Variation in CBR with Clay Percent
2.2.3 Measurement of Undrained Shear Parameters
To determine the undrained shear parameters, unconsolidated undrained triaxial tests were performed as per the IS: 2720 (Part-11). The samples, 50 mm in diameter and 100 mm in height for nine different mixtures were prepared to fit in triaxial test cell (Figure 4). The specimens were prepared using a steel split compaction mould. The specimens were prepared under five moisture contents: (1) at optimum moisture content, (2) below 2 and 3.5 of OMC, and (3) above 2 and 3.5 of OMC. A handheld compactor was used for compacting the specimen. The mixed soil was placed in mold in three lift. A vacuum line was attached to the mold to hold the membrane tight against the mold. After compaction, the vacuum was removed from the sample, thereby causing a confinement by membrane. The unconsolidated undrained drained tests were conducted with a strain rate of 1.2 mm/min. The samples were given confining pressure of 0.5 kg/cm2, 1.0 kg/cm2, and 1.5 kg/cm2. The samples were subjected to all round stress and additional vertical stress till failure (Figure 5). The tests were repeated with identical samples using different values of confining pressure. During the shearing process, the soil samples experience axial strain, the area of sample increases as the length decreases. The calculation of deviator stress is done on the basis of corrected area.
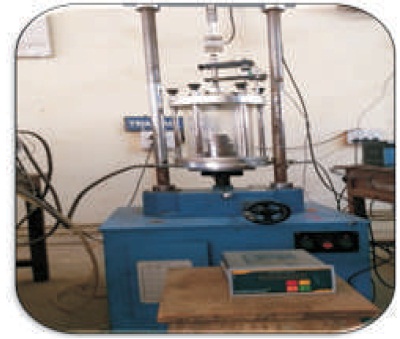
Figure 4. Triaxial Test Setup Before Testing
The influence of clay percentage and moisture content on California Bearing Ratio under unsoaked conditions were narrated in Figure 6. Experiments were conducted under five moisture conditions of sample one at Optimum Moisture Content (OMC), two moisture conditions on wet side of OMC at 2% and 3.5%, and two moisture conditions on dry side of OMC at 2% and 3.5%. From these figures, it is evident that California Bearing Ratio decreases as water in the sample reached to wet side of OMC. Experiments conducted with dry side of OMC showed larger value of California Bearing Ratio. Therefore, it is advised to compact subgrades in road pavement construction on dry side of OMC to achieve maximum strength (Arora, 2011). However, experiments conducted on OMC showed the larger range of California Bearing Ratio. The similar results are also observed by Liu, Zhang, and Di (2009) in the investigation of CBR in the case of silt road bed.
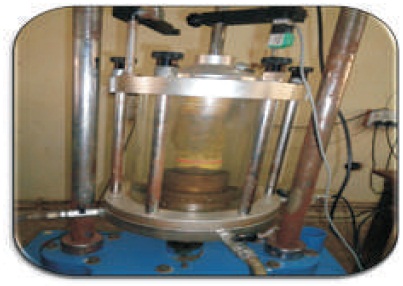
Figure 5. Sample during Triaxial Testing
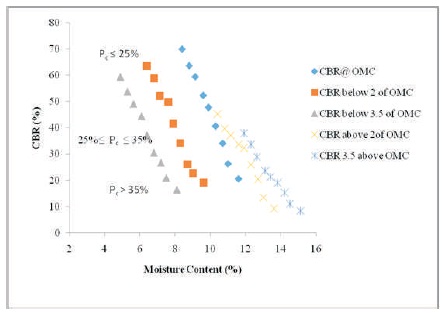
Figure 6. Variation of Unsoaked CBR with Moisture Content at Different Clay Percentage
The proportion of clay influences strength formation to a large extent. CBR also decreases with an increase in clay percentage in clay-sand-gravel mixtures. Saride, Avirneni, Javvadi, Puppala, and Hoyos (2015) have stated that the dry and saturated CBR decreases with decreasing percentage of angular sand and gravel, and increasing the percentage of fines. It is also confirmed in this study that the CBR value of soil sample containing higher percentage of fine particles reduces drastically, but the reduction is not linear. CBR value decreases with an increase in clay fraction in unsoaked conditions. The reduction is significant at 20% to 30% in clay percentage.
The influence of dry density on California Bearing Ratio under unsoaked condition is shown in Figure 7. The experiments, were conducted under five values of dry density, viz; at Maximum Dry Density (MDD), at dry density corresponding to 2% and 3.5% below OMC, and at dry density corresponding 2% and 3.5% above OMC. From these figures, it is evident that California Bearing Ratio increases as dry density increases in general. On the dry side of OMC, higher CBR values are obtained than on the wet side of OMC. However, maximum value of CBR is obtained in the experiments conducted at MDD. It is also evident from the figure that dry density decreases with the increase in clay percentage in clay-sand-gravel mixture and hence CBR too decreases with the increase in clay percentage.
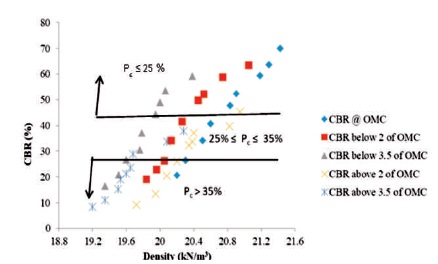
Figure 7. Variation of Unsoaked CBR with Dry Density at Different Clay Percentages
The parallel lines shown in Figures 6 and 7 are drawn by eye judgment and they merely illustrate that data can be partitioned on the basis of clay percentages. However, a few data may encroach into neighboring zone, where clay percentage is higher. In Figures 6 and 7, Pc is clay percentage.
Due to combined effect of clay content and moisture content, cohesion is found to increase at OMC and on dry side of OMC. But on the wet side of OMC, after a certain limit, cohesion decreases as shown in Figure 8. This is due to the fact that clay properties are mobilized due to physio-chemical interaction between clay particles and moisture. The angle of friction is found to decrease with increase in clay fraction as shown in Figure 9. With the increase in clay particles CBR value decreases, but reduction is not linear. CBR values are more sensitive at 20% to 30% of clay content and on wet side of OMC (Figure 10). This is because a hydrate film is formed on wet side, which plays a role of lubricant and friction between particles decreases eventually.
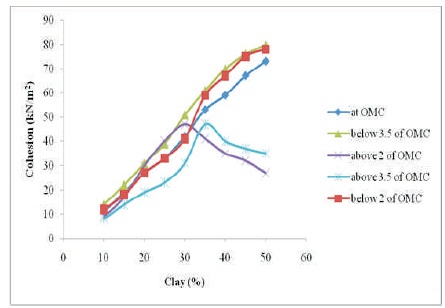
Figure 8. Variation in Cohesion with Clay Percent
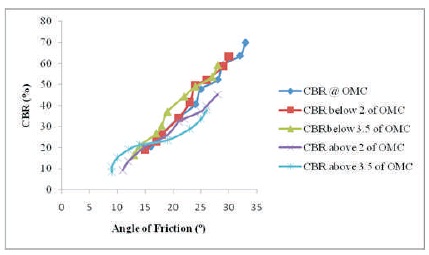
Figure 9. Variation in CBR with Angle of Friction
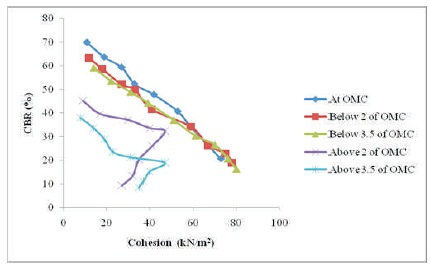
Figure 10. Variation in CBR with Cohesion
The behavior of soil at different percentage of clay in clay-sand- gravel mixtures during tri-axial shear testing is described herein. Photographs 1 to 2 show clay-sand-gravel sand-gravel soil mixture samples (containing various percentage of clay) at the end of measurement of shear parameters in tri-axial apparatus. At the lower percentage of clay (20%) in the sample, failure is observed by particle dislodging. With the increase in clay content in the soil sample failure took place with the development of a feeble crack at the inter-transition zone. With further increase in clay percentage in soil sample (40%), bonding between clay and gravel enhances and improvement in clay-sand-gravel soil matrix takes place. However, strong cracks are observed at the top and bottom of sample at the failure (Figure 11). With the maximum clay content present in the soil mixture (50%), strong crack has not been seen in the sample and failure took place by bulging along with minor cracks (Figure 12). At the maximum percentage of clay, the sample becomes monolithic and there are less chances of generation crack or failure plane. Bulging is observed at the top after the application of load, which may be due to the less amount of gravel percentage present in mix. As explained by Liu et al. (2009), when clay percentage is more than 40% in soil sample, it controls the mechanical behavior of mixture.
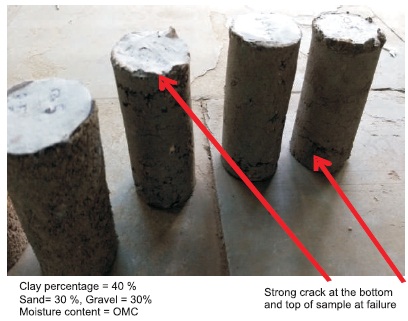
Figure 11. Clay-Sand-Gravel Sample after Measurement of Shear Parameters
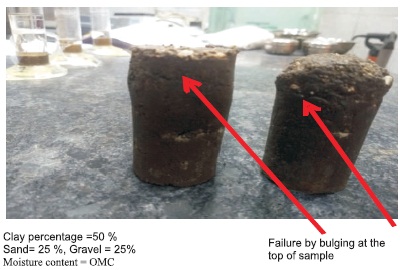
Figure 12. Clay-Sand-Gravel Sample after Measurement of Shear Parameters
From the analysis, it is found that California Bearing Ratio of clay-sand-gravel mixture depends on a number of governing parameters, viz; amount of clay, dry density, moisture content, plasticity index, unit weight of water, specific gravity of soil mixture, and shear strength parameters. Therefore, the following functional relationship can be written to compute CBR in case of clay-sand-gravel mixtures.
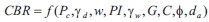
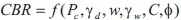
where Pc is clay percentage, γd is dry density and γw is unit weight of water, PI is plasticity index of soil mixture, w is moisture content, and G is specific gravity, C is the cohesion and φ is the angle of friction and da is the arithmetic mean size of clay-sand-gravel mixture. Due to presence of gravel in soil mixtures used in present study, it was difficult to calculate plasticity index (Kothyari & Jain, 2008). Therefore, plasticity index has been eliminated from further analysis. Also analysis of results show that variation in specific gravity is minimal for all mixtures, therefore it is dropped from the further analysis. New functional relationship for CBR is written as,
Using dimensional analysis, the variables of equation (2) can easily be arranged into the following non-dimensional form (Peerless, 1967):
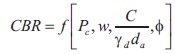
The functional relationship in the form of equation (3) can be used to develop an expression for the computation of California Bearing Ratio in cohesive mixtures consisting of clay-sand-gravel. Transforming all data into logarithm and using multiple linear regression with all pertinent parameters, the following relationship is proposed to compute CBR of clay-sand-gravel mixtures under unsoaked conditions.
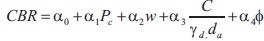
where α0, α1, α2, α3, and α4 are multiple regressions co-efficient and their values are mentioned in Table 1. The calculated value of multiple co-efficient of determination (R2), multiple co-efficient of determination (R2 adj), and standard error (Es) of the model are R2 = 0.95, R2 adj = 0.94, and Es = 0.051, respectively.
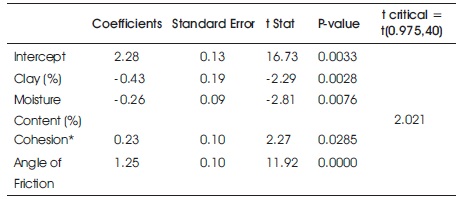
Table 1. Value of t statistics for Different Parameters of Model (equation 4)
The significance of the model has been studied through following statistical tests (Ghosh, 2009, 2010).
4.1.1 F Test
Significance of the multiple regression co-efficient as a whole of the model presented in equation (4) is checked using F test. From the table of the F distribution with α = 0.05, df1=4, df2 =40, F (0.95, 4, 40) = 2.84. Therefore, Fcal = 205.24 is greater than the tabulated Fcritical = 2.34. Therefore, all the variables of regression model (equation 4) have a strong correlation with CBR.
4.1.2 t Test
The multiple regression coefficients of equation (4) have been studied through the t statistics. Table 1 presents the summary of t statistics of the coefficients, t values of the parameters dry density, cohesion, and angle of friction in Table 1 are higher than t critical value (a = 0.975, 40)= 2.021, which rejects null hypothesis. There is a strong evidence that the explanatory independent variable of regression model of equation (3) helps to explain the variation in CBR.
P values in the Table 1 for each variable is well below the significance level α =0.05. This indicates that there is a strong correlation between each independent and dependent variable. The model proposed is statistically significant.
In order to check the adequacy of the proposed relationship, the observed values of California Bearing Ratio are plotted against their values computed by the proposed relationship (equation 4) as shown in Figure 13. It can be seen from this figure that the proposed relationship predicts the CBR of clay-sand-gravel mixtures with a maximum error of ±10% for unsoaked conditions.
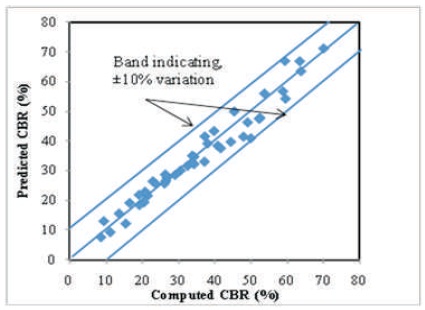
Figure 13. Predicted versus Computed Unsoaked CBR in Clay-Sand-Gravel Mixtures
The present paper examines the behavior of clay-sand-gravel mixtures in CBR and triaxial test. Several laboratory experiments, were conducted to study the variation of California Bearing Ratio (CBR) and shear parameters of cohesive mixtures consisting of clay-sand-gravel. Nine different clay-sand-gravel mixtures were prepared by varying clay content from 10% to 50 % (by weight) at the increment of 5%. Sand and gravel were mixed in equal proportion by weight. These samples were tested in a CBR mould and unconsolidated undrained triaxial test to explore the effect of varying proportion of clay fraction. Experiments revealed that with the increase in clay percentage, the Optimum Moisture Content increases, but reduction in maximum dry density is moderate. The influence of clay percentage, particle size, dry density, and moisture content on CBR was examined. Visual inspection of CBR plots reveals that CBR value decreases with the increase in moisture content in the mixtures and increases with an increase in dry density of mixture under unsoaked conditions. The CBR of granular system is affected by fine particles’ shape, size, and texture. CBR value decreases with an increase in clay fraction in unsoaked conditions. On the dry side of OMC, mixtures have flocculated structure and on wet side of OMC, mixtures have dispersed structure. This difference has a strong influence on CBR. Therefore, CBR values are higher on dry side of OMC than on wet side of OMC. Because of physico-chemical properties, clay has serious impact on cohesion and friction. The reduction in CBR is significant at smaller increment in clay percentage.
A functional equation has been proposed to estimate CBR of clay-sand-gravel mixtures. Using multiple linear regression analysis, a relationship is identified to estimate CBR of clay-sand-gravel mixtures under unsoaked conditions. The statistical analysis is carried out to predict the behavior of the variables on CBR. P-values and coefficient in regression analysis indicates that the model is statistically significant. The presented experimental works as well as statistical results are useful in assessing and predicting the performance of sugared layer in pavement construction.