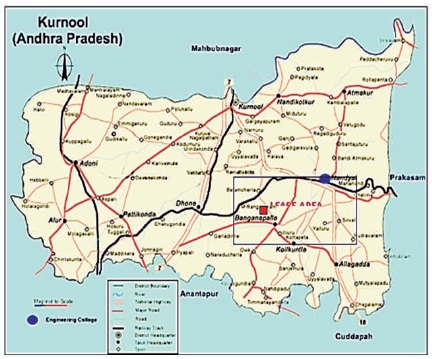
Figure 1. General Location and Accessibility Map of the Lease Area
The dynamic behavior of canal slope under blast load was assessed using numerical modelling approach based on ground vibration samples. Studies were carried out at Yanakandla Mine, Kurnool District of Andhra Pradesh over a period of two months and Blast vibrations were monitored at different distances. Based on the signal processing analysis made, regression based statistical analysis was carried out. In addition, curve fitting analysis made between Peak Particle Velocity of ground vibrations and Scaled Distance resulted in a very good coefficient of determination of about 92% between them. A Distinct Element Modelling technique in 3DEC software was carried out for finding the slope stability analysis of the canal located near the mine by adopting a simplified triangular blasting load. Vertical joint was included in the model and analysis was carried out to determine the influence of joint in the rock mass. It was observed that the Peak Particle Velocity values obtained from numerical modelling are in close approximation to the field investigation results.
Slope stability analysis is becoming a major concern, as open cast mining contribute maximum to the total production in the mining industry. Hence, it is very crucial to evaluate the various potential failure mechanisms occurring in the slope and to take economically feasible steps to reduce, remove, and mitigate the risk associated with slope stability.
A mathematical model was also described to optimise the blast design for a specified damage zone in the rock mass. Seismic cross hole measurements were performed before and after the blast to monitor how the amplitudes and the transmission times changed after the blast and the results achieved from these holes showed that both the P-wave velocity and the maximum amplitude were reduced after the blast (Garimella, Chandra, & Parvathy, 2019; Sastry & Chandra, 2016a, 2016b).
Finally, the statistical curve fitting model was established by considering significant coefficients from statistical analysis. Values predicted by a model are verified by field investigation results to obtain satisfactory results. The developed models may be used for drawing graphs and analyzing results for forecasting purposes.
In order to tackle the problems related to stability, numerical modelling software are needed. Yang et al. (2012) have conducted a study of the dynamic behaviour of road high cutting rock slope under the influence of blasting for excavation. Numerical simulation by FLAC-3D (Fast Lagrangian Analysis of Continua in 3 Dimensions), a numerical modelling software was employed and the result showed that the particle vibration velocity simulated was consistent with that by field test (Chen, Cai, Zhao, & Zhou, 2000; Cheng et al., 2006; Deng, Zhu, Chen, & Zhao, 2012; Hassan & Damper, 2012; Israelsson, 1996; Lemos, 2004; Wang, Li, Zuo, Zhou, & Zhang, 2006; Zhang, Jing, Zhang, & Fan, 2008). Singh and Roy (2010) carried out a study on the effect of blast vibration on damage of surface structures and their study was focused on the determination of safe levels of ground vibration for residential structures and other buildings in the mining area. In an article by Xu and Yan (2006), a numerical simulation for the influence of excavation and blasting vibration on the stability of mined out area, dynamic analysis steps, and general flow of fast Lagrangian analysis of continua in FLAC 3D were discussed. Griffiths and Fenton (2004) had carried out a study on the topic of slope stability analysis by Finite Elements (FE) and described several examples of finite element stability analysis with comparison against other stability analysis methods. From the study, it was found that the FE method in conjunction with an elastic-perfectly plastic stress-strain method has been shown to be a reliable and robust method for assessing the factor of safety of slopes. Therefore, this method can be effectively used as an alternative to traditional limit equilibrium methods. Singh (2002) conducted a study on blast vibration damage to underground coal mines from adjacent open-pit blasting and investigated seven coal mines in India. Monitoring of strata behaviour was carried out before and after the blasts by installing the strata monitoring instruments in the roof and pillar and the threshold value of vibration for the safety of underground workings is recommended based on the Rock Mass Ratio (RMR) of the roof rock. Zeng and Xiao (2017) carried out a study on the topic of 'FLAC3D based Improvement for Strength Reduction Method's Slope Stability'. Further, they discussed the method for separate reduction of shear strength parameters such as friction angle and cohesion after obtaining the potential slide surface through the high value zone of horizontal displacement, and thus realized the dual safety coefficient method for slope stability evaluation. Cen and Jiang (2008) had carried out a study on blasting vibration control of creep mass high slope, that focuses particularly on hydropower station and control strategies over several damages due to blast vibration. Based on decay experience formula and damage standards due to blasting, the safety-controlled parameters of cast in situ concrete of the creep mass high slope were derived. Sastry, Rebello, and Shivashankar (2015) conducted a study on the topic of blast-induced response of a tunnel in the presence of a two-storied structure. In this study, they have taken three velocity-time histories of different PPV (Peak Particle Velocity) and applied at three different boundaries of the model. In addition, they studied the effect of varying input PPV's and their frequencies on the stability of building and tunnel. Results of the study indicated that peak velocity response occurs in the beams of the top floor and greater displacement occurred at the top of the building and also concluded that irrespective of location of application of input waves, maximum concentration of stress occurred at the tunnel sides. Kahriman (2004) conducted a study on the analysis of ground vibration parameters produced from bench blasting at a limestone quarry, to predict peak particle velocity level at a limestone quarry located in Istanbul, Turkey. Further, an empirical relationship with good correlation was established between peak particle velocity and scale distance for this site. Holmberg and Maki (1981) had done a study on case examples of blasting damage and its influence on slope stability. They introduced simulated blast damage into samples before testing the shear strength to show the blasting damage influence on the slope stability.
General location and accessibility map of the lease area are shown in Figure 1.
Figure 1. General Location and Accessibility Map of the Lease Area
Blast vibration studies were carried out in Yanakandla Mine at Yanakandla Village in Banaganapalli Mandal, Kurnool District of Andhra Pradesh. The problem of concern in the present case was the ground vibration of nearby Canal. The excavated irrigation Galeru Nagari Sujala Sravanthi (GNSS) canal is traversed along deposit periphery towards the north-west side of mine. It is proposed by the mine management to advance the benches to 50 m towards the canal side, simultaneously maintaining the safety of the canal. Statistics of Yanakandla limestone mine as on 31.03.2015 is shown in Figure 2. Figure 3 shows the GNSS canal located near the mine lease area.
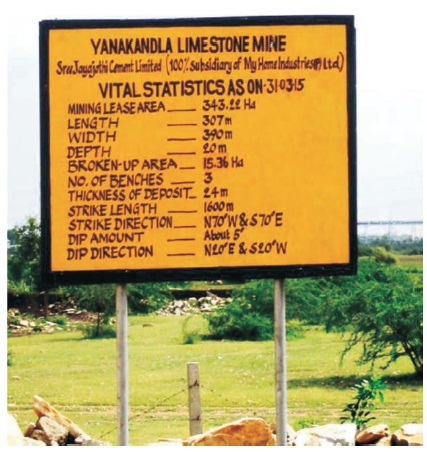
Figure 2. Statistics of Yanakandla Limestone Mine as on 31.03.2015
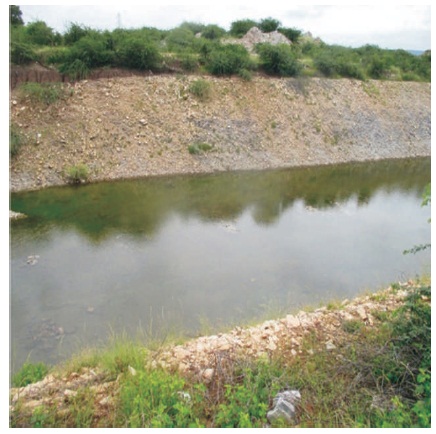
Figure 3. GNSS Canal Located Near the Mine Lease Area
To assess the impact of blasting operations, eight production scale blasts conducted at different locations in Yanakandla Limestone Mine were studied. Blastholes of 115 mm diameter were drilled using wagon drills. Depth of blastholes varied from 6 to 7 m in different blast rounds. Each blasthole was charged with ANFO mixed with husk as column charge. Slurry explosive was used as Primer charge, with cartridges of 2.78 kg each, making the explosive charge per hole to 14.35 to 39.06 kg. Exel Dueldet shock tube system of initiation was used, simultaneously providing the in-hole initiation and surface delay. The pattern of explosive column and stemming in blasthole was changed from blast to blast. Figure 4 shows the general view of the mine.
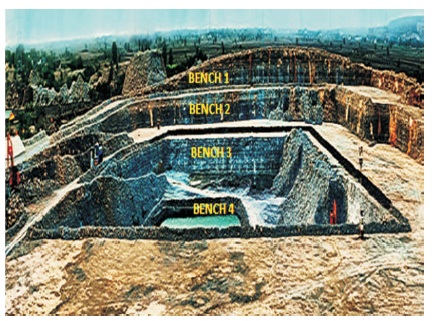
Figure 4. Locations of Blast Rounds Studied
Locations of different blasts studied in the Yanakandla limestone mine are shown in Figure 5. Layouts of all the blasts studied are given in the figure. All the eight production blast vibrations were recorded using minimates. B-1, 2, 3, 4, 5, 6, 7, 8 indicates respective blast locations.
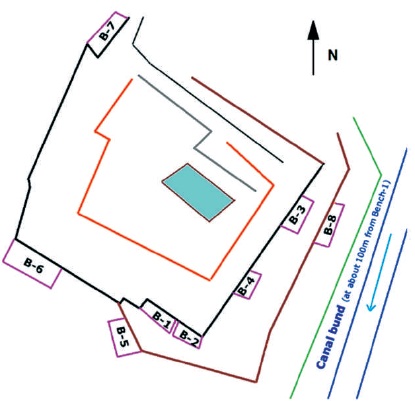
Figure 5. General View of the Mine
Blast vibrations are monitored using the instrument Instantel Minimate Plus. The vibrations were captured by means of geophones kept at different distances, i.e. 30, 40, 50, 60, 70, 80, 90, and 100 m. Ground vibrations captured by the sensors in geophones were downloaded into a computer using external accessories and these data were analysed using Blastware software. Hence the peak particle velocity, frequency, and acceleration of each vibration was obtained from the software along with the FFT report of each event. Monitoring of ground vibration using geophone is as shown in Figure 6.
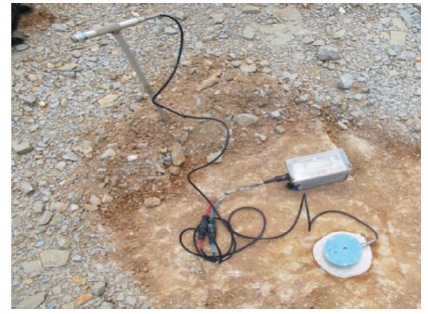
Figure 6. Monitoring of Ground Vibration
The intensity of ground vibrations recorded at different distances was obtained from Blastware software. Based on this data, a regression curve was plotted with peak particle velocity v/s scaled distance as shown in Figure 7. From the data generated, the ground vibration propagation equation for Yanakandla limestone mining project site has been established as,

where,
SD = D/ÖW
V = Peak particle velocity (mm/s)
D = Distance between blast site and location of instrument / structure (m)
W = Maximum explosive charge / Delay (kg)
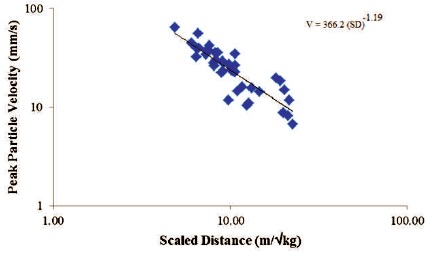
Figure 7. Peak Particle Velocity vs. Scaled Distance
Using the established ground vibrations propagation equation, the expected Peak Particle Velocity values are estimated for different distances, with different explosive charges/delay. The values are tabulated and shown in Table 1.
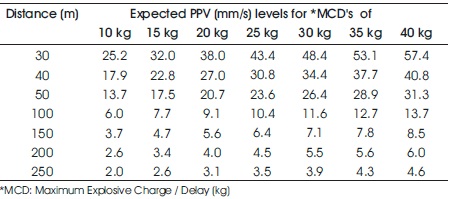
Table 1. Expected PPV Levels at Different Distances for Different Maximum Charge/Delay
With 25 kg of MCD, the PPVs expected are about 43 mm/s at 30 m distance, 31 mm/s at 40 m distance and 24 mm/s at 50 m distance. With 35 kg of charge / delay, a PPV of about 53.05 mm/s is expected at 30 m distance, 37.67 mm/s at 40 m distance, 28.88 mm/s at 50 m distance, and 12.66 mm/s at 100 m distance. Similarly, PPVs expected from a MCD of 30 kg are 48.4 mm/s at 30 m, 34.37 mm/s at 40 m, 26.35 mm/s at 50 m, 11.55 mm/s at 100 m distance, etc.
The physical, mechanical parameters of rock mass required for numerical modelling were obtained through laboratory tests. The rock properties of the considered strata are listed in Table 2.
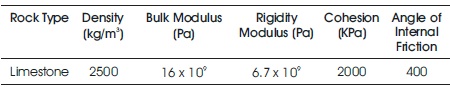
Table 2. Rock Properties of the considered Strata
In order to study the process and mechanism of dynamic instability of the slope under blast vibration load, threedimensional numerical simulations were carried out. Simulation study of canal slope stability was carried out using Three Dimensional Distinct Code (3DEC-Version 3.1) developed by Itasca Consulting Group Inc. In order to set up a model to run a simulation with 3DEC, the fundamental components of a problem to be specified include a distinct element model that matches the problem geometry, constitutive behaviour and material properties, boundary and initial conditions, static and subsequent dynamic analysis. For analysis, blast load is applied and peak particle velocity was simulated at a distance of 30, 40, 50, 60 m by numerical modelling. PPV, displacement, and stress was analysed in each case. In addition, analysis was done considering a vertical joint extending to 5 m and 10 m below the canal bottom at a distance 30 m away from the canal edge. A 3DEC model of canal slope after excavation is shown in Figure 8.

Figure 8. 3DEC Model of Canal Slope after Excavation
Vibration velocity was chosen as the physical parameter for field test using blast vibration transducers. Figure 9 shows the velocity series of blast vibration recorded from the blast site under consideration with the dominant frequency of 21.5 Hz, Blasting time of 1s, and the maximum amplitude of 0.508 mm/s. The velocity time history of the wave used as blasting vibration input is shown in Figure 9.
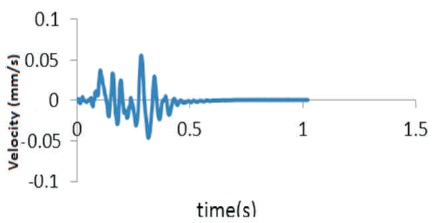
Figure 9. Velocity Time History of Wave
In order to find out the law of redistribution of secondary state of stress and variance of velocity and displacement under blast vibration, the whole analysis is divided into two steps, which are static and dynamic analysis. In 3DEC, acceleration, velocity, displacement, and stress are the dynamic mode of input for the dynamic computation and analysis. For viscid boundary condition, dynamic loads input must be velocity.
The distribution of maximum principle stress due to dynamic loads are shown in Figure 10. The displacement contours and velocity contours of the model under blast loads are shown in Figures 11 and 12, respectively. For further analysis, some points say A, B, C, D, E, F, G, H are considered along the canal slope and also below the bottom of the canal as shown in Figure 13.

Figure 10. Distribution of Stress under Dynamic Loading
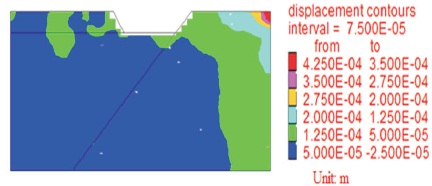
Figure 11. Distribution of Displacement under Dynamic Loading
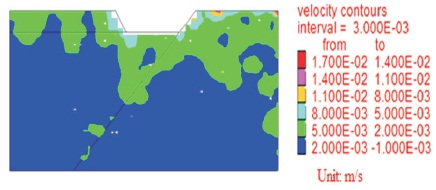
Figure 12. Distribution of Velocity under Dynamic Loading
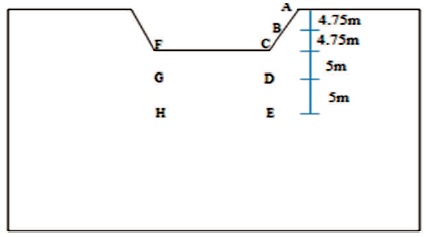
Figure 13. Points considered for Analysis
The velocity time history and displacement time history generated under frequency 21.5 Hz is shown in Figures 14 and 15, respectively. As a parametric study, a vertical joint of width 1mm with loose cohesive clay was also analysed. A vertical joint extended to 5 m and 10 m below the canal bottom was analysed to determine the effect of joints in the rock mass. The displacement contours and velocity contours in the presence of vertical joint is displayed in Figures 16 and 17, respectively.
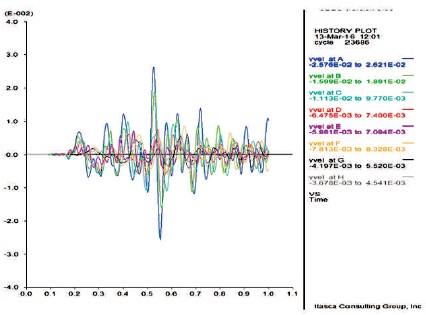
Figure 14. Velocity Time History Generated in 3DEC under Frequency 21.5 Hz
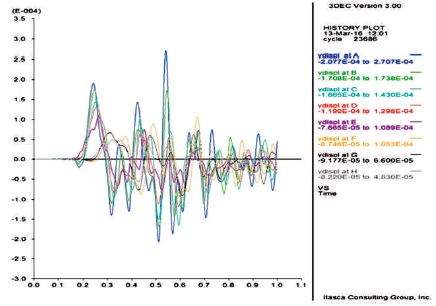
Figure 15. Displacement Time History Generated in 3 DEC under Frequency 21.5 Hz
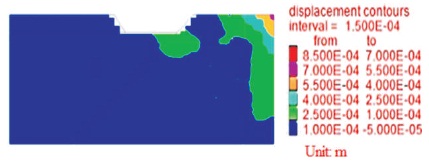
Figure 16. Distribution of Displacement under Dynamic Loading in the Presence of Vertical Joint
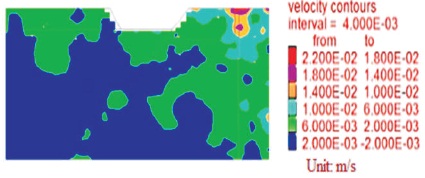
Figure 17. Distribution of Velocity under Dynamic Loading in the Presence of Vertical Joint
Analysis of velocities and displacements at different distance and different points with and without vertical joints was done. Vertical velocity and vertical displacements at different distances for considering points was tabulated in Tables 3 and 4, respectively. From the results obtained, it can be observed that as the distance where the impact of dynamic load is considered increases, the PPV and displacement decreases. The influence of a vertical joint in rock mass on vertical velocities and vertical displacements was shown in Table 5.
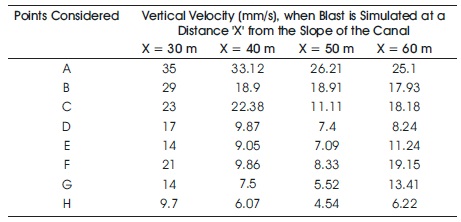
Table 3. Vertical Velocity at Different Points Considered
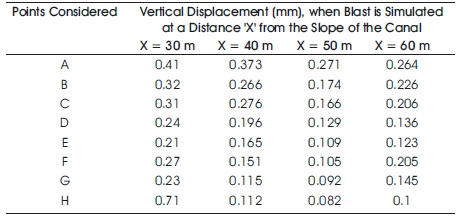
Table 4. Vertical Displacement at Different Points Considered

Table 5. Vertical Velocity and Vertical Displacement with Vertical Joint at Different Points
In the present research study, detailed field investigations were carried out to estimate the dynamic behaviour of canal slope under blast load based on ground vibrations caused due to blasting operations. Studies were carried out over a period of two months at different locations of Yanakandla Mine, Kurnool District of Andhra Pradesh. Following are the main conclusions drawn from the research study,