(1)
The use of PZT (Piezoelectric Ceramic Lead Zirconate titanate) transducers is increasing in the structural health monitoring in identifying the damage parameters like corrosion, cracks, etc. A Mass and stiffness change due to corrosion in the steel bar is going to influence the structural responses to change. This results in a change of conductance signatures which serve as an indicator of the state of health of the structure. Based on the changes in the conductance signatures of the healthy and damaged bar, the damage extent and location can be identified. In the present study, the conductance signatures of a smart cantilever bar actuated by the PZT patch by voltage excitation are studied. The effect of vibrations on the admittance signatures of the healthy and the corroded smart bar are studied for various patch locations. From the peak shifts of current output obtained for pristine and the corroded bar, it is found that change in EMI signatures serves as a sensitive diagnostic tool in the damage detection and also the patch location plays a significant role in the damage detection.
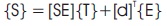
The damage detection of a structure at the earliest possible stage plays a vital role, which helps to take preventive measures before the damage occurrence which attracted research interest. The piezoelectric materials have a dual behaviour of converting the mechanical energy to electric energy and vice versa. Therefore, they have the tendency to act as both actuator and sensor. The following equations are used to represent the relation between the stress, strain, displacement, and electric field of a piezoelectric material.
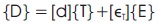
where, {S}= Strain vector, {D}= Electric flux density vector, SE = Compliance matrix, T = Stress vector, d = Coupling matrix, ϵr = Dielectric matrix, and E = Electric field.
In the EMI technique, a piezoelectric patch attached to the surface of the structure is excited by passing voltage. The electrical admittance is a measure of how easily a circuit or a device allows current to flow through it. It is given by Y = G+IB; where, 'G' = Conductance, 'B' = susceptance. The EMI technique plays a vital role to understand the concepts of mechanical impedance as it is analogous to electrical impedance. When a harmonic force is acted upon a structure as discussed by (Bhalla & Soh, 2004), there will be a deviation of mechanical impedance of the damaged (corrosion and cracks) structure to the responses of the healthy structure.
Significant contributions are made by many researchers in the field of EMI technique for corrosion assessment during the last two decades. The functioning of coupled electromechanical system for health monitoring of structures and detecting of the damages by piezoelectric has been proposed by (Liang, Sun, & Rogers, 1997; Yang, Hu, & Lu, 2008) adopted the Structural Mechanical Impedance Technique (SMI) of EMI technique for monitoring the damages in the structures and found that SMI has more sensitivity to damage detection. A very detailed review of various case studies and applications is covered by (Park & Park, 2010; Bhalla & Soh, 2004), who have provided a comprehensive review of the developments in EMI technique. Bhalla, Yang, Zhao, and Soh (2005) have presented a detailed review on different sensor technologies and the importance of damage detection by using piezo impedance transducers in underground structures. The corrosion monitoring techniques and their applications by using piezo electric sensors is covered by (Rothwell, 1978). Naidu and Soh (2004a) and provided a review on the damage growth based on the shift of admittance signatures of the structure. Naidu and Soh (2004b) have studied the damage detection techniques to identify the damage location by using higher modes and the shifts in the natural frequencies are observed. Talakokula, Bhalla, and Gupta (2014) have studied the damage detection and quantification by EMI technique. Ing, Austin, and Lyons (2003) have presented the AeCORR technique to detect the corrosion in specific areas within an existing structure that are in need of repair and also used to assess the rate of corrosion. The authors explained a case study of reinforced concrete swimming pool. Song, Gu, Mo, Hsu, and Dhonde (2007) adopted the wavelet packet analysis, which is used to process the signals from PZT sensors embedded in the concrete bridge bent-cap. The proposed method helps in detecting the existence of crack and monitoring the growth of cracks. Qin, Qin, Ren, Dong, and Xing (2014) have presented a new corrosion monitoring technique in which PZT sensors detect the ultrasonic waves during corrosion. The damage detection in reinforcing bars of reinforced concrete elements using PZT sensors is covered by (Providakis et al., 2014). Tawie and Lee (2010) have studied the bond development between steel reinforcement and fresh concrete by the differences observed in conductance signatures from the PZT patch attached to the rebar. Shendre and Bhamare (2017) have presented the effect of patch location over the length of the cantilever aluminium beam bonded with piezoelectric sensors.
In the present study, a smart cantilever steel bar is considered. The bar is modelled, analysed and the conductance signatures are recorded. Damage (corrosion) is induced in the bar by reducing the cross section over a particular length (at a distance of 100 mm from the fixed end) and the change in conductance signatures are investigated for a fixed patch location of three cases considered. Conductance signatures of the health bar are compared with the signatures of corroded bar. The following cases (Table 1) are considered for the present work.
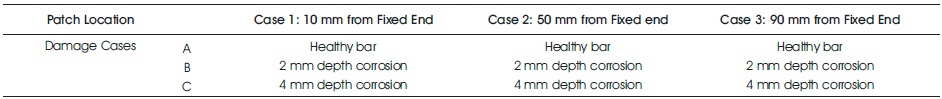
Table 1. Cases Considered with Different Patch Location
Initially, a healthy smart cantilever steel bar with dimensions 10 mm x 8 mm x 300 mm is modelled in ANSYS. SOLID45 element is used to discretize the volume of the healthy smart bar. A PZT patch of 10 mm x 10 mm x 0.3 mm is modelled and attached to the surface of cantilever steel bar. SOLID5 element type, which is used for thermal, electric and piezoelectric, which have 6 degrees of freedom at each node is used to discretize the volume of PZT patch. The patch and the parent bar are coupled by couple field elements. In the present study, adhesive layer is not considered assuming perfect bond between the patch and the host beam. Same procedure is repeated for all the three cases considered and the signatures recorded are compared. The patch locations and the corrosion depths are shown in Figure 1.
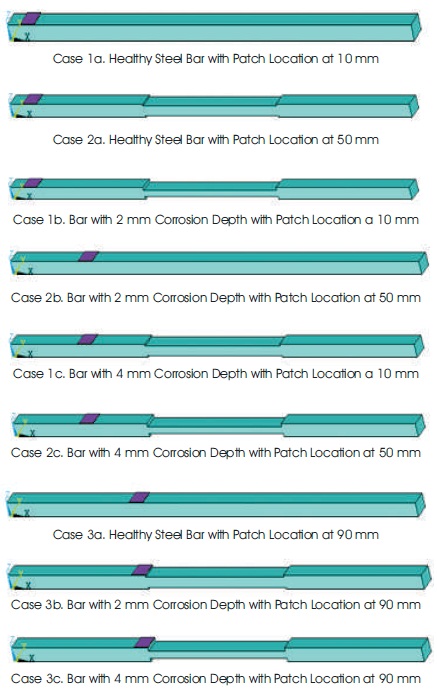
Figure 1. Geometry of Smart Bar for Various Cases
The properties of the cantilever steel bar are mentioned in Table 2 and the piezoelectric patch properties are as mentioned in Tables 3 and 4.
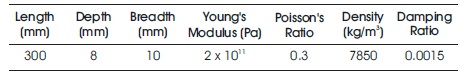
Table 2. Properties of the Beam
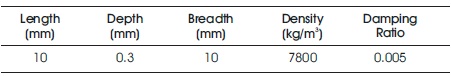
Table 3. Geometric Properties of the PZT Patch
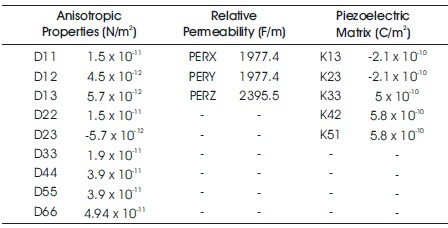
Table 4. Material Properties of the PZT Patch
The bar is excited by applying a voltage of 1 V to the patch. Modal analysis is performed using Bloc Lanczos method in ANSYS. Harmonic analysis with stepped frequency is performed and the output current flow is recorded.
Modal analysis is performed on the steel bar for the three cases. The changes occurred in the fundamental natural frequencies are compared to the healthy steel bar and the corroded bars. Natural frequency changes for various corrosion depths for the cases considered are represented in Table 5 and Figure 2.
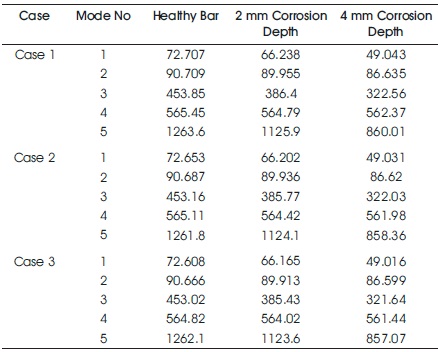
Table 5. Natural Frequencies of Modal Analysis
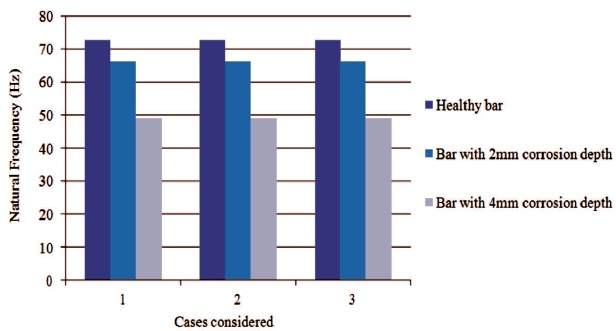
Figure 2. Natural Frequencies of the Bar for the Three Cases Considered
From Table 5, it is observed that the natural frequencies have decreased as the corrosion depth increased. This is due to the change in the volume in turn in mass. Natural frequency is indirectly proportional to the square root of the mass, a decreasing trend is observed as the corrosion depth increased.
Table 5. Natural Frequencies of Modal Analysis
As the volume changes are constant in all the three cases for the three patch locations subsequently, the natural frequencies remain the same in each sub case (healthy bar, bar with 2 mm corrosion depth and bar with 4 mm corrosion depth).
Harmonic analysis is used to find the steady state response of the bar subjected to sinusoidal loads. An alternating voltage of 1V is applied to the PZT on both top and bottom surface of the patch. The reaction output of current is captured and plotted as shown in Figures 3, 4, and 5, respectively. As input voltage is 1 volt, admittance is calculated as Y = I / (V=1), where, I represents the reaction current with conductance as real part and susceptance as imaginary part.
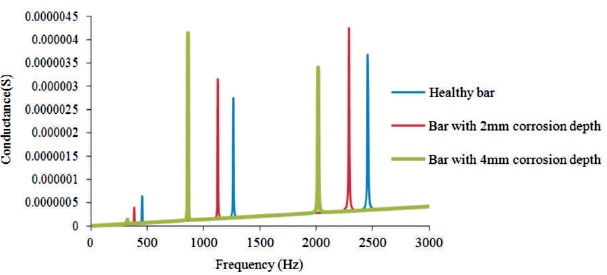
Figure 3. Graph Plotted for Patch Located at 10 mm from Fixed End
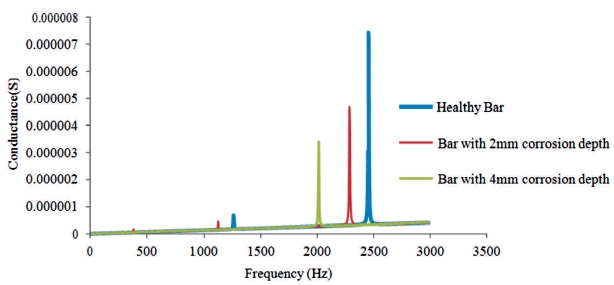
Figure 4. Graph Plotted for Patch Located at 50 mm from Fixed End
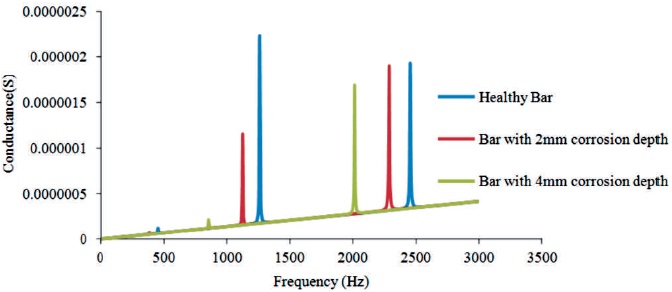
Figure 5. Graph Plotted for Patch Located at 90 mm from Fixed End
Case (1): The patch is located at 10 mm from the fixed end and the conductance signatures obtained from the reaction current (as the Real part of the complex number) are plotted and compared for the healthy bar, the 2 mm depth corroded bar and 4 mm depth corroded bar.
Case (2): The patch is located at 50 mm from the fixed end and the conductance signatures are plotted and compared for pristine bar, bar reduced by 2 mm and bar reduced by 4 mm.
Case (3): The patch is located at 90 mm from the fixed end and the conductance signatures are plotted and compared for pristine bar, bar reduced by 2 mm and bar reduced by 4 mm.
The harmonic analysis is performed with a frequency range of 2000 to 2600 Hz with number of sub steps as 300, where the shift in the peaks of the three cases considered are seen.
It is seen from Figures 6, 7, and 8 that the conductance signature peaks are shifted to the left in damaged bar compared to the healthy bar. As the mass of the bar is reduced, the peaks are seen at lower frequency.
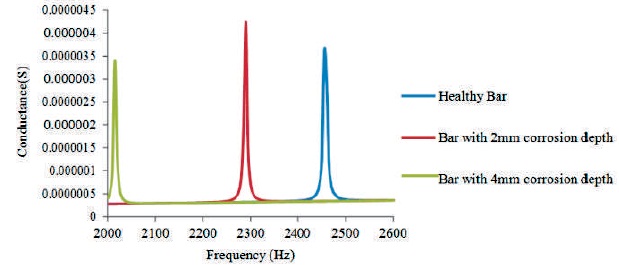
Figure 6. Graph Plotted with Patch Located at 10 mm from Fixed End with Frequency Range 2000-2600 Hz
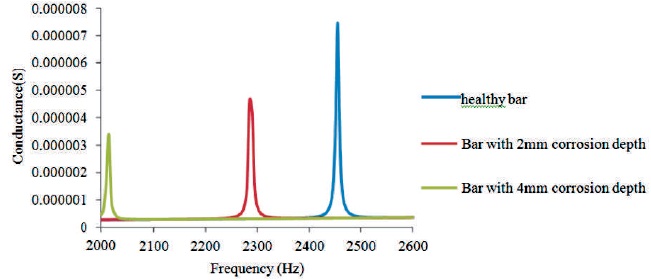
Figure 7. Graph Plotted with Patch Located at 50 mm from Fixed End with Frequency Range 2000-2600 Hz
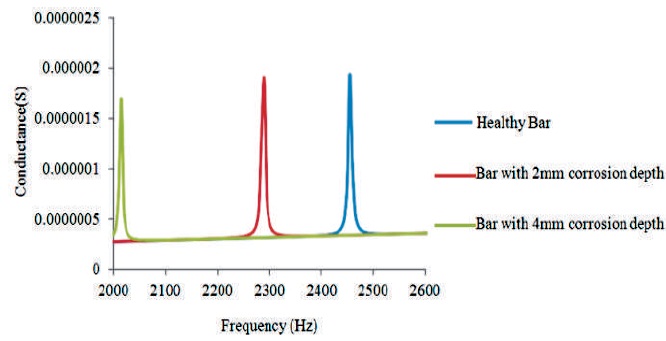
Figure 8. Graph Plotted with Patch Located at 90 mm from Fixed End with Frequency Range 2000-2600 Hz
In the case of patch located far from the fixed end, it is noted that the peak values between the healthy bar and corroded bar are almost the same for the frequency range 2000-2600 Hz.
In the present paper, the results based on the numerical studies are investigated and presented to show that different depths of corrosion and various patch locations alter the sensitivity of conductance signatures using EMI technique.
The changes in the patterns of the conductance signatures of corroded depths of the bars clearly indicate that even a small change in the mass (due to corrosion) changes the vibration characteristics of the beam and can be sensitively diagnosed by EMI technique. For frequency ranges such as 2000 Hz to 2600 Hz, the conductance peak that shift towards the left are observed. This clearly indicates that the reduction in mass of the beam reduces the stiffness and hence results in a left shift of the peak conductance (decrease in frequency).
Patch location from the damage has the significant influence on the conductance peaks of the bar. The left shift with peak reduction pattern is well defined and validated for the patch in the near vicinity of the damage.
It can be concluded that not only the patch location from the damage, but also the distance from the constrained boundaries influence the sensitivity of the signatures. The paper concludes that EMI signature pattern studies for various parameter changes like the location of the patch, damage extent can prove to be the sensitive diagnostic tool for damage detection in SHM.