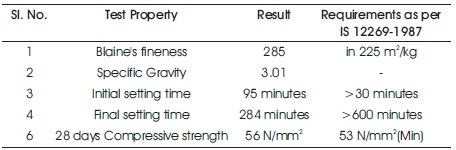
Table 1. Physical Properties of Ordinary Portland Cement (53 Grade)
Bacterial concrete has emerged as a corrective measure for treating cracks in structures such as bridges, RCC buildings, RCC pipes, channel linings, flooring, etc. it cracks and reduces its resistance and also has an impact on the reinforcement once it has come into contact with water, carbon dioxide and various chemicals. To repair cracks in concrete, regular maintenance and special treatment is required, which can be extremely costly. In this paper, Bacillus subtilis bacteria with calcite lactate are used as part of different percentages, such as 5%, 10% and 15% of cement weight for M20 grade concrete. The effect of crushed rock sand on the strength properties of bacterial concrete studied. SEM and X-Ray Diffraction examined on concrete. Bacteria produce CaCO3 precious stones which hinders the smaller scale cracks and pores in the concrete subsequent to responding with calcium lactate.Upto 10%bacterial solution,the concrete strength increses. An empirical relation between flexural strength and compressive strength is proposed in the formula of ft = 0.66 √fck for river sand mixes and ft = 0.82fck0.48 for crushed rock sand .
Concrete has become an essential building material in today's modern era of infrastructure projects around the world. Since this material is subject to cracking, it is unstable due to its fragility and is less resistant to deformation, which requires the use of steel reinforcements or reinforcements. Since the connection with steel bars, concrete becomes more effective in resisting stress than when it does not contain any reinforcement and the tensile strength of concrete is lower than the compressive strength (Wang, Van Tittelboom, De Belie, & Verstraete, 2012). Bacterial concrete usually seeks to repair these defects in order to increase the useful life of any concrete structure. There is a material in the development of concrete self-healing, which will solve many of the problems generally associated with ordinary concrete. Bacillus subtilis bacteria, calcium lactate and nourishing broth are mixed with cement (Li & Herbert, 2012). This document will also explain, in depth, the method that extends in part behind the particular self- healing microorganism and can describe the various parts that partially extend to the process and then work individually and unite. This document will also become sensitive applications of this self-healing technique and, additionally, real integrations into current structures. Once the bacteria are open to the air and, therefore, to the "food", the microorganism exerts an action that causes them to harden and melt, filling the crack that has formed and adheres to the edges of the cracks to heal the cracks. The method to cure a crack will take very little (Jonkers, Thijssen, Muyzer, Copuroglu, & Schlangen, 2010).
Concrete constructions are currently designed to established standards that allow cracks to create up to 2 mm in width. Such small cracks are generally considered acceptable. While in the conventional samples have been remedies of 0.2 mm have been produced (Zwaag, 2008; Reddy, Satya, Rao, & Azmatunnisa, 2012). The basic idea behind this specific version of self-curing concrete is to use certain types of bacteria (in this case, Bacillus subtilis), then work to heal small cracks in the cement before they become larger and more resistant to handle the cracks. This method of bio-calcification involves many parts, to complete these tasks (Jonkers, 2010; Joseph, Jefferson, & Cantoni, 2007). Fashion techniques such as X-ray diffraction tests and SEM analysis are used to quantify the stages of deposition of trees on the surface and in fissures (Kessler, Sottos, & White, 2003; Santhosh, Ramakrishnan, Duke, & Bang, 2000).
In this article, an attempt has been made to study the influence of crushed rock sand as an alternative to river sand on the strength properties of bacterial concrete (Rao, Sravana, & Rao, 2016b). Also, an empirical relation between compression and flexural strength for bacterial concrete has been proposed.
Portland Cement ordinary grade 53 is used in this experimental work. and tested as per IS 4031-1996 and the physical properties are shown Table 1.
Table 1. Physical Properties of Ordinary Portland Cement (53 Grade)
River sand and crushed rock sand were used as fine aggregates in this experimental work. The particle size distribution curve of fine aggregate is shown in Figure 1. The specific gravity of river sand and crushed rock sand are 2.68 and 2.77, respectively.
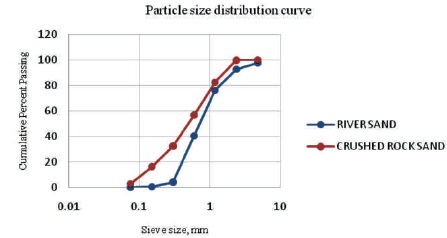
Figure 1. Particle Size Distribution Curve of Fine Aggregate
In Figure 2, the particle size distribution curves of coarse aggregates were shown and the specific gravity of coarse aggregate is 2.71.
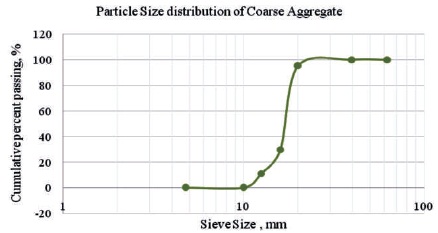
Figure 2. Particle Size Distribution Curve of Coarse Aggregate
The normally available water is used in experimental work for all mixtures.
Bacillus subtilis bacteria used in this experimental work is cultured at DVS Biolife Pvt Ltd Laboratory Hyderabad, India. The bacteria culture prepared from DVS the laboratory was maintained on nutrient agar slants constantly. On the nutrient agar, irregular white colonies are formed. When a single colony of the culture is required, it was inoculated into nutrient broth of 25 ml in 100 ml conical flask. This set up is maintained at 37 oC temperature and placed on orbital shaker at 125 rpm. Peptone: 5 g/lt, NaCl: 5 g/lt, Yeast extract: 3 g/lt are used for culture growth.
Calcium lactate (C6H10CaO6) used for this experimental work together with Bacillus subtilis bacteria as nutritive broth. It is in powder from in white color.
This test was conducted on 15 x 15 x 15 cm cubes and casting was done as per with IS: 516-1959 specifications. Compressive strength of bacterial concrete specimens was measured at 7, 14, 28, 60, 90, 180, 270, 365 days of curing age as per IS 516-1959.
This test was done on 150 mm diameter and 300 mm long cylinder and carried out in accordance with IS: 5816-1999.
This test was performed at 100 x 100 x 500 mm foundry samples where all were made according to IS specifications: 516-1959.
The mix proportions for M20 grade concrete are designed 3 using IS: 10262-2009. Materials required per one m of concrete is shown in Table 2.
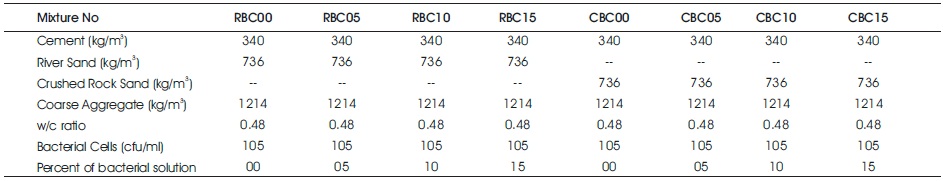
Table 2. Concrete Mix Proportions
From Figure 3, the compressive strength of crushed rock sand mixes is higher in comparison with river sand mixes at all ages, irrespective of percentage of bacterial solution. It was due to the cubical shaped sharp edges of crushed rock sand assists in attaining more strength than river sand mixes.
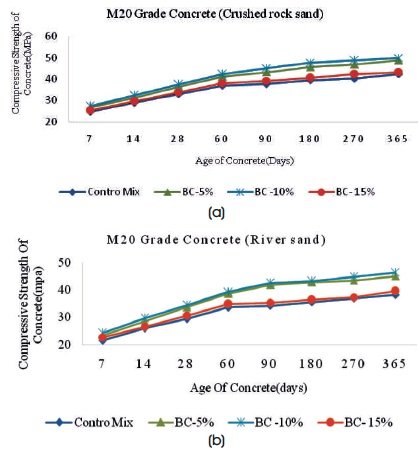
Figure 3. Variation of Compressive Strength with Curing Age for River and Crushed Rock Sand Mixes
The percent increase in compressive strength for BC-5%, BC-10% and BC-15% are 14.5%, 16.8%, and 3.60%, respectively in comparison with control mix concrete at 28 days. Similarly, the percent increase in compressive strength at 180 days are 20.27%, 21.25%, and 2.27% respectively. At 365 days, these percentages are 18.34%, 21.48%, and 3.72%, respectively for BC-5%, BC-10%, and BC-15%. Whereas the percent increase in compressive strength of crushed rock sand mixes at 28 days for BC-5%, BC-10%, and BC-15% are 10.41%, 13.44% and 2.72%, respectively.
Similarly, the percent increase in compressive strength at 180 days are 15.66%, 20.67%, and 2.53%, respectively. At 365 days, these percentages are 15%, 16.84%, and 1.84% respectively for BC-5%, BC-10% and BC-15%. From the above it was seen that the gain in compressive strength at 180 days and 365 days is higher than the compressive strength at 28 days due to the contribution of Bacillus subtilis bacteria and calcium lactate to compressive strength is prominent at ages more than 28 days for river sand mixes and crushed rock sand mixes. Also, the percentage of bacterial concrete increased from 0% to 10% and the compressive strength also increased, but at 15%, the compressive strength is reduced because hydration products are saturated at 10% bacterial solution, with increase in bacterial solution does not contribute to strength and hence here is reduction in strength. Crushed rock sand mixes showed promising results than river sand mixes because of cubical sharp edged faces of grains in rock (Figure 4).
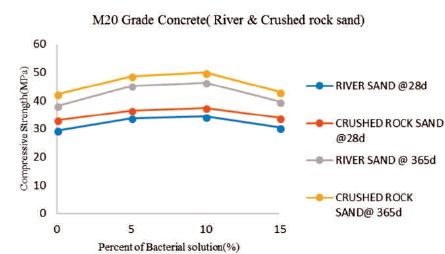
Figure 4. Effect of Bacterial Solution on Compressive Strength
From Figure 5, the split tensile strength of crushed rock sand mixes is higher in comparison with river sand mixes at all ages, irrespective of percentage of bacterial solution.
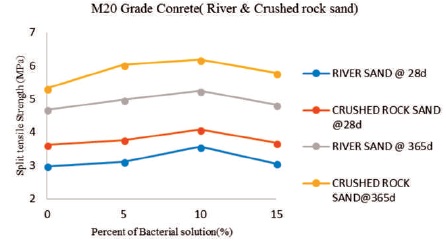
Figure 5. Variation of Split Tensile Strength with Curing Age for River and Crushed Rock Sand Mixes
The percent increase in split tensile strength of river sand mixes for BC-5%, BC-10%, and BC-15% are 4.69%, 19.46%, and 2.68%, respectively at 28 days. Similarly, the percent increase in compressive strength at 180 days are 16.58%, 25.12%, and 3.51%, respectively. At 365 days, these percentages are 6.41%, 11.96%, and 2.99%, respectively for BC-5%, BC-10%, and BC-15%. In crushed rock sand mixes, the percent increase in split tensile strength of M20 grade concrete at 28 days for BC-5%, BC- 10%, and BC-15% are 3.86%, 12.70%, and 1.65%, respectively. Similarly, the percent increase in compressive strength at 180 days are 9.74%, 13.13%, and 2.54%, respectively. At 365 days these percentages are 13.2%, 16.16% and 8.64% respectively for BC-5%, BC-10%, and BC-15% (Figure 6).
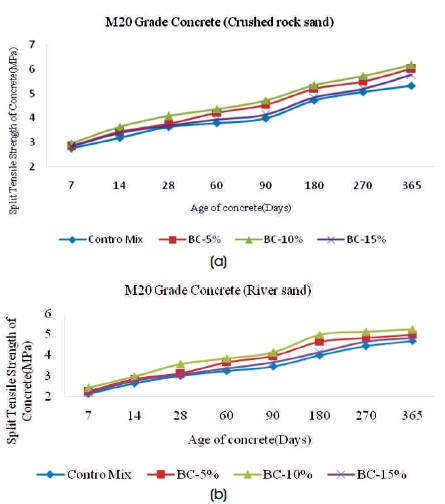
Figure 6. Effect of Bacterial Solution on Split Tensile Strength
From Figure 7, it was noticed that the flexural strength of crushed rock sand mixes is higher in comparison with river sand mixes at all ages, irrespective of percentage of bacterial solution. The percent increase in flexural strength of river sand mixes at 28 days for BC-5%, BC-10%, and BC- 15% are 5.64%, 7.90%, and 2.25%, respectively. Similarly, the percent increase in flexural strength at 180 days are 4.43%, 10.34%, and 1.97%, respectively. At 365 days, these percentages are 5.68%, 9.47%, and 1.42%, respectively for BC-5%, BC-10%, and BC-15%. It was noticed that as the percentage of bacterial concrete increased from 0% to 10% the flexural strength also increased, but at 15% the flexural strength is reduced. This is due to the fact that the hydration products are saturated at 10% bacterial solution, with further increase in bacterial solution does not contribute to strength and hence there is reduction in strength (Figure 8).
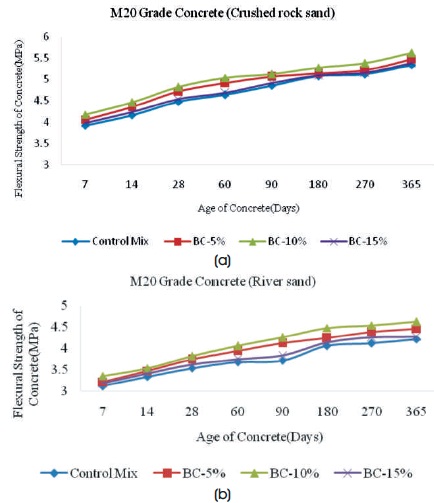
Figure 7. Variation of Compressive Strength with Curing Age for River and Crushed Rock Sand Mixes
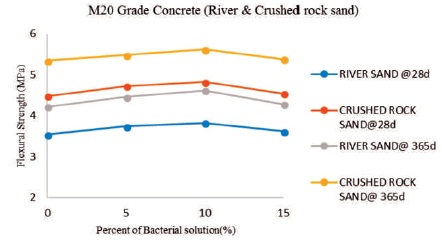
Figure 8. Effect of Bacterial Solution on Flexural Strength
In crushed rock sand mixes, the percent increase in flexural strength at 28 days for BC-5%, BC-10%, and BC-15% are 5.35%, 7.58%, and 1.34%, respectively. Similarly, the percent increase in flexural strength at 180 days are 1.18%, 3.93%, and 0.39%, respectively. At 365 days, these percentages are 2.62%, 5.24%, and 0.75%, respectively for BC-5%, BC-10%, and BC-15%. It was observed that as the percentage of bacterial concrete increased from 0% to 10% the flexural strength also increased, but at 15% the flexural strength is reduced, this is due to the fact that the hydration products are saturated at 10% bacterial solution, with further increase in bacterial solution does not contribute to strength.
The SEM analysis image for control concrete has a magnification of 10000 and 2500, Sub acceleration voltage 10000 volts, Pixel sizes of 9.921875 and 39.6875. Figure 9 shows the microstructure of the conventional concrete. The SEM analysis image for Bacterial concrete concrete has a magnification of 10000, 20000, and 2500, Sub acceleration voltage 10000 volts, Pixel sizes of 9.921875, 4.960938, and 39.6875. Figure 10 shows the micro structure of the Bacterial concrete. The SEM analysis images show the occurrence of calcite precipitation in the bacterial concrete. CSH, CH, and pores occurred in all samples. Calcite is observed in pores, in case of bacterial concrete. It clearly shows that the porosity decreases and gain in strength and the cracks also healed due to calcite formation.
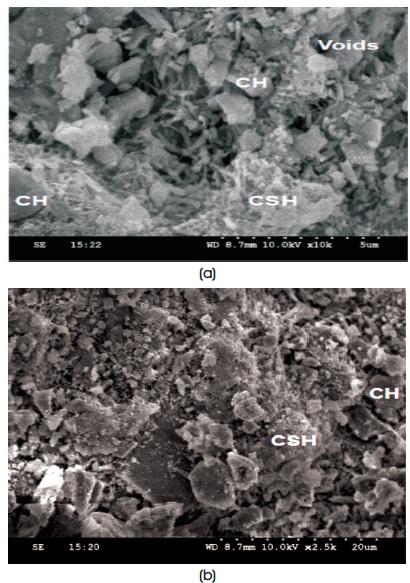
Figure 9. SEM Micrograph of Control Concrete (a) Magnification at 10000, (b) Magnification at 2500
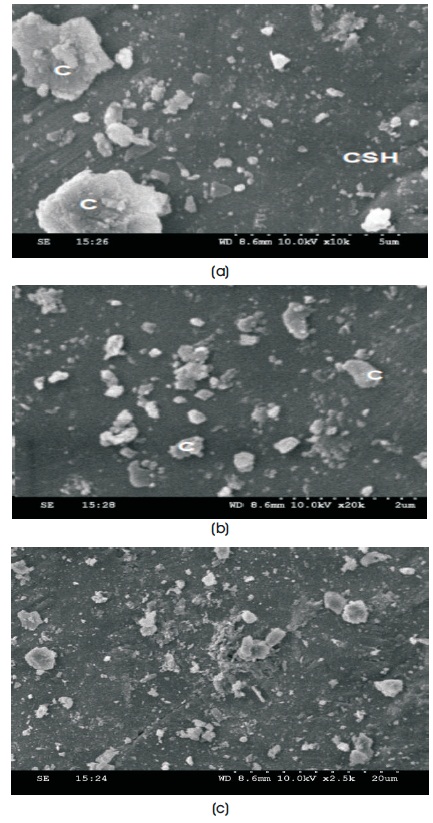
Figure 10. SEM Micrograph of Bacterial Concrete (a) Magnification at 10000, (b) Magnification at 20000, (c) Magnification at 2500
Figures 11 and 12 show peaks of quartz, calcium silicate hydrate, Larnite, calcite, and ettringite. Calcite composition is increased expressively in bacterial concrete compared to control concrete. In Figure 12, from 28 to 33 the existence of unclear content is specified along with calcite, Portlandite, and larnite
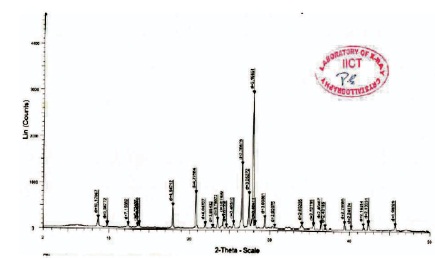
Figure 11. XRD Diffractogram of Control Concrete
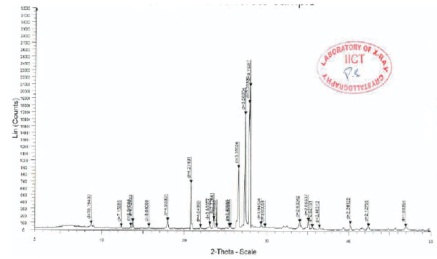
Figure 12. XRD Diffractogram of Bacterial Concrete
Empirical relations from various sources are as follows:


Figures 13 and 14 show the relationship between compressive strength and flexural strength (Anbuvelan & Subramanian, 2014; Yusuf, Jimoh, & Salami, 2016) of bacterial concrete with different bacterial percentages (BC-5%, BC-10%, and BC-15%). From the experimental results, the empirical relation for bacterial solution has been proposed as under:
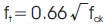
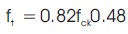
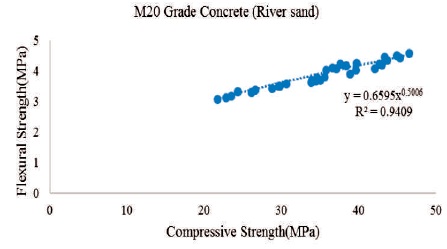
Figure 13. Empirical Relation between Compressive Strength and Flexural Strength
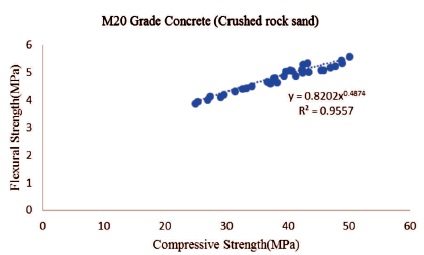
Figure 14. Empirical Relation between Compressive Strength and Flexural Strength
The following are the conclusions drawn from the experimental work.
for river mixes and for crushed rock sand.