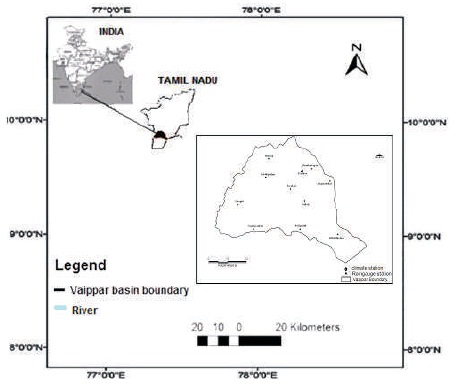
Figure 1. Selected Rain Gauges and Climate Stations for the Study Area
Studies related to climate variability and change, hydrological designs, crop planning, etc., require long-term homogeneous datasets (Mahmood & Jia, 2018). Since homogeneous climate data is not available for climate analysis in countries like India, the present study emphases the quality control of meteorological data. Ten rain gauge stations were selected for the study in the Vaippar basin. This study concludes that daily precipitation time-series are homogeneous. Meteorological 'data filling' was done using the normal ratio method. The homogeneity and consistency check of the data was carried out using visual interpretation and double mass curve analysis (Wijesekera & Perera, 2012). Results display no suspicious values and no break in double mass curves, which indicates homogeneity and consistency (Eris & Agiralioglu, 2012). The relationship between monsoon rainfall and Sea Surface Temperature (SST) also suggests that not all El Niño Southern Oscillation (ENSO) events were associated with drought.
Studies related to water resources heavily depend on the quality of hydrological data (Sutcliffe & Lazenby, 1990). Several quality assurance procedures were applied to the data in this project to ensure stationary, consistency, and homogeneity. These data can simulate a hydrological system (Hack et al., 2006). A time-series of hydrological data is strictly stationary if its statistical properties such as its mean, variance etc., are time-invariant (Machiwal & Jha, 2009). These properties should agree within the range of expected statistical variability (Tan & Gan, 2015). For a time-series of hydrological data, the basic data-screening procedure is split-record tests for stability of the variance (F-test), and stability of mean (t-test) (Khan, 2001). A time-series of hydrological data may exhibit jumps (sudden change) and trends (gradual change) related to inconsistency and non-homogeneity (Akinsanola & Ogunjobi, 2017). Inconsistency is systematic error associated with the recording of hydrological data (Curtis & Burnash, 1996). It can arise from instruments and methods of observation (Habib, Krajewski, & Kruger, 2001). Non-homogeneity is a change in the statistical properties either natural or man-made (Yevjevich & Jeng, 1969). The data screening procedure used the analysis described below to check for the consistency and homogeneity of the data, for each of the selected stations. The most common method used to estimate rainfall data is the Normal Ratio method (Chow, Maidment, & Mays, 1988). Rough screening of the data and visual examination can be done by plotting the data for total hydrological years (Dahman & Hall, 1990). Double-mass analysis (Searcy & Hardison, 1962), shows relative consistency and homogeneity of data. Meteorological data of the Pingliang station was checked using double-mass analysis (Searcy & Hardison, 1962). Precipitation is a good indication of long-term changes which impact water resources potential and availability (Ampitiyawatta & Guo, 2009). Rainfall plays an important role in determining the water resources potential and agricultural activities, particularly in arid and semi-arid basins (Singh & Kumar, 2010). According to the Intergovernmental Panel on Climate Change (Griggs & Noguer, 2002), the factors influencing the cause for water scarcity in the Indian subcontinent are mostly the temporal and spatial distribution of precipitation rather than the total amount. Therefore, it is important to analyze the quality of rainfall events, since it is a limiting factor as far as the study area is concerned. The timing and intensity of El Niño - induced droughts vary from region to region (Vicente- Serrano, 2005). This paper, which examined the relationship between monsoon rainfall and the El Niño Southern Oscillation (ENSO) index, could also help to identify incidence of drought in the study area.
The Vaippar river basin is one of the semi-arid basins of Tamil Nadu in India and is situated between latitudes 8o 59' N to 9o 49' N, and longitudes 77o 15'E to 78o 23'E, with a drainage area of 5423 km2 (IWS 1994b). The basin is bounded by the Western Ghats, a mountainous region in the western part of Tamil Nadu, the Bay of Bengal in the east, the Thamirabarani basin in the south, and the Gundar basin in north (IWS 1994a). The rainfall series from 10 rain gauge stations covering a period of 65 years (1935-2010) were analyzed in the study. These data were provided by the Institute of Water Studies, Chennai. The basin is dominated by cyclonic rainfall, which occurs during the northeast monsoon (Oct–Dec), and convectional rain also occurs during summer season (March–May) (Pandian & Sankar, 2007); this shows strong seasonality. The basin has a tropical monsoon climate, with a hot summer and mild winter, which agro-climatically, is described as a semi-arid region (Palanisami, Ranganathan, Vidhyavathi, Rajkumar, & Ajjan, 2011).
Daily and monthly climate data were available for the period of 1970 to 2010 (IWS, 2010). For simulating a hydrological system these data should be consistent and homogeneous. Ten rain gauge stations and one climate station representing the basin were selected for the study as shown in Figure 1.
Figure 1. Selected Rain Gauges and Climate Stations for the Study Area
The El Niño -Southern Oscillation (ENSO) index is the climate indices contributing to the regional climate changes. The ENSO indices SST from Niño 3.4 Index (from 1950 to 2010) were downloaded from the website: http://www.cpc.noaa. gov/data/indices/ - Accessed on: 11 Dec 2018. The monthly Niño 3.4 Index was used to classify the ENSO events. The anomaly for each year was obtained by taking the mean of the 12 months of each year. According to Darshana & Ashish (2012), this index is grouped into four major categories, such as Very Strong, Strong, Moderate, and Weak El- Niño years. The El- Niño years were classified according to their temperature anomalies during the study period. The correlation between the ENSO events, monsoons, and the SST was analyzed in the present study.
Stations with missing data were filled either by the normal ratio method or by the distance power method (De Silva, Dayawansa, & Ratnasiri, 2007). In the normal ratio method, the rainfall R at station A was estimated as a function of the A normal monthly or annual rainfall of the station A. For the period of missing data at the station A, rainfall R at station i i was estimated as a function of the normal monthly or annual rainfall of the neighboring stations. This technique is used when the normal annual precipitations at various stations showed a variation >10% with respect to station A. The precipitation/rainfall at station A was calculated using the following equation:
where,
Pi = rainfall at surrounding stations,
NRA = normal monthly or seasonal rainfall at station A,
NRi = normal monthly or seasonal rainfall at station i,
n = number of surrounding stations whose data are used for estimation.
PA = rainfall at station A.
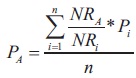
The graphical comparison method and visual examination were conducted to test the relative consistency and homogeneity of monthly rainfall data (Hänsel, Medeiros, Matschullat, Petta, & de Mendonça Silva, 2016). This was carried out by plotting the time series for monthly rainfall data. The rain gauge stations in the study area show a similar periodic pattern of records (Figure 2). Comparison of rainfall data of one station with the other stations using graphs did not show any other 'suspicious' values.
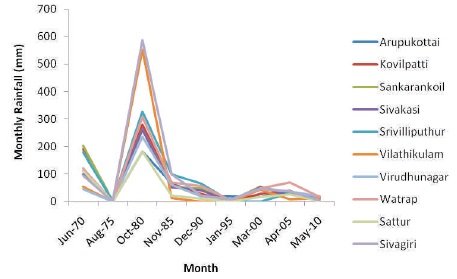
Figure 2. Monthly Rainfall at Rain Gauge Stations
Double mass curve analysis was used to detect the significant long-term systematic shift in rainfall data (Gao et al., 2017). A distinct change in the slope of the double mass curve may occur due to the change in instrument location or due to the inconsistency in rainfall data (Mu, Zhang, Gao, & Wang, 2010). To check the proportionality of the observed rainfall data, the accumulated rainfall data are plotted against the mean value of all neighborhood stations. The data can be made consistent by adjusting the slope so that there is no break in the resulting double mass curve (Scaff, Yang, Li, & Mekis, 2015).
Figure 3 shows the double mass curves for the selected rain gauge stations in the study area. The time-series observations of rainfall data for the 10 rain gauge stations are relatively consistent and homogeneous as there is no break in the double mass curve.

Figure 3. Double Mass Curves for the Rain Gauge Stations
ENSO simulation is a crucial task in the climate system, and a primary measure of success has been the magnitude of Sea Surface Temperature (SST) anomalies in the Niño 3.4 region (Latif et al., 2001). Table 1 presents El- Niño events during the study period, and their temperature anomalies. From all 28 ENSO events, 20 events were related to poor monsoons (negative correlation), and the remaining 8 ENSO episodes were positively correlated. Thus, the results showed that in the study area, monsoon rainfall had no significant impact on ENSO episodes.
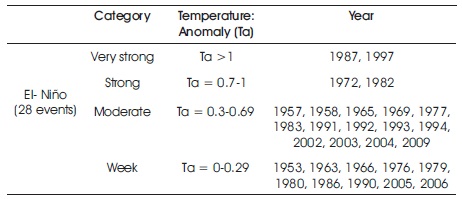
Table 1. El- Niño Events and their Temperature Anomalies
The warmest ENSO events like 1997, 1972, and 1982 were related to poor monsoon rainfalls in the basin (except 1987). The variation in Sea Surface Temperature (SST), and its correlation with monsoon rainfall (Figure 4), showed that most of the dry seasons were negatively related to the warm ENSO episodes.
The years 1987, 1983, 1953, 1963, 1979, 1976, and 1980 from Figure 4 (a-d) showed positive correlation with the ENSO episodes when the recorded monsoon rainfall was above normal. It is also noted that except the wettest monsoon season of the year 1983, there was no ENSO event. From Table 1, it can be observed that there were 40 dry seasons during the period. Out of the 40 dry seasons, only 11 were inversely correlated with the ENSO events.
From the results, it can be concluded that not all ENSO events were associated with drought, and many droughts were not accompanied by ENSO in this basin.
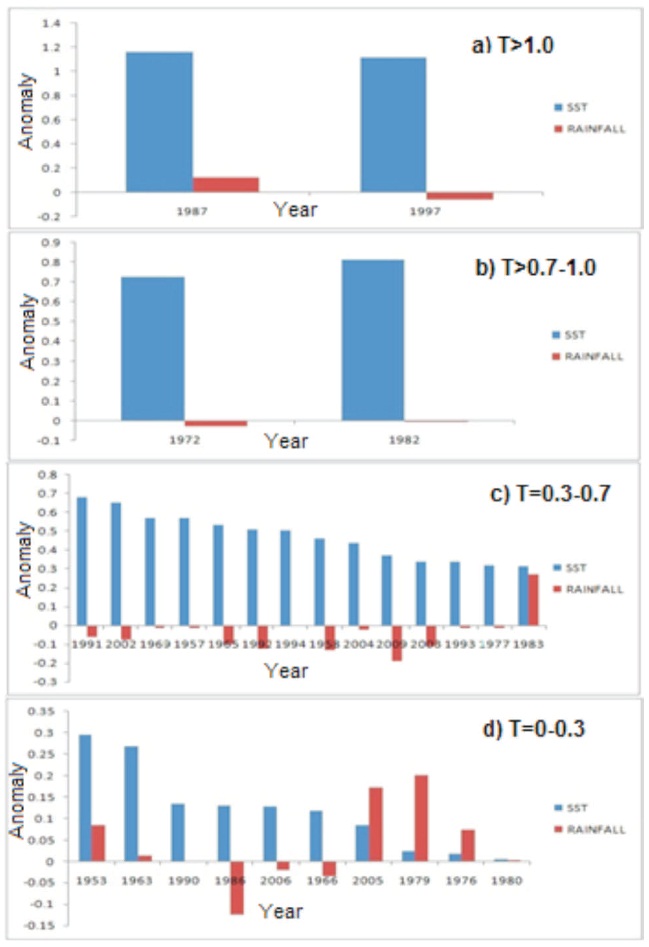
Figure 4. Rainfalls and SST Anomaly a) Temperature Anomaly T > 1.0 b) Temperature Anomaly T = 0.7 - 1.0 c) Temperature Anomaly T = 0.3 - 0.7 d) Temperature Anomaly T = 0 - 0.3
The missing data in the time-series was 'filled' by normal ratio method. Time-series observational data is relatively consistent and homogeneous if the periodic data are proportional to an appropriate simultaneous period (Chang & Lee, 1974). This proportionality can be tested by double mass analysis and visual interpretation (Merriam, 1937). It is recommended that in estimating missing rainfall data, Arithmetic Mean method, Normal Ratio method, and Inverse Distance method can be compared and the degree of suitability of these methods for the river basin should be studied. In this study, there are no outliers or any other 'suspicious' values. The result of the double mass curves indicates that there is no break in the curves for these ten rain gauge stations. The ENSO on the East Asian rainfall is not limited to summer (Zhang, Sumi, & Kimoto, 1999; Wang, Wu, & Fu, 2000). Thus, it is necessary to systematically document how ENSO affects rainfall anomalies in the other seasons. The relationship between rainfall, temperature, and ENSO/SST showed that not all of the ENSO events were associated with drought, and many droughts were not accompanied by ENSO in this basin. It is also recommended that rainfall temperature can be correlated with other atmospheric indices to clearly understand the climate change evidence.
We would like to express our thanks to Anna University, Chennai for awarding Anna Centenary Research Fellowship for conducting this study. The authors are also thankful to the Institute of Water Studies Chennai for having provided the climate data.