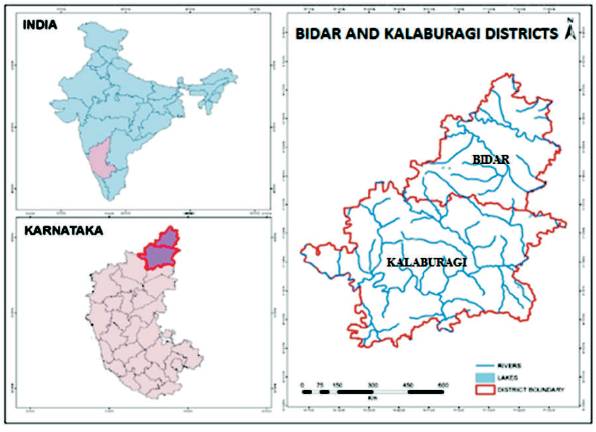
Figure 1. Study Area Map
The soil moisture is a significant analysis of understanding the moisture content in soil that are moist. The soil moisture Index measures the moisture condition at different levels in the soil. It is mostly determined by the rainfall via the method of penetration. To bring out the geospatial data that allows to generate suitable information relating to soil moisture content, the authors have used the remote sensing method and different types of GIS software that depend on the use of Soil Moisture Index (SMI), such as Normalized Difference Vegetation Index (NDVI) and Land Surface Temperature (LST). Landsat 8 satellite images that are provided with visible (red band) and infrared bands (near infrared bands) are important for calculating NDVI and the Band 10, Band 11 along with NDVI is provided as the input for LST analysis. SMI is based on the observed parameters and the relationship between LST and NDVI. The SMI condition is done for Bidar and Kalaburgi districts, Karnataka, India for the month of April in 2017. Soil moisture data are collected from under the surface from a long period as well as at higher spatio-temporal resolutions data that are very important in assessing the severity and also the level of drought is relatively accurate.
The Soil Moisture Index measures the moisture condition at different levels in the soil (Brosinsky et al., 2014). It is mostly determined by the rainfall via the method of penetration. Soil moisture is actually a diverse variable and also differs on minor scales with the soil properties and the drainage forms (Albergel et al., 2013). Remote sensing measurements add over a comparatively large area with the existence of the crop cover that adds a complexity in the interpretation (Kanga et al., 2013; Engman and Chauhan, 1995; Holzman et al., 2014).
The capacity of soil is to be a source of supplying moisture to vegetation. The moisture content is always being pretentious by increasing the temperature and the changes in rainfall pattern (either being deficit rainfall or excess rainfall), mutually that of which is clearly an indication of variations in the climate condition (Ismail and Yacoub, 2012; Ridler et al., 2012; Moran et al., 1994). Preserving the water capacity and absorbency are the most significant measures to decrease the influences of rainfall and deficiencies tending to drought, which is likely to turn into more recurrent and severe (Singh, 2016; Nemani and Running, 1989).
Soil moisture is also an essential part in the water cycle. The water content in soil have much impact on ranges of physical, chemical, and biological processes in the environment (Singh et al., 2017a; O'Neill et al., 1996; Srivastava et al., 2013). Further, the hydrologic activities in the land is affected by the soil moisture condition by controlling, in addition, the penetration capability of the soil and the separation of precipitation as overflow and storages (Kanga et al., 2011; Singh and Pandey, 2014). For the reason measured, soil moisture conditions are a serious contribution for the crop growing, biology, weather forecasting, hydrology, and climatology.
Though, the ability to define and map soil moisture conditions along a large geographic area is vulnerable by the spatio-temporal changes in the soil, topography, land use and land cover, and precipitations (Kanga and Singh, 2017; Singh et al., 2017b). Mostly, soil moisture is calculated directly in the field at a particular point and the spatial interpolation method, where these point extents are used to create a continuous moisture analysis on the surfaces. Though, the physical approach takes a longer time and it is not that optimum for quick and desired soil moisture monitored at the particular level of the scale (Mei and Wang, 2011; Wu et al., 2011).
Soil moisture acts as a crucial role in relating the famine, weather, and vegetation. Soil moisture data are collected from the surface from a long period, as well as at higher spatio-temporal resolutions data that are very important in assessing the severity and relatively accurate level of drought (Tucker, 1979; Singh et al., 2014).
Soil dampness is difficult to portray in light of the fact that it is a diverse thing in various orders. For instance, an agriculturalist's idea of soil dampness is not the same from that of a water asset utilizer or a climate forecaster. More often than not, soil dampness is the water that is in the holes between soil particles. Surface soil dampness is the water that is found in the main 10 cm of soil, while in the root locale, soil dampness is the water that is acquired by the plants, which is normally measured to be in the best 200 cm of soil compared to different parts of the hydrologic cycle, where the degree of soil wet is small; yet, it is of basic importance to several hydrological, biological, and biogeochemical processes. Soil wet data is effective to a good variable of presidency agencies and personal firms involved with weather and climate, runoff potential and control, erosion and slope failure, reservoir management, geotechnical engineering, and water quality. Soil wet may be a key variable in dominant of the exchange of water and warmth energy between the land surface, therefore the atmosphere is through the evaporation and plant transpiration. As a result, soil wet plays a vital role within the development of weather patterns and therefore there is a production of precipitation. Simulations with numerical weather prediction models have shown that improved characterization of soil wet, vegetation, and temperature will cause vital forecast enhancements. Soil wet conjointly powerfully affects the quantity of precipitation that runs off into close streams and rivers. Soil wet data is used for reservoir management, early warning of droughts, irrigation programing, and crop yield statement.
Bidar is located at 17°54′N 77°30′E 17.9°N 77.5°E, which has an elevation of 2300 ft. from the mean sea level. It shares a boundary with Maharashtra and Telangana, where the South lies in the district Kalaburgi of Karnataka. The elevation ranges from 300 to 750 m above the mean sea level. The study area is shown in Figure 1.
Figure 1. Study Area Map
The dataset required is tabulated in Table 1. The flowchart of the proposed system is shown in Figure 2.
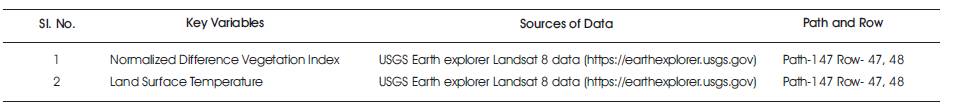
Table 1. Datasets Required
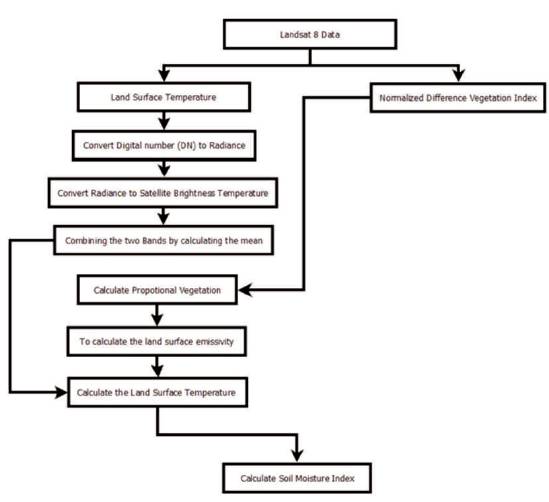
Figure 2. Flowchart of the Proposed System
Normalized Difference Vegetation Index (NDVI) is based on the indication of vegetation strength and the sign of water occurrence or deficiency. It lets us to examine the effect of climatic situations of the plant life to an extent and observe the absorption capability of the vegetation in the visible band and the near-infrared band. The variance in the visible reflectance and near-infrared reflectance signifies the photosynthesis properties of the vegetation. NDVI is given in the value representing between -1 to +1. The lower value indicates the moisture stress in the vegetation, resulting due to prolonged rainfall shortage or absence. The higher vegetation values indicate a perfect climatic condition for the crops.
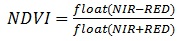
where, NIR is the reflectance of NIR radiation and RED is the reflectance of visible red radiation. In Landsat 8 satellite data, the NIR is band 5 and Red is Band 6.
The Land Surface Temperature (LST) is the temperature of ground. It depends on the albedo, the plant life cover, and the soil moisture condition. In most circumstances, LST is a combination of vegetation and simple soil temperatures because both react rapidly to variations of the solar radiation owing to the cloud cover and vaporization and day time illumination difference. The LST shows rapid variations and in turn, effects the energy between surface and vegetation cover (Table 2).
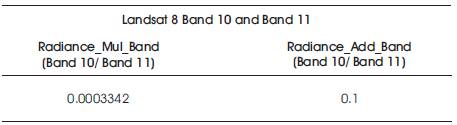
Table 2. Landsat 8 Radiance Band
1. Digital Number (DN) is converted to Radiance.
Using band 10=Radiance_mul_band(Band10) *Band10* Radiance_add_band(Band10)
Using band 11=Radiance_mul_band(Band11)* Band11* Radiance_add_band(Band11)
2. Radiance to Satellite Brightness Temperature
3. The two bands are combined by calculating the mean.
4. Normalized Difference Vegetation Index,
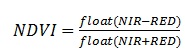
where, NIR is the reflectance of NIR radiation and RED is the reflectance of visible red radiation
5. The Proportional Vegetation is calculated as,

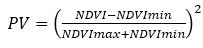
6. The land surface emissivity is calculated as,
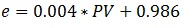
where, PV - Proportional Vegetation
e - Emissivity
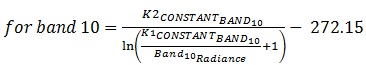
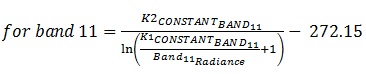
7. Land Surface Temperature (Band 10 and Band 11)
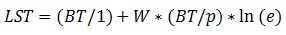
where, BT - Satellite Brightness Temperature
W - Original Band (Band 10 or Band 11)
1 - Constant
p - 14380 (Constant)
8. Data is validated.
Soil Moisture Index (SMI) is reliant on the usage of NDVI and LST that are calculated from the multi spectral satellite imagery (Landsat 8 is used) for each of the pixels. The Landsat 8 thermal constant is shown in Table 3. SMI values vary from 0 to 1, where the higher value close to 1 indicates higher level of soil moisture and the lower value that is close to 0 indicates lower level of soil moisture. Zhao and Li (2013) classify that the soil moisture index values greater than 0.3 are denoted as “no drought” or “favorable soil moisture conditions”, while soil moisture index values less than 0.3 are categorized into three categories of drought, they are “severe drought condition”, “moderate drought condition”, and “less drought condition”.
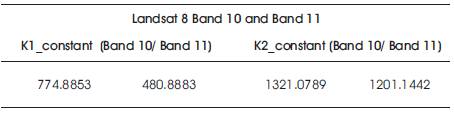
Table 3. Landsat 8 Thermal Constant
SMI is created using the observed parameter and by the correlation among NDVI and LST and it is calculated by using the formula,
where, LSTmax and LSTmin are the maximum and minimum land surface temperature for a given NDVI and LST, that is surface temperature of each pixel for a given NDVI input derived from remotely sensed data.
Figure 3 shows NDVI in April 2017.
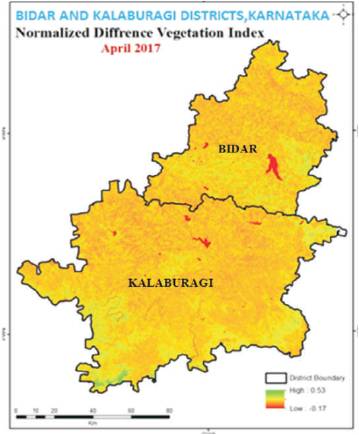
Figure 3. Normalized Difference Vegetation Index in April 2017
Figure 4 shows the land surface temperature in April 2017.
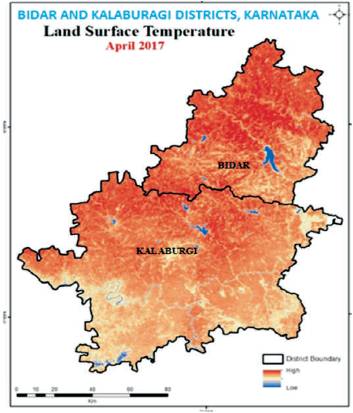
Figure 4. Land Surface Temperature in April 2017
From Figure 5 which shows the SMI in April 2017, it is clear that the soil moisture condition in January 2016 is very low compared to January 2017 soil moisture condition. The soil moisture index is given ranging from 0 to 1, where the value that are nearly equal to 0 are very low and is given in red color in the map and the value that are nearly equal to 1 has high content of moisture in the soil and it is shown in blue color in the map (Figures 6 (a) and (b)).
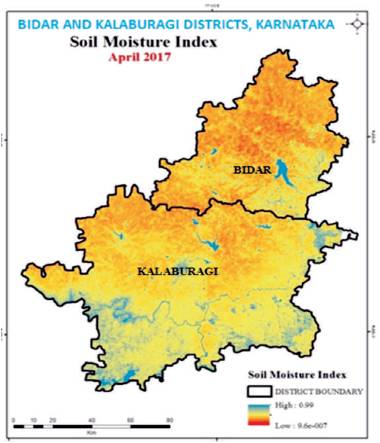
Figure 5. SMI in April 2017
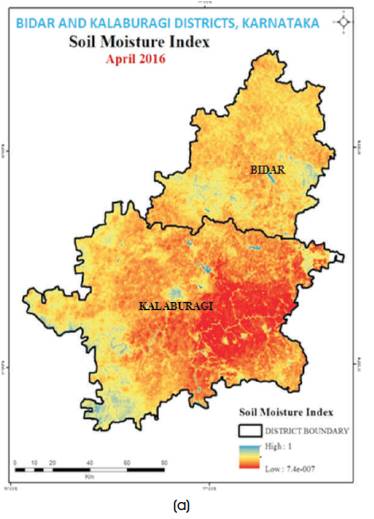
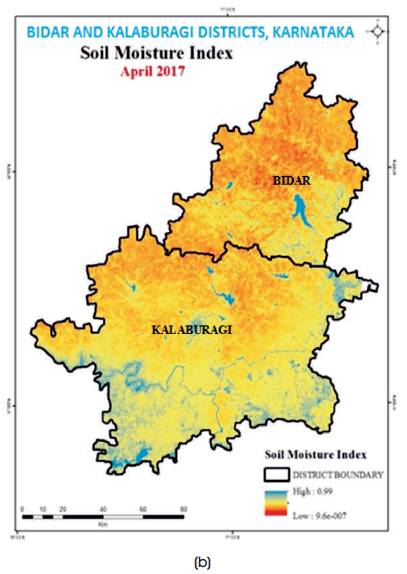
Figure 6. (a) and (b) Comparison between SMI in April 2016 and SMI in April 2017
Larger values of the SM index represent the higher water/moisture existence and lower values represent dry areas hence, the authors conclude that in January 2017, Soil Moisture condition is not very low, and the moisture is in moderate condition. Whereas, in January 2016, the Soil Moisture condition is very low and the water bodies in the district had shortage of water.
From the acquired results we can analyze the soil moisture in the study area, i.e. Kalaburgi and Bidar districts. SMI has accurately depicted the surface moisture for one month. The moisture index was compared for the same month of two different years and was found to differ based on seasons, owed due to the change in the vegetation. The index was also sensitive to existing and antecedent moisture conditions. Contrasting vegetation indices, which would preferably be extremely delicate to vegetation and the segregation of the soil family, with minor effect as of the radiance, the current method exploits the reaction of numerous surface kinds.