(1)
Transportation facilities are the mainstay for any economic progress in country's development. However, presently highways are the biggest hazard to the world as they account for a major number of road accidents. Repetitive crashes at any location on the road are known as blackspots. These can be due to numerous crash causative and geometric factors and is not an arbitrary occurrence. An effort is made to identify these blackspots on NH 44 over a 40 km stretch and audit studies were conducted at the blackspot locations. Audit study is a procedure for evaluating crash prospective, safety performance, rehabilitation of existing pavement, and maintenance of highways. The prime objective of an audit study is to identify the problems of a highway project by conducting the site inspection and collecting data from various agencies. The designer or client then studies the recommendations and a decision is made whether or not to implement the suggested safety amendments. With the aim of decreasing the escalating road accidents, the current study aids in evaluating the black-spot locations on the highway where the major road crashes occur. Accident data for the preceding five years (2011-2015) on NH 44 was collected from a secondary source in terms of time, km range, nature of accidents, road condition, and causes of crash. This data is analysed using accident severity method for identification of black-spot locations. These identified black-spot locations are ranked according to the severity of occurrence. Audit studies were conducted at black-spot locations for accomplishing advanced measures to diminish the causes of road accidents.
In India, the highest number of fatal road crashes occurred on the National Highways accounted for 32.6% of fatalities, followed by State Highways (27.8%) for various reasons (NCRB, 2014). Understanding 'the random nature of crash process' on highway segments is of utmost importance as this can pave way for timely interventions to save precious lives. In this context, a study was conducted on NH 44 from Suchitra to Tupran for about 40 km length in Hyderabad city of Telangana State. It was observed that 802 crashes have occurred during the last 5 year period on this highway. The traffic on the highways is generally heterogeneous. The present study stretch on the highway has peculiarly high number of crashes which are termed as blackspots. Blackspots lead to decrease in the level of service of the highway. In order to improve the safety and service quality of the highways, these blackspots must be identified and dealt using appropriate rectifications. This paper attempts to identify the black spot locations and conduct an audit study to recognise the causative factors that influence the collision pattern for occurrence of the crash on this highway.
With the aim of identifying the blackspot locations of the considered study stretch on the highway, the following objectives were outlined.
Crash data was collected from a secondary source which assists in identifying the hazardous locations on the highway. Black spot identification was carried out based on the obtained crash data which includes the classification of accidents for calculating the severity value using accident severity method.
Most of the research by several authors was aimed on Road Safety management. Very few have worked in identification of black spots for the development of road safety by refining geometrical parameters. Mahal et al. (1978) defined black-spots as those sites whose accident frequency is significantly higher than estimated at recommended level of significance. Hauer (1997) had arranged ranking by accident rate and accident frequency method. Frequency, severity, and accident rate were used to classify the black-spot locations. Mandloi and Gupta (2003) have defined accident-prone locations which are commonly labelled as accident black spots using a Geographic Information System (GIS). Mustakim et al. (2008) had established an accident prediction model using Multiple Linear Regression. Krishnamurthy et al. (2011) had engrossed on accident frequency and severity index methods to locate accident black-spots and ranked them by frequency and severity values. Ramesh and Kumar (2011) explained the current road safety level in Hyderabad city. Multinomial regression analysis was carried for analysing accident prediction model. Black spots were also identified using statistical methods. Huayun Chen (2012) has discussed on the use of geo-coding and VRSGPS positioning technology for recording traffic accidents. Sadeghi et al. (2013) had described on identification and ranking of Accident-Prone Sections (APSs) which was based on efficiency concept to highlight accidents. Gregoriades and Mouskes (2013) had engrossed on Bayesian Networks with Dynamic Traffic Assignment-based simulator and Visual Interactive Systems, Accident Risk Index (ARI) was used for identifying accident black spots on road networks. Isen et al. (2013) had discussed on identification of accident locations using Geographic Information System (GIS). Evaluation was supported through Weighted Severity Index (WSI) method and compatibly ranked accident locations. Goran Zovak et al. (2014) had proposed that the evaluation methods do not take the parameter of density of traffic in black spots, which exhibits effective consequences and benefit in the ranking of dangerous places and concluded that the present methodology can be used for local roads and not suitable for urban areas. Goel and Sachdeva (2014) has made an attempt for ranking the black-spot using accident severity value. Leelakajonjit et al. (2014) had attempted to study the road safety management system and proposed a better method to identify black spots. Niveditha et al. (2015) explained that logit models are suitable for prediction of the crash. The results explain that shoulder condition is an affecting factor for the occurrence of non-fatal crashes in the city. Sorate et al. (2015) had used a method of ranking and severity index, weighted severity index, and an accident density method to identify black spots. Snehal et al. (2016) have identified black spots on Pune-Bangalore National Highway using Weighted Severity Index and Accidental Density Method.
Most of the studies have attempted on identifying black spots by using Accident Rate method, Accident Severity method, Accident Density method, Severity-Rate method, Frequency Rate method, Accident Frequency method, Rate-Quality-Control method, Empirical Bayes method, Safety Indices method, Cluster analysis and Regression model, etc. Very few studies, particularly the city of Hyderabad was carried out in identification and providing measures for reduction of road accidents at black-spot locations. In the present study, an attempt is made for the identification of the black-spot location using Accident Severity method. Audit studies were also conducted on highly ranked black-spot locations.
In the present study, Accident Severity method is used to identify blackspots in the stretch considered.
The procedure adopted for identification of black spots is as following.
Critical severity values and severity values help in determining the ranking for blackspots in Accident severity approach. This process includes the following steps.
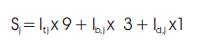
The severity value for road section number j is
where,
Sj = Severity value per an accident.
If,j = Number of fatalities per an accident.
Ib,j = Number of injured persons per accident.
Id,j = Number of damaged vehicles per accident.
The relative severity value is then  , which means
severity per accident.
, which means
severity per accident.
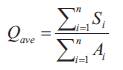
Aj= Number of accidents on section j during a certain time j period.
The average value is estimated with:
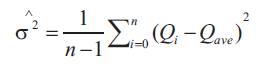
and the variance σ2 is estimated with:
The road section is considered to be a black spot, from the severity point of view, if:
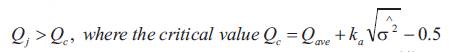
Thus, if the severity value (Qj) is greater than critical value (Qc ) then it can be considered as a blackspot.
Crash data was collected on National Highway 44 (NH 44) for a 5 year period (2011–15) along the study stretch. The length of study stretch is 40 km from Suchitra X-road to Tupran of Telangana State as it is shown in Figure 1.
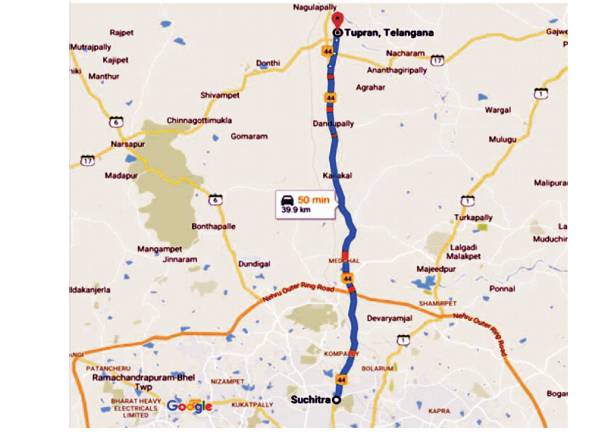
Figure 1. Study Location for Crash Analysis
The data is summarised according to the crash characteristics and represented in Table 1. In each of the crashes occurred fatalities and non-fatalities are observed in Table 2. The data collected over the highway stretch was divided into 10 divisions based on the kilometer range. The severity values for the road section and critical severity value are calculated. The severity values are compared to the critical severity values for determining blackspots. The calculated critical severity values for five consecutive years along with their ranking are tabulated in Table 3. The segment from kilometre range 378 to 407 is ranked as the top section for critical severity value.
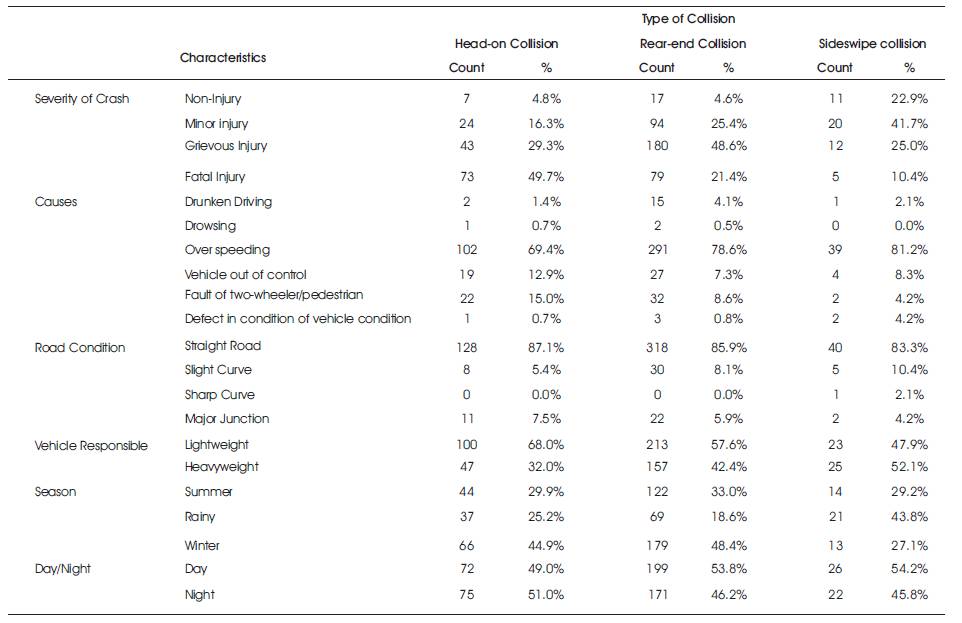
Table 1. Summary of Crash Characteristics
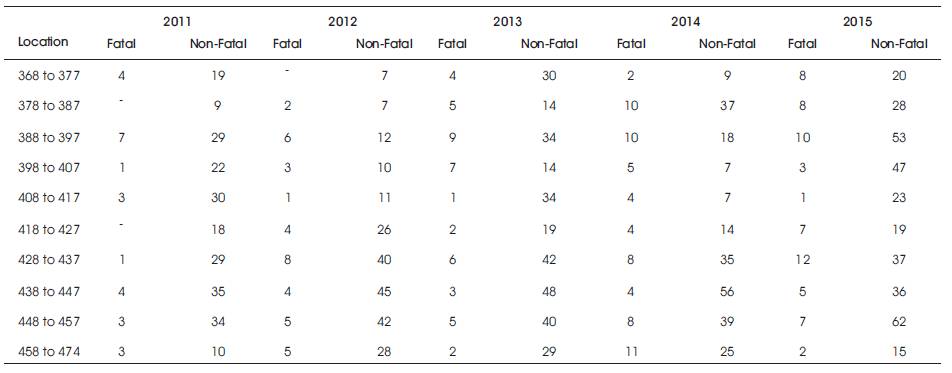
Table 2. Year and Location-wise Accidents
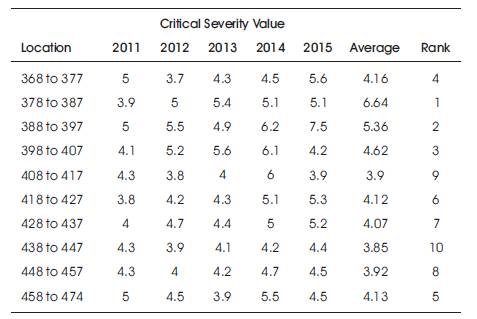
Table 3. Severity Values and Ranking Black Spots
A graph is plotted for the location and average critical severity as shown in Figure 2, which shows a similar curve at these locations. Accident data for and the study stretch Hyderabad city are also tabulated in Tables 4 and 5, respectively.
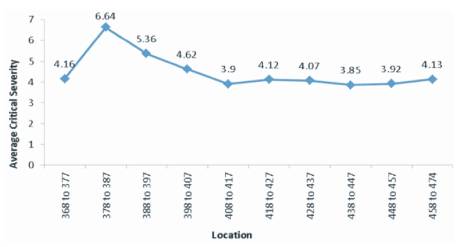
Figure 2. Location versus Average Critical Severity Graph
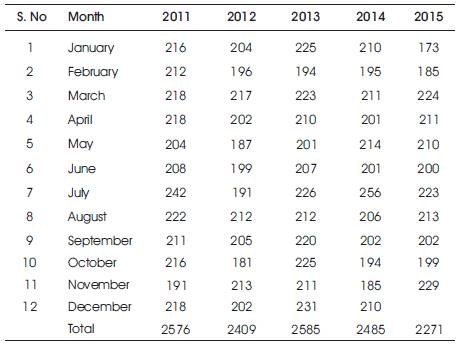
Table 4. Accident Data for the Years 2011 to 2015 (up to November, 2015), Hyderabad City
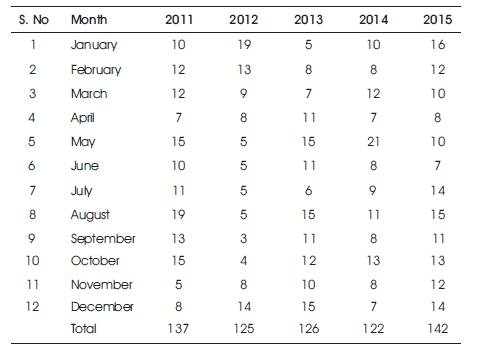
Table 5. Accident Data for the Years 2011 to 2015, Suchitra X-road to Tupran
Ranking of the black spots aid in organizing the enhancement programs. It helps to assess the location that requires immediate consideration. Using Accident severity method, the severity index at all locations along the study stretch are calculated and black-spots are listed in descending order of severity. Audit studies were conducted at the black spot locations and remedial measures were proposed. The corrective measures suggested were providing sign boards, installation of cat eyes and road reflectors, providing road humps before the junction, improving sight distance at the junction by increasing set back distance at the junction, providing delineators and retro- reflective markers, curve indicators, etc.
Audit studies were steered along the study stretch for observing the crash causative factors. Volume, speed, and geometric surveys were carried out at black-spot locations. Deteriorated road, improper shoulder and median, vehicles parked on the carriage way, narrowed road conditions, lack of proper visibility of signboards were witnessed along the highway at various places.
Rehabilitation works are required for smooth traffic flow which is shown in Figure 3. Severe rutting on the highway at Medchal and improper drainage caused road swamp which leads to trouble for vehiculars.
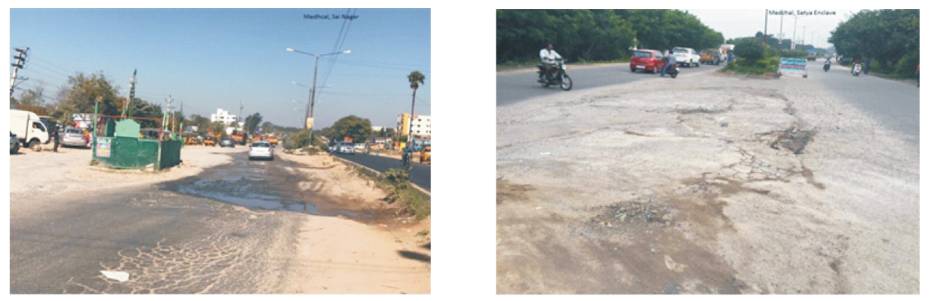
Figure 3. Deteriorated Road Conditions
Median cut must be closed to avoid crossings and prevent accidents. Temporarily proper sign board must be installed. Autos and other vehicles crossing the pavement at unauthorised median gaps are shown in Figure 4.
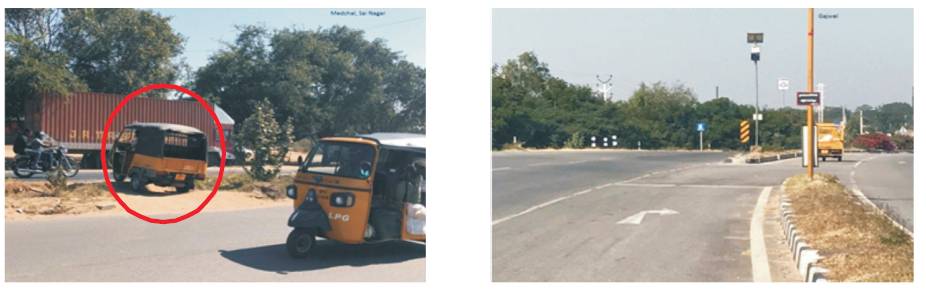
Figure 4. Unauthorised Median Opening
Shoulder must be constructed to avoid soil on to the carriageway as shown in Figure 5. It was observed that soil was poured onto the carriageway at many locations in the highway. This may lead to skidding of vehicles moving on the pavement. Shoulders must be constructed to avoid soil on to the carriageway.
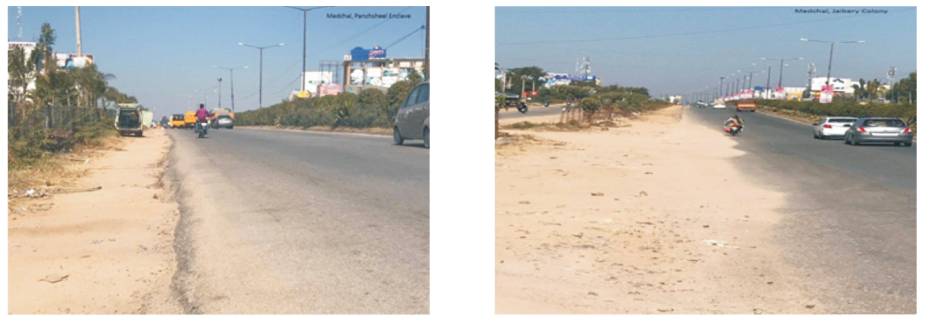
Figure 5. Improper Shoulder
Sign board must be installed to indicate narrowing of the pavement as shown in Figure 6.
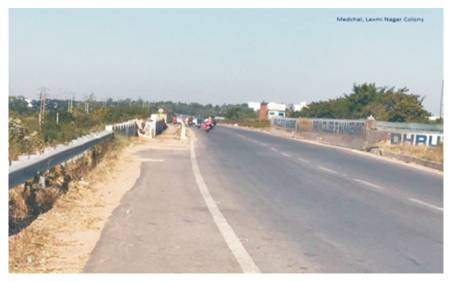
Figure 6. Narrowed Road
Footpaths must be constructed to curb pedestrians from walking on the carriageway as shown in Figure 7. Footpaths were absent in most locations where the highway passes through small villages and towns which compels the pedestrians to walk on highway.
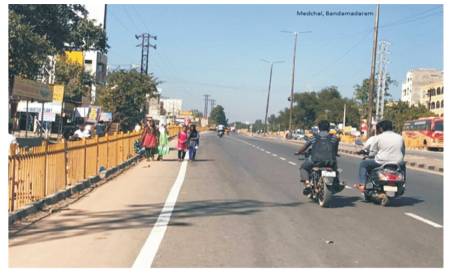
Figure 7. Pedestrians Walking on Highway
Unauthorised parking on the carriageway must be condemned. Truck lay-bys must be used for parking by the highway as shown in Figure 8. Unauthorised parking was observed along the carriageway which causes traffic inconvenience.
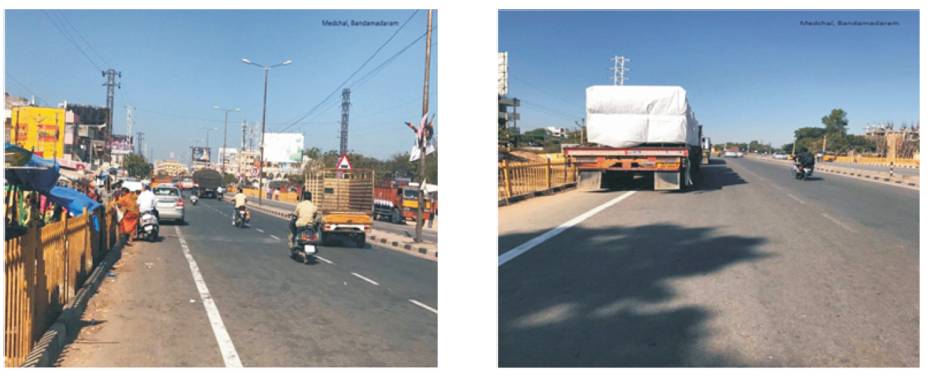
Figure 8. Vehicles Parked along Highway
Punctual maintenance must be conducted to ensure proper visibility of sign boards as shown in Figure 9. Vegetation along the highway must be properly trimmed to avoid covering up the sign boards.
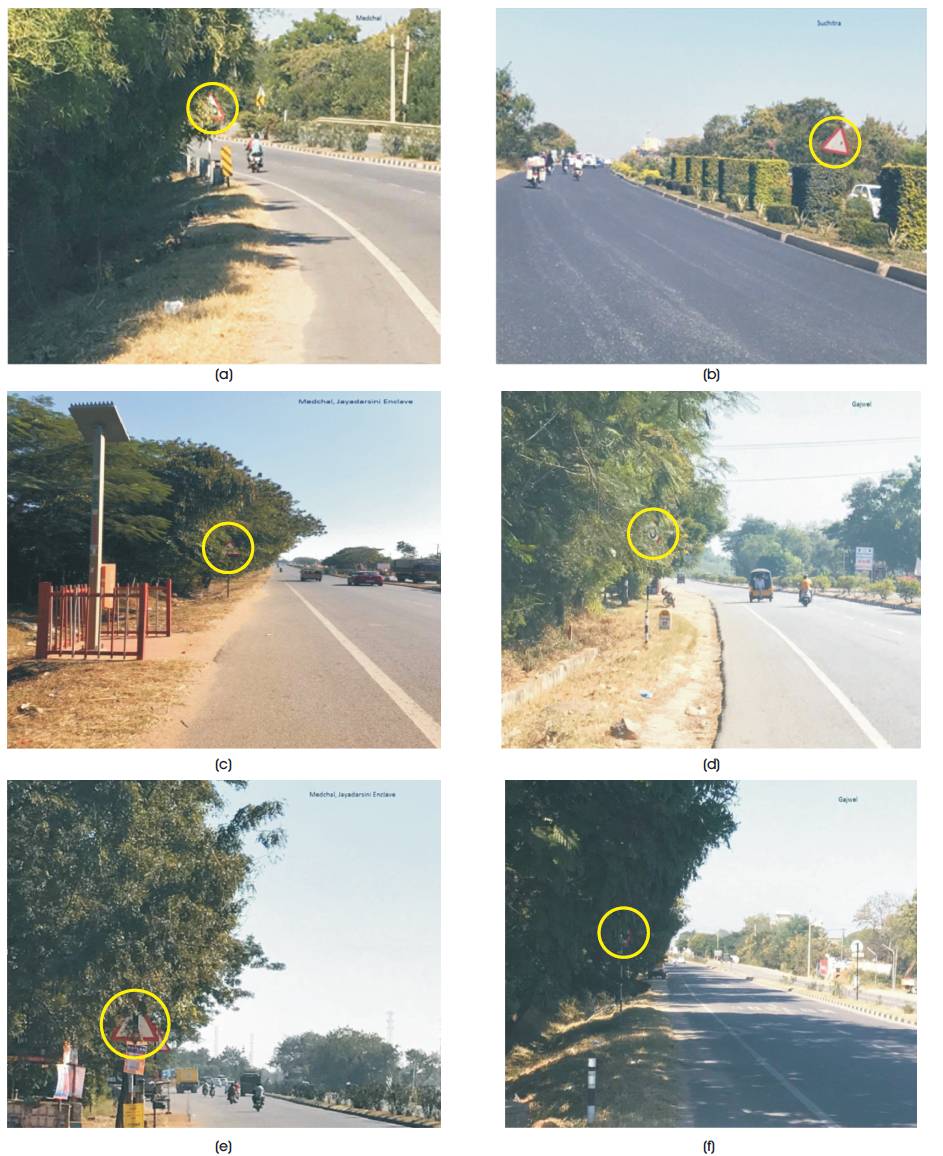
Figure 9 (a-f). Improper Sign Board Visibility
Geometrical improvements at most of the major junctions are not started due to limitations and some are in progress. Grading and linking of minor arms to project road are incomplete at many intersections. Lane Marking and setting up of cat eyes is yet to be done in all junctions. Object / hazard markers should be placed to warn the drivers in advance.
Lane marking, stop line marking, directional arrows, pedestrian markings, etc., need to be done in all the junctions. Stop signs must be properly set up on minor arms and shall be aligned perpendicularly to face the approaching traffic.
Speed limit sign boards and informatory sign boards ought to be installed at merging and diverging lanes of service roads, major junctions, petrol pumps, and hospitals. Cat eyes shall be provided along centre and edge line of all horizontal curves. Hazard markers shall be made available for channelizing and divisional islands at all major junctions and median openings. All signs must be provided as a reflectorized type.
Adequate lighting arrangement should be provided on roads in town limits. All major and minor junctions of the highway must be facilitated with high mast lighting arrangement for safe movement of vehicular traffic and pedestrians.
Lane marking was done in majority of road sections. Pedestrian cross marking at school, hospital, town/village limits, bus bays have to be carried out for safe movement of pedestrians.
Pedestrian guardrail shall be provided at the places where pedestrian activity is high and on raised foot path on the side of carriageway at bus stops and bus bays for adequate length. Raised foot path needs to be provided in town and village areas for safety of pedestrians.
Informatory sign boards shall be fixed ahead of the bus bay and truck lay-bys.
As per IRC specification, it is vital to deliver road hump with required sign boards on minor arms at a distance of 10 m from the edge of main carriageway to control the speed of vehicles entering the highway. Highway must be fenced to prevent cattle from entering the highway which causes major crashes.
Soil is poured on to carriage way due to improper shoulder condition. This needs to be resolved. Excessive filling in medians have led to spilling over of soil on to the carriageway in some of the stretches.
Service Roads are to be raised in habitant zones which are yet to be accomplished in the some stretches. Appropriate hazard marking at the start and end of Service Roads should be provided before merging or diverging. Road signs must also be mounted at all widening locations. Proper chevron marking has to be provided at the start of separator between Main Highway and Service Road.
Authentic drain must be provided in Urban Areas / Service Roads. These drains ought to be covered to confirm safety of the pedestrian.
The identification of black spots assists in analysing the stretches where accidents are historically concentrated. In this research, black-spots are diagnosed using Accident Severity Method and audit studies were performed to find out the deficits of road related aspects. Km ranges 378 to 387, 388 to 397, and 398 to 407 were found to be the top black spot areas with respect to Accident Severity Method and ranked as 1, 2, and 3, respectively.
From the audit study conducted through preliminary site surveys, improper sign board visibility, improper shoulder conditions, unauthorised median openings, and vehicles parked along the highway were some of the faults observed along the considered study area. Restoration and rehabilitation of these defects will help to mitigate many hazards.