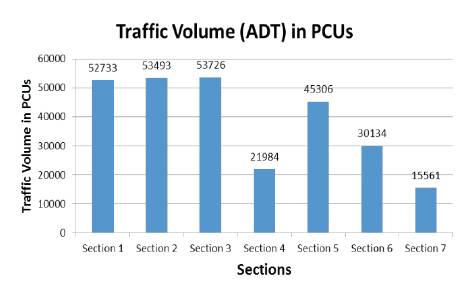
Figure 1. Traffic Volume (ADT) in PCUs for the Different Sections
Road Safety Audit is a formal procedure for assessing accident potential and safety performance of new and existing roads. Road safety Audit is an efficient, cost effective and proactive approach to improve road safety and it has potential to save lives. The frequency of traffic collision in India is amongst the highest in the world. In 2015, one person dies every 4 minutes in road accidents in India. The objective of the study is to present some basic concepts of Road safety Audit for the major roads in Bengaluru in the state of Karnataka in India. The numbers of road accidents in Bengaluru are about 10% of the total accidents in Karnataka. Hence, there is a requirement of Road Safety Audit to reduce the accidents. The Road Safety Audit is aimed at reducing the injuries, fatalities, deaths, etc., due to road accidents. In order to develop road safety measures, it is required to collect accidents’ data, traffic volume data, and analyzing the data to identify the Black Spots and ranking the black spots based on the deficiencies of safety measures and identify most accident prone location by Equivalent Property Damage Method (EPDO). At black spots, the cause for the accident is identified and remedial measures are proposed to reduce the fatality and the number of accidents. After conducting the Road Safety Audit, it is found that the vehicles parked on road side reduces the effective width of road and affect the fast moving traffic, and the location of bus stop also affect the traffic. Along with this, the road geometry and the poor sign boards will also affect the safety measure.
According to the World Health Organization (WHO), road traffic injuries caused an estimated 1.24 million deaths worldwide in the year 2010, slightly down from 1.26 million in 2000. That is one person is killed for every 25 seconds. The average rate was 18 per 100,000 people in 2010, down from 20.8 in 2000. Half of the world's traffic deaths occur among motorcyclists (23%), pedestrians (22%), cyclists (5%), car occupants (31%), and remaining 19% among unspecified road users.
India has a road network over 4,885,000 km in 2014 (i.e), the second largest road network in the world. According to the report prepared by the ministry's Transport Research Wing (TRW), the total number of road crashes has increased marginally from 4.86 lakh in 2013 to 4.89 lakh in 2014. The number of fatalities has also gone up by about 1.5%. Statistics with the National crime Records Bureau indicates that atleast 23 people die every day in Karnataka out of which five are in Bangalore. Statistics further reveal that in the year 2006, there were 43,280 accidents and in the year 2007, the figure rose to 45,284. In 2007, there were 18,663 deaths in the state while in Bangalore alone there were 11,663 deaths.
Bangalore contributes 10.2% of total accidents in Karnataka. In Bangalore, nearly 1.24 million deaths take place every year. In total number of accidents, the people dying were young people with age between 15-29 years. In Bangalore about 47% of road users killed are pedestrians & 40% are two-wheeler users. In addition to this, annually more than Rs 1550 crores are paid as compensation to the victims & their dependents.
George Kanellaidis [1] has studied and given prominence to the human factor causing accidents. He had considered two areas, (i.e) Effect of highway design on driver behavior and Consideration of driver behavior variability. He had suggested the following;
Important steps in developing such a framework include:
Lokesh Hebbani [2] has studied and discussed about accident scenario in India. A detailed study has been made on the preventive steps taken by state governments and the central government like:
Using these preventive measures the accident rate can be minimized.
Arun S Bagi and Dheeraj N kumar [3] have done a case study on Banerghatta stretch. The main emphasis was done on the following data.
The following were the recommendations given:
These stretches need geometric improvement, pavement resurfacing, etc., and studies are to be conducted for economic and financial evaluation.
Atul Kumar [4] has worked on the technical and geometrics of the road high accidents due to inadequate engineering measures. The main study areas are Geometry of the road, Segregation of local traffic, Pedestrian facility, Bus bays, Illuminations, Development of Junction, Signage, Traffic calming & Safety Management Measures, Bridges/CD structures & Road Safety Audit. Based on this report, the following recommendations were taken by the government of India during the 12th Five Year Plan, the Government has incorporated road safety audits as well as training of both engineers and road safety auditors as part of its strategy to design safer roads.
Nishi Mittal [5] has done a case study on pedestrian safety on roads. He had taken 5 intersections as an effort to study the safety parameters for pedestrians. The pedestrian volume data were collected at these intersections and pedestrian accident data was also taken. Based on this data collected, the author gave recommendations at each junctions. Some of the recommendations provided were to provide pedestrian friendly sidewalks, considering providing zebra markings wherever absent and maintain at worn out places and to provide signalized left turn in coordination with the other movements.
G Patel [6] et al. have done a case study on the road safety audit of the stretch which extends from Umreth junction to Vasad junction (Gujurat). The stretch also covers the busy state highways, namely SH-83 and SH-188. The following observations were made; Road Inventory and surrounding land use pattern, Classified Volume Count & Accident Data from Police Stations. They came across many problems which were responsible for accidents and they gave recommendations which were useful in curbing the accident rate. This was lauded by the state government as it was a matter of great concern for the public as well
It is a general study done by Morgan [7] to check the quality of road practices back in Australia and New Zealand. They compared the existing road feature and standard features.
They came across many faulty measures which needed immediate attention. They gave recommendations which would help in decreasing the number of accidents.
Mazhar Sayed and Sumedh Mhaske [8] is a classic case wherein technology has been used for effective study of road safety and its characteristics. They conducted the study on the stretch NH-17 for about 3 km from Panvel and Indapur. Since, they made use of the software "Gram ++", the whole study was done in a small amount of time and was much more effective than the conventional study. We can say that this is first of its kind and some more advancement in this regard will help us in making the study simpler and more effective.
S.S. Jain et al., [9] have dealt with the study conducted by the professors of IIT (Roorkee) on a National Highway 48. The highway was a four lane highway, wherein there was enormous movement of heavy moving vehicles. Here, the width of the carriageway was reduced due to parking of these vehicles. This resulted in accidents of speed vehicles and there was also illegal median opening which was a very serious problem. The professors recommended the closure of these illegal opening and they also recommended for the provision of parking bays for the heavy moving vehicles.
Geetam Tiwari et al., [10] gave a presentation at a national level conference regarding road safety auditing. They highlighted the errors which were in the checklist which was recommended by IRC. These recommendations given have very tedious processes and needed more of the technical assistance which resulted in being a very costly process. The IRC has taken a note of this and has appreciated the work done by these scholars.
A systemic road safety audit is the identification of a set of remedial measures, to be implemented on different sections in the road network to reduce the injuries, fatalities, deaths and loss of public properties because of road accidents. A framework proposed for formulation of road safety audit for the major road networks in Bengaluru.
Stage 1: Site selection for the study area.
Stage 2: Collecting the accident data and traffic data.
Stage 3: Analysis and Ranking the Sections .
Stage 4: Ranking the sections by road side furniture and by the conditions of road.
Stage 5: Preparing the checklist as per IRC.
Stage 6: Suggesting the remedial measures.
A suitable site is selected, where the accident rate is more and geometrics are very poor. The study area may be newly constructed or the existing old road network. The location map, terrain map and route maps are also collected.
For the Road Safety Audit, the selected stretches were,
Section 1: Kengeri Bus stop to University gate.
Section 2: University Gate to R. R. Nagara Gate.
Section 3: R. R. Nagara Gate to Nayandahalli.
Section 4: Uttarahalli Main Road.
Section 5: R. R. Nagara Main Road.
Section 6: K. S. T. Main Road.
Section 7: NICE Link Road.
The geometric features and the pavement conditions for all the section of roads were collected.
The traffic data for seven continuous days were collected to calculate the Average Daily Traffic (ADT) for all section of roads. The ADT for all the section of roads were represented in Figure 1.
Figure 1. Traffic Volume (ADT) in PCUs for the Different Sections
Accident data were collected from the nearby police station for all section of roads for 7 years for the analysis. The average accident rates were shown in Table 1.
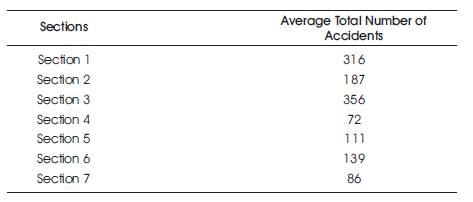
Table 1. Average Total Number of Accidents for Different Sections
After collecting the accident datas from respective police stations; the datas were analyzed using Equivalent Property Damage Only (EPDO) Method. The EPDO Method takes into account of total number of crashes at a location and the severity of each crash. This system was currently used by Mass Highway in its development of the Top 1000 Crash Locations in the State of Massachusetts.
The EPDO method is a system of ranking intersections in terms of safety. The system is point based with different types of crashes receiving different point values. The rankings are as follows:
The average EPDO value and the Ranking of the sections are represented in Table 2.
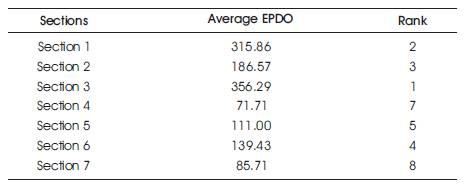
Table 2. Average EPDO and the Rank for Different Sections
The pavement condition survey, road geometry, condition of sign boards, their locations and the availability of the carriage way width, and the sections of roads were ranked based on the safety of road users. It also includes the number of sign boards installed, their sign post condition, reflectors and road markings. Depending on these safety furniture, sections are ranked. Rank 1 represents that the section is safer for the road users at the design speed. Table 3 shows the rank of the road sections based on the availability of road side furniture.
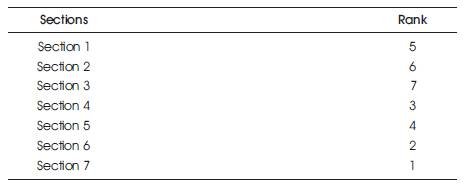
Table 3. Ranking for the Road Sections Depending on the Availability of Road Side Furniture
An audit list is prepared in order to help an auditor not to overlook something important [11]. This checklist helps an Auditor or a Designer in identifying potential safety problems and knows the types of issues an auditor will address. Using the accident records obtained from Police, accident spots are ranked with the help of Equivalent Property Damage Only (E.P.D.O). It is easier and accurate to assess the damage caused to a property (i.e., vehicles, building) rather than the damage caused to human being. With this, data obtained from the Police does not give a detailed accident record, it only gives the type of accident (i.e., Fatal, Injury, and Property damage) and the number of accident that occurred in a period of seven years. In the method of Equivalent property damage, only the accidents are classified as Fatal, Injury, and Property damage according to the severity.
After ranking the accident spots by E.P.D.O, the individual accident spots were inspected for the safety problems using the Audit list, and counter measures are suggested to reduce the accident rate or to minimize the severity of the accident.
To answer the individual questions of the checklist, the authors have devised a new methodology: Three grades (A, B, C) were given as an answer to the respective question.
Grade represents the best possible scenario at the junction. If a question gets its answer A, it represents that the facilities present over there are near to perfection.
Grade B represents a mediocre scenario. It represent the stage between the best possible conditions and the worst possible conditions.
Grade C is a worst possible grade that a question in checklist can get as an answer. It represents that the conditions at the junction are really bad and they need immediate attention.
Table 4 shows the percent of grades for all the sections.
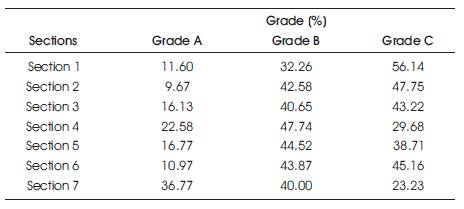
Table 4. Percent of Grades for All the Sections
Depending on the ranking of the sections and the checklist, the general observations and the suggested remedial measures are listed below separately.
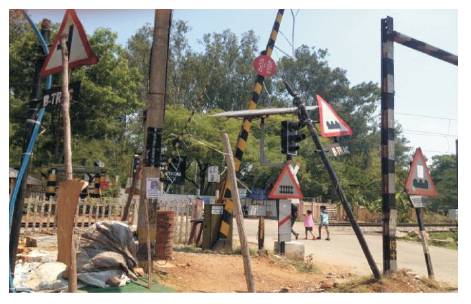
Figure 2. Poor Visibility and too much Sign Boards at Railway Gate, Mysore Road
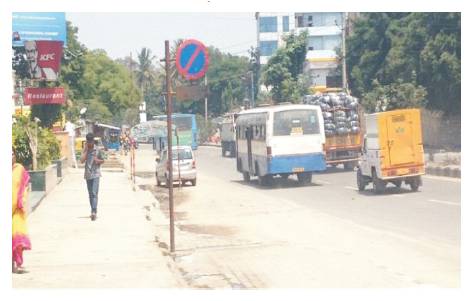
Figure 3. Wrongly Placed ‘No Parking Sign’ Board Near Gopalan Arch Mall, Mysore Rood
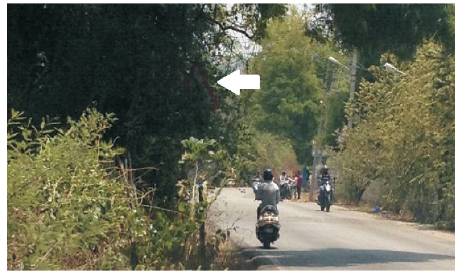
Figure 4. Poor Visibility of Sign Board, Uttarahalli Main Road
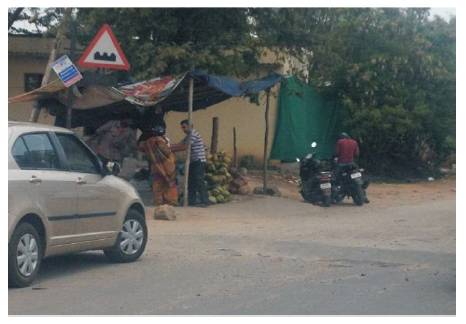
Figure 5. Faulty Location of Sign Board and Poor Condition, Uttarahalli Main Road
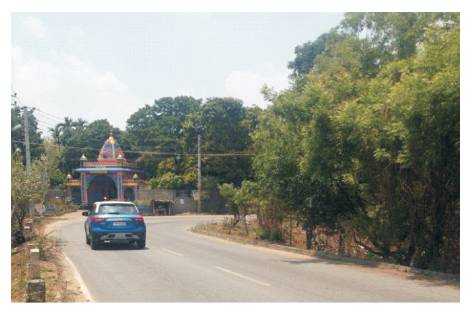
Figure 6. Sharp Curve Without Warning Sign Board and Poor Visibility, Uttarahalli Main Road
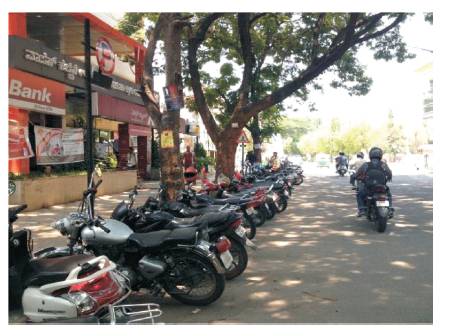
Figure 7. Vehicles are Parked at ‘No Parking’ area, R. R. Nagara Main Road
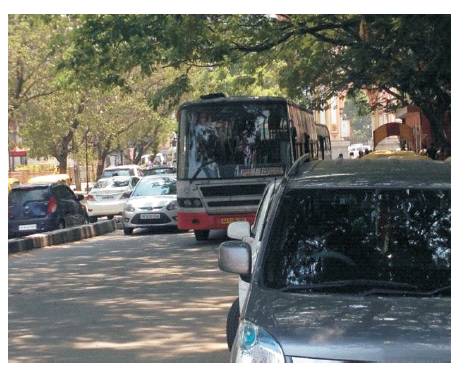
Figure 8. Faulty Location of Bus Stop Interfering Normal Moment of Traffic, R. R. Nagara Main Road
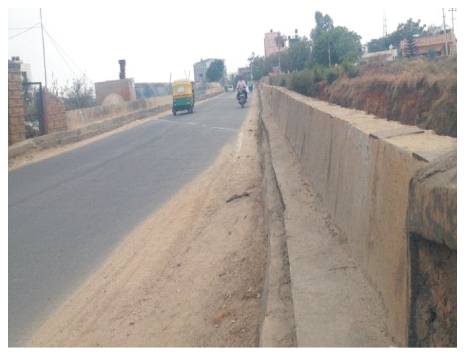
Figure 9. Major Bridge Without Pedestrian Facility, KST Main Road
Common identified problems are
This report attempts to contribute to the knowledge on road safety. It is hoped that it will inspire and facilitate increased cooperation, innovation and commitment to preventing road traffic crashes around the world. Road traffic crashes are predictable and therefore preventable. In order to combat the problem, though, there need to be a close coordination and collaboration, using a holistic and integrated approach, across many sectors and many disciplines. The number of road accidents can be minimized and can save lives by educating people and taking the preventive measures by the related authority.