Figure 1. Land Use Land Cover Classification for December 2000
Land Use/Land Cover (LU/LC) change detection was performed in the Solani river watershed area using multi-temporal remote sensing images (Landsat 8 ETM+ image of year 2014 and Landsat 8 Operational Land Imager/Thermal Infrared Sensor (OLI/TIRS) image of year 2021). Image classification and change detection were carried out for both images using Arc Geographic Information System (GIS) 10.1 and Earth Resources Data Analysis System (ERDAS) Imagine 2016 software. High-resolution Google Earth imagery and Land Remote-Sensing Satellite (LANDSAT) images were used for the accuracy assessment of the classification. The results showed major increments of agricultural fallow land and build-up land of 25.19% and 20.69%, respectively, with the highest decrease in forest cover of 29.27%. Also, to analyze the impact of varying spatial resolution on the Topographic Wetness Index (TWI), two digital elevation models (DEMs) of different spatial resolutions (SRTM, 90m, and Cartosat, 30 m) were used. The results of the study indicated that the mean TWI value increases with an increase in grid size.
After it was discovered that Land Use and Land Cover (LU/LC) change is responsible for environmental changes, it rose to prominence in the research field. Though the terms land use and land cover are frequently used interchangeably, they are different in the sense that land cover highlights the physical surface cover of land such as water bodies, forested areas, agricultural lands, plantations, barren land, fallow land, etc. (Rawat & Kumar, 2015; Chowdhury et al., 2021). On the other hand, land use represents how the land is being used or managed by people for development purposes such as irrigation, conservation, recreational uses, and others (Patel et al., 2019). Land cover change thus represents any modification to the land surface characteristics, such as changes in vegetation or soil conditions, and land use change denotes changes made to the usage of land area by humans (Verma et al., 2020). The current study attempted to delineate and analyze land use and land cover changes in the Solani River watershed of Uttarakhand, as well as the effects of varying spatial resolution of digital elevation models on TWI.
Land use and land cover change has become a central component in current strategies for managing natural resources and monitoring environmental change. The rapid development of the concept of vegetation mapping has led to increased studies of land use and land cover change worldwide (Saah et al., 2019). Although the terms 'Land Use' and 'Land Cover' are often used interchangeably, their actual meanings are quite distinct (Andualem et al., 2018). 'Land Use' refers to human activities that take place on the earth's surface (Imbernon, 1999). How the land is being used, such as residential housing or agricultural cropping (Mamun et al., 2018). 'Land Cover' refers to the natural or man-made physical properties of the land surface.
Land use and land cover patterns are dynamic and keep on changing with time (Yu et al., 2007). Land cover changes may occur due to natural factors and include water bodies, grassland, snow, forest and bare soil (Mallupattu & Reddy, 2013). Land use changes occur due to anthropogenic activities including rock blasting, river bank construction, deforestation, agriculture etc (Thakur et al., 2020). For socio-economic development Topographic Wetness Index (TWI) are used for modeling various landscape properties. TWI can be used to quantify the impact of topography on hydrological phenomenon in the study region and can be defined as ln(a/tanb), where a represents upstream contributing area and b represents the slope raster (Sörensen et al., 2006).
Rawat and Kumar (2015) study illustrates the spatiotemporal dynamics of land use and cover in the Hawalbagh block of district Almora, Uttarakhand, India. Landsat satellite images of two different time periods, i.e., Landsat Thematic Mapper (TM) images of 1990 and 2010, were acquired by the Global Land Cover Facility Site (GLCF) and the Earth Explorer Site, and quantified the changes in the Hawalbagh block from 1990 to 2010 over a period of 20 years.
Chowdhury et al. (2021) mention that the quantification of Land Use and Land Cover (LULC) changes associated with energy extraction footprints plays an important role in reclamation performance assessment, compliance monitoring, and sustainable land management practices. For regulatory planning and decision-making purposes, it is crucial to understand the types and representation of disturbances present on the landscape related to energy footprint.
Patel et al. (2019) depict a distinct shift from agriculture, as a primary economic activity, towards non-agricultural pursuits. In order to frame better strategies for sustainable development and food security, this phenomenon of increasing urbanization around cities needs to be studied. This micro-scale study can be helpful in formulating policy for urban areas in developing countries like India, which heavily depend on agriculture to sustain their population and economy.
Verma et al. (2020) report that advances in urban ecology have been integrated with emerging fields from an ecological and environmental as well as a humancentric perspective, particularly governance, economics, social-ecological systems, the urban boundary, the impact of urbanization on climate change and human health, and sustainable cities.
Weng (2001) report an investigation into the application of the integration of remote sensing and Geographic Information Systems (GIS) for detecting urban growth and assessing its impact on surface temperature in the region. Remote sensing techniques were used to carry out land use and cover change detection by using multi-temporal Landsat thematic mapper data.
The research was conducted for the Solani river watershed, which is located between 29.87 and 30.27 degrees latitude and 77.73 and 78.22 degrees longitude, with elevations ranging from 250 to 915 meters. The watershed is shared by Uttarakhand and Uttar Pradesh, both states in India. The average temperature in the area ranges between 20 and 40 degrees Celsius and is marked by a sub-tropical monsoon type of climate. Rainfall in the region usually starts in July and goes on until October. The total annual rainfall ranges from 1200 to 1500 mm. The Solani watershed covers an approximate area of 530 km2.
The area is mostly made up of quaternary and upper to pliocene alluvium. A cyclic sequence of grey micaceous sand, silt, and clay of fine to coarse grain sizes is present. The area has dense forests, water, agricultural land, wasteland, and urban land as its main land use land cover classes.
Two multi-temporal images of Landsat5 TM in December 2000 and Landsat8 ETM+ in December 2014 were freely available on the USGS website and used for LULC analysis. For ground truthing, high-resolution Google Earth imagery of the area (provided by the National Institute of Hydrology, Roorkee) was used. The same images were used for the accuracy assessment of the classification.
TWI analysis of the area was performed using the Space Radar Topographic Mission (SRTM) Digital Elevation Model (DEM) downloaded from the USGS website and the Cartosat-3 arc DEM downloaded from the Bhuvan website. SRTM has a spatial resolution of 90 m, while Cartosat has a spatial resolution of 30 m.
The maximum likelihood supervised image classification technique was used for producing thematic maps with LULC classes. For better accuracy of classification, training sets were marked using the swipe tool between Google Earth imagery and Landsat images. These training sets having 10 training sets for each class were saved as a signature file, which was used for the supervised classification. Five major LU/LC classes were defined, including forest land, water bodies, built-up land, agricultural fallow land, and agricultural crop land.
Accuracy assessment was carried out by marking reference samples which is at least 50 points for each class. These points were used for generating a confusion matrix comparing the actual class and classified class of the pixels.
TWI was calculated for different spatial resolutions, SRTM DEM for 90m spatial resolution and Cartosat-3arc for 30m spatial resolution.
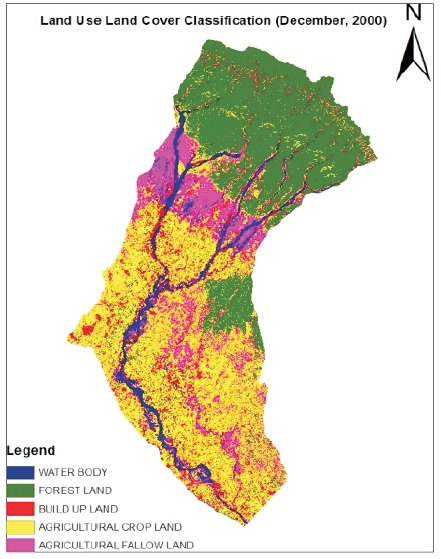
Changes in land use and land cover were detected in the area using land use and land cover maps created through the supervised classification of LANDSAT images between 2000 and 2014 (Saah et al., 2019). The classification results were validated through accuracy testing. The changes in the land use classes were calculated for both 2000 and 2014, and the percent change observed was recorded. Figure 1 shows the land use/land cover classification in December 2000. In this map, the water body, forest land, buildup land, agricultural crop land, and agricultural fallow land are all marked with color differentiation. In this area, agricultural crop land covers a major area, with forest land considered the second-most followed by agricultural fallow land.
Figure 1. Land Use Land Cover Classification for December 2000
When considering the land use and land cover classification for December 2014, as shown in Figure 2, the water body, forest land, buildup land, agricultural crop land, and agricultural fallow land are all considered and all marked on the map with colour segmentation. Here also, agricultural crop land covers a major area, with forest land considered the second-most followed by agricultural fallow land. The only difference in this case is that forest land is consumed by agricultural fallow land as a major portion.
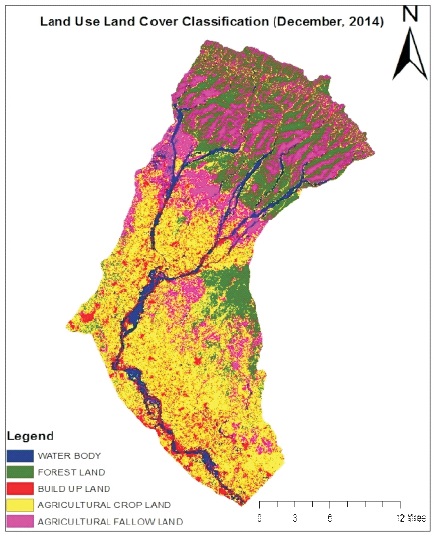
Figure 2. Land Use Land Cover Classification for December 2014
Overall classification accuracy for the year 2000 image is depicted in Figure 3. Here, the five samples are considered. For each sample, the accuracy percentage is obtained. From that percentage value, the average percentage for the year is attained and given as 84%.
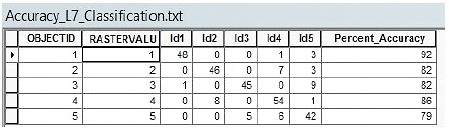
Figure 3. Overall Classification Accuracy in 2000
In this case, the five samples are taken into account in relation to the year 2014. For each sample, the accuracy percentage is obtained. From that percentage value, the average percentage for the year is attained and given as 82%. Overall classification accuracy for the year 2014 is depicted in Figure 4.
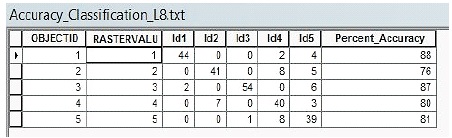
Figure 4. Overall Classification Accuracy in 2014
The calculated area under each land cover class in sq. km. and the percent change are summarised in Table 1. The results of change detection showed some interesting variations in the LU/LC of the area. LU/LC in the region was classified into 5 major classes, including forest land, water bodies, built-up land, agricultural crop land, and agricultural fallow land (Andualem et al., 2018). The results show an increasing trend in built-up land area and agricultural land, while water body coverage shows a decreasing trend. The drastic decrease in forest area and increase in agricultural fallow land also show significant degradation of forests. The forest area has decreased severely by 39.75 km2 while agricultural fallow land has increased by 29.09 km2.
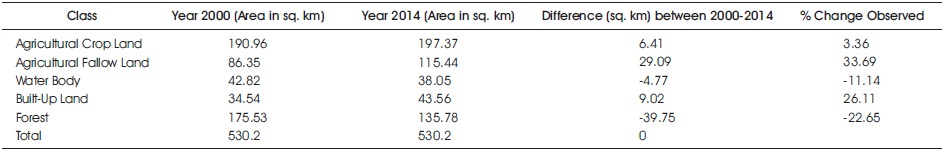
Table 1. Change Detection For Different Land Cover Classes
The effects of spatial resolution on the topographic wetness index were studied using a Space Radar Topographic Mission (SRTM) with a 90-m spatial resolution, as shown in Figure 5, with a high value of 21.75 and a low value of 4.83. The D8-flow algorithm was used for calculating TWI.
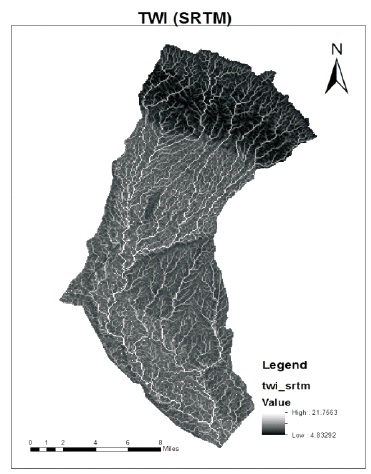
Figure 5. Topographic Wetness Index from Space Radar Topographic Mission
And for the consideration of a Cartosat with the 30 m spatial resolution digital elevation model, which is shown in Figure 6, comparing with the Space Radar Topographic Mission and Cartosat, more or less the same graph is obtained with slight variations in the white sparkles, with a high value of 21.7 and a low value of 2.98.
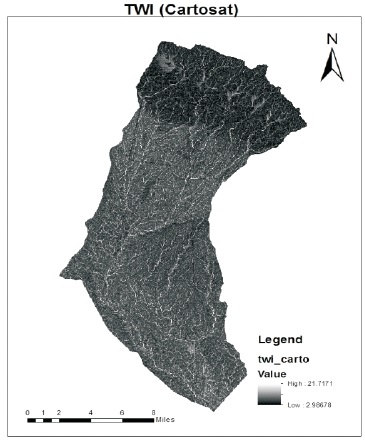
Figure 6. Topographic Wetness Index TWI from Cartosat
The different statistical parameters were observed for TWI calculated from both the low-resolution Space Radar Topographic Mission (SRTM) digital elevation model and the high-resolution Cartosat digital elevation model as shown in Figure 7. The histograms for twi_srtm and twi_carto are shown below, with the same minimum and maximum values as in Figures 5 and 6, and a mean value of 9.36 and 7.64, respectively, and standard deviations of 2.46 and 2.23.
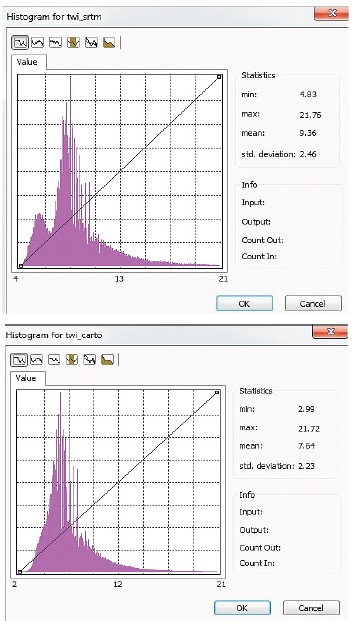
Figure 7. TWI Statistical Parameters from SRTM and Cartosat DEM
The variation in these parameters with varying digital elevation models (DEM) for SRTM with 90 m spatial resolution and CARTOSAT with 30 m spatial resolution is summarized in Table 2.
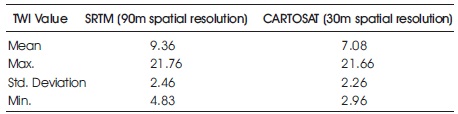
Table 2. Variation of TWI Statistical Parameters For Different Resolution DEM
The results reveal that the mean, maximum, minimum, and standard deviation values of TWI decreased with an increase in spatial resolution.
The present study highlights the efficacy of remote sensing and Geographic Information Systems (GIS) technology as a very useful tool for the measurement of land use and land cover changes. The results of the study showed an increasing trend in built-up area and a decreasing trend for the water bodies. The drastic decrease in forest area and increase in agricultural fallow land indicate significant forest degradation. The massive increase in deforestation as well as the reduction in water bodies in the area need adequate response from the environmental authorities to counter any ecological and environmental imbalances that the changing land use may incur. Thus, LU/LC change detections are very useful for future sustainable development, especially in developing countries like India. Analyses of the TWI on two different spatial resolutions namely 30m and 90m showed a significant difference between descriptive statistics, which included maximum, minimum, mean, and standard deviation values of the TWI. The small variations in TWI from different DEMs, however, do not give a clear picture of whether TWI generated from higher spatial resolution with the D8 flow algorithm will give essentially better results. The water body, especially seasonal streams, has shown little change due to encroachment by slum dwellers and land developers.