Figure 1. Schematic View of SFSI
This paper attempts to present a simplistic approach for estimating the effects of soil-foundation-structure-interaction (SFSI) for high-rise buildings constructed over different foundation conditions, to simulate the dynamic response of buildings comparatively with the fixed base condition. In this paper, a nonlinear time history and response spectrum analysis has been carried out using computer code SAP2000 while considering the soil-foundation flexibility to examine the variation in spectral acceleration (SA), spectral displacement (SD), storey displacement, storey drift, base shear obtained according to the seismic regulation in the Indian standard code. Various foundations has been consistently compared and discussed with respect to fixed base founded structure to amplify effects on seismic performance of high-rise building. The study illustrates that the value of base shear and storey displacement is increased with a significant increase in stiffness of superstructure and soil flexibility. It additionally founded that the spectral displacement (SD) and spectral acceleration (SA) are a better trend in the flexible base model with an isolated foundation on medium soil, which offers us evidence that spectral responses of a structure are related to soil condition and foundation types. We can infer that SFSI is relevant for tall buildings resting on medium soil.
Over the past forty years, extensive progress has been made in understanding the character of earthquakes and the way they could cause structural damages, and in improving the seismic performance of the constructed structure. However, many things remain unknown about the mitigation or prevention from the destructive earthquake worldwide. With the reference to some past and recent incidents of earthquakes, it is completely evident that the soil–structure-foundation-interaction (SFSI) effect plays a crucial role in deciding the behaviour of structures. The seismic excitation experienced will be considered as the function of the fault rupture mechanism, local site effects, travel path effects, and SFSI effects ( Gu, 2008). The native soil conditions can dramatically influence the earthquake motion from the bedrock level to the above-ground surface, through their dynamic filtering effects. For example, deep soft soil intensified below ground motion and modified the frequency of tremor in the 1985 Mexican capital earthquake.
The conventional trends in the analysis and designing of buildings usually implicate assumption of fixity at base of foundation ignoring the flexibility of foundation. This results in the compressibility of beneath soil and, subsequently, the consequences of the settlement of foundation. Further relocation of shear forces and bending moments demand leads toward the damages during seismic event. So, after getting such assumption, the consideration of SFSI in highrise buildings becomes necessary for the structure supported on the soft or medium soil. The motion of the underneath base of the structure is going to be completely different compared with the fixed base structure due to the coupling of the soil-structure system but consideration of the soil in the evaluation seismic responses of structure complicates the analysis process.
Wolf (1985) and Rahim et al. (2015) have noted that for structures designed on sturdy foundation like rock, throughout seismic excitation, the force generates within the overturning moment and the transfer of shear will not cause deformation to the underneath base. In turn, the stiffness of the structure remains constant. For a given management of motions the seismic responses of the building depend solely on the properties of the building, but in case of soft soils employed as base; the underneath base deformation deviates the stiffness of structure throughout earthquake vibration that successively affects its response, referred to as Soil-Structure-Foundation Interaction (SFSI). Even if, SFSI has kinematic and inertia result on structure; during this study only inertia result is considered.
The underneath base support condition is particularly important in calculating a structure's dynamic behaviour and assessing structural responses and distribution among structural parts in dynamic analysis ( Chopra, 1995). The supporting foundation of building behaves completely different compared to the supporting ground. Fixed base foundation may be assumed on hard stiff soil and flexible base foundation on medium or soft soil. Flexibility in base reduces the structural stiffness whereas rise in amount of vibration during seismic excitation or ground motion ( Agrawal & Shrikhande, 2016). As a result, building structural responses such as storey displacement, storey drift, and base shear differ from a stable base structure, which can be harmful or beneficial. As a result, in unstable active zones in the past, dynamic assessment of building structure on soft soil has gotten a lot of attention.
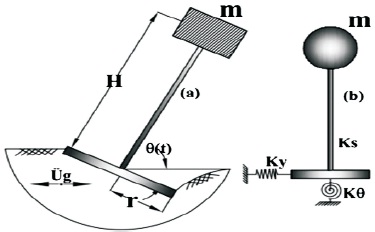
Figure 1 demonstrates SFSI effect on structures for single mass (m), stiffness (Ks), height (H) supported on Type II (sandy) soil-foundation where, the rotational stiffness (kθ), and lateral stiffness (ky), foundation base radius (r), are imperilled to ground motion accelerations (üg) .
Figure 1. Schematic View of SFSI
This may cause base deformation in rotation (θ) and bigger translation at the highest peak of structure that may results in base flexibility. Subsequently, the dynamic behaviour of the structure varies and affects structural responses of building like storey displacement, period of vibration, spectral acceleration, spectral displacements, and base shear. Figure 2(a) and 2(b) explains SFSI design in detail.
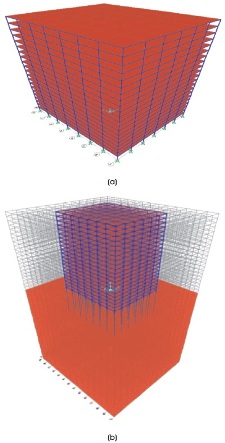
Figure 2. (a) Fixed Base SFSI (NSSI), (b) Structure Idealised with SFSI
The response spectrum analysis is a method that is applicable for all sorts of buildings, whereas the lateral force technique of study has several restrictions on its use because of the 'fear' that it might offer an un-conservative result in certain boundary conditions. However, despite of such disadvantages the method remains wide used because of its ease in application ( Crowley & Pinho, 2010). Response spectrum analysis includes spare modes of vibration to capture participation of a minimum of 90% of the structure's mass in every two orthogonal directions (Kunnath & Kalkan, 2004). Figure 4 shows the designed response spectrum curves aimed for current study. It shall be noted that, Bureau of Indian Standard (2016) includes a damping constant within the elastic responses, and spectra equation. Therefore, no damping magnitude relation has been employed in the analysis of this methodology. As per the foremost design codes, the form of target elastic acceleration spectrum may characterize by seismic intensity articulated in terms of the expected design peak ground acceleration (PGA). Therefore, the impact of soil ground sorts has been expressed in terms of the response spectral periods Tb and Tc. Varied values of Tb and Tc were considered like totally different soil ground types (from type-I of hard rock to type-III of soft soil).
Many codes recognise that the amount of vibration obtained from the simplified period–height equation is also accurate, having been directly obtained from the measured periods of vibration of buildings subject to seismic excitation. When higher modes are required (in irregular, and/or tall structures), the modal response spectrum methodology provides a more realistic profile of the lateral forces.
Nonlinear time history analysis is the foremost comprehensive methodology for seismic analysis. The ground motion record in the form of acceleration time history is input beneath the structure ( Kharade et al., 2013). The responses of structures are computed at every second for the complete length of associate degree earthquake. This methodology diverges from response spectrum analysis because the result of ''time'' is considered. The stresses and associate degree of deformations within the structure is taken under consideration as an initial condition for computation of stresses in the next step. Moreover, nonlinearities that normally occur with the associated seismic excitation are enclosed within the time history analysis. Such nonlinearities cannot be simply incorporated in response spectrum analysis. Similarly, nonlinear time history analysis does not assume a specific methodology for mode combination as response spectrum analysis considers.
Hence, results are realistic but not conservative. Furthermore, this methodology is reminiscent of obtaining 100 percent mass participation ratios used in response spectrum analysis. Complete mass participation is critical to get correct earthquake forces. Usually, only 90–95% of mass participation is attained in response spectrum analysis. All kinds of nonlinearities are taken into account during this research, and one of the most essential consideration is the seismic retrofit involves energy dissipation through member yielding or plastic hinge rotation. However, this process is extremely costly and time consuming when large amounts of information are created. Furthermore, one earthquake input is not illustrious with certainty. As a result, 3 to 5 separate time periods should be used to increase the value. The equation of motion for arrangement subjected to the seismic excitations may be written as in Equation (1) ( Raheem & Hayashikawa, 2013).

where M is the mass, C is the damping, K is the stiffness matrices, F(t) is the seismic excitation, and ü denotes acceleration, ù denotes velocities, and u denote displacement which are time dependent vectors. Subsequently the fallouts of the time history rely mostly on the characteristic of the used acceleration time history records. Time history of El-Centro 1940 earthquake shown in Figure 3, been considered in the current evaluation.
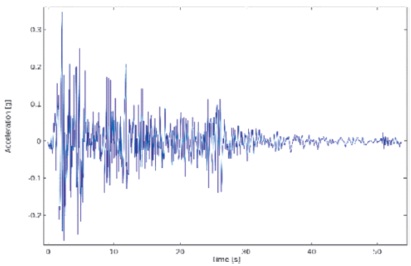
Figure 3. El-Centro Time-History
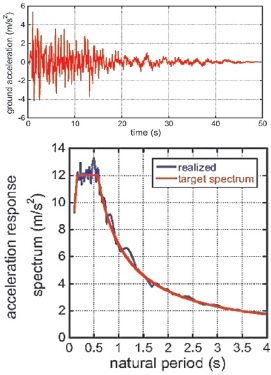
Figure 4. Matched Time-history with Response Spectrum
A three-dimensional numerical reinforced concrete structure has been modelled and analysed in response spectrum analysis (RSA) and time history analysis (THA) considering fast nonlinear analysis (FNA) using computer Code SAP2000 for specifying the maximum probable seismic responses of an elastic structural arrangements. The results of analysis will express the behaviour and recital level of the structures. To accomplish dynamic analysis in SAP2000, following steps are to be followed:
For the current study, 21 storey model is prepared using Indian code (IS code).
The material strength properties of the structural member is given in Table 1.
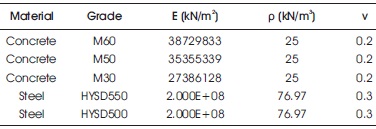
Table 1. Members Strength and Specification
Type II (sandy) soil category according to Bureau of Indian Standard (2016) for width greater than 104(x) m X 96(y) m and depth greater than 100 m underneath the structure has Shear Velocity Vs = 401 m/s corresponding to Type II (sandy) soil having Density ρ = 1886.475 kN/, Poisson Ratio ν = 0.40, Shear modulus G = 303369 kPa, Elastic modulus E = 849434 kPa, angle of friction = 32o, and cohesion = 21. Table 2 gives the properties of soil used
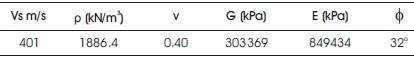
Table 2. Soil Properties
The specification of a shallow foundation is tabulated in Table 3.
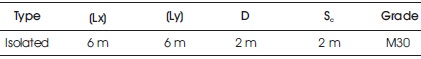
Table 3. Shallow Foundation Specification
The deep foundation specifications are listed in Table 4.
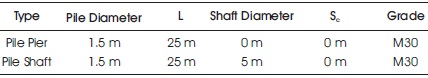
Table 4. Deep Foundation Specification
Intended for relative evaluation of flexible base and fixed base structures, four building frames regular in plan as well as elevation are considered for secondary effect due to irregularity in structure. Figure 5(a) shows the typical plan of the structure taken in consideration 6 bays in 'X' @ 8 m = 48 m, and 7 bays in 'Y' @ 8 m = 54 m so plan of 48 x 54 m and storey height of each floor is 3.5 m. Figure 5(b) and 5(c) shows 3D frame for NSSI and SFSI respectively. The plan is adapted from Indian Seismic ( Bureau of Indian Standard, 1984, 2000, 2016). The beams and columns of frames are designed according to Bureau of Indian Standard (2000) that are subjected to the design seismic action of Peak Ground acceleration PGA=0.34 g for soil type II considered for design response spectrum. Section for all model frames is taken the same as Beam 150 x 200 cm, Column 300 x 300 cm and slab 25 cm. The column, beam and slab stiffness modifiers were taken as same as prescribed in new seismic code Bureau of Indian Standard (2016). In seismic weight calculation, imposed loads on commercial building, the dead load is 3 kN/m2 according to Bureau of Indian Standard (2000), and roof live load is 1.5 kN/m2 ( Bureau of Indian Standard, 1987). For calculating seismic weight, Bureau of Indian Standard (2016) is used which indicates 100% of dead load and 25% of live load for dynamic analysis.
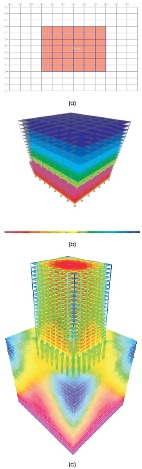
Figure 5 (a) Plan of Structure, (b) 3D frame for NSSI, (c) 3D frame for SFSI Model
Time history parameters are given in Table 5. Time history and Response spectrum analysis study has been executed on a regular building as shown in Figure 4 by using SAP- 2000-v22.0.1 software. The El-Centro earthquake time history matched with the response spectrum by means of time domain method, for taking the consequence of soil in time history function ( Naeim & Lew, 1995; Seifried & Baker, 2016). The lateral forces, storey shear, storey displacement, spectral displacement and spectral acceleration were designed for each floor and the graph has been plotted for every structure.
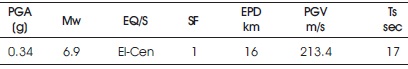
Table 5. Time History Parameters
Currently, many structural analysis softwares are obtained for structural modelling with the well-defined member properties and boundaries of structures in either 2D or 3D analysis. Despite the fact that the Soil-Structure-Foundation Interaction (SFSI) analytical model includes structural members, foundation members, and soil properties, the engineering material characteristics and boundaries are not well defined. Because of this, several simulation softwares could also be advised for soil structure interaction analysis, however might not be appropriate for style practices. In the current analysis, all-purpose structural analysis software package SAP2000 is taken in account, which is easily accessible and have enough capability to simulate SFSI.
The goal of this research is to quantify the impact of Soil- Structure-Interaction and foundation flexibility on the structural response demands of Moment Resisting Frame (MRF) buildings, so that designers are aware of the potential consequences of their choices and can judge Indian code seismic provisions for seismic loads and analysis methods throughout the seismic design of buildings. The effects of design limitation parameters on the building seismic demands, such as total base shear, spectral acceleration, spectral displacement fundamental period, storey displacements, stiffness, acceleration in storeys, axial forces at beam ends, and inner column, have been assessed using Time History analysis (TH) using a set of time history data records ( Oz et al., 2020).
The design parameters represent the supporting soil conditions (sandy); the number of storeys (21); the foundation types (isolated foundation, pile pier foundation, and Pile shaft foundation); and the flexibility and different boundary conditions at the foundation level (a constant beam and slab). The findings of the four models are compared to examine the soil-structure interaction, base shear, fundamental period, displacement, and stiffness axial forces at the beam ends column.
The periods of vibration may be a basic parameter among the force-based designing of structures as this parameter states the spectral acceleration and base shear forces at which the building has obligated to be designed ( Seifried & Baker, 2016). This research examines how seismic design codes around the world have allowed designers to determine the amount of vibration that should be employed in each linear static and dynamic analysis. Empirical building period formulations are likely to start planning the design in most building design projects. ' T' is a stiffness function of the lateral loads enduring system and building masses during fundamental periods of vibration. Figures 6, 7 and 8 depicts the difference between the fundamental period of vibration and damping ratios, while Figure 9 depicts frequencies for fixed and flexible base models. Fundamental period estimated by the fixed base is underrated especially for flexible base models and similarly the frequencies are overrated for flexible base model.
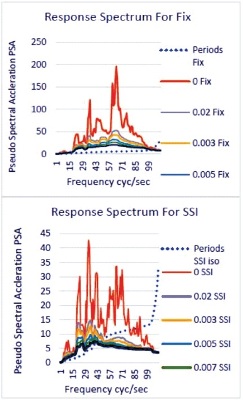
Figure 6. Response Spectrum for Fix Base and SFSI Model with 5% Damping
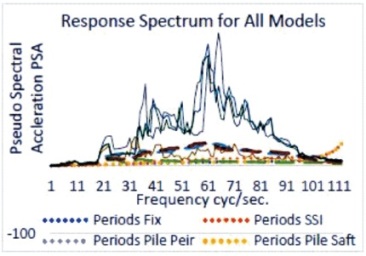
Figure 7. Response Spectrum for All Models with 5% Damping
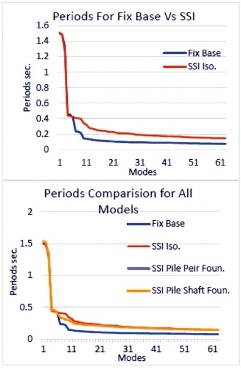
Figure 8. Periods for Fix vs. SFSI for All Models
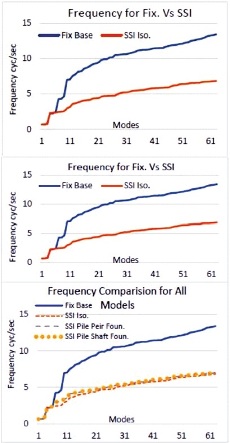
Figure 9. Frequency for Fix vs. SFSI for All SFSI Models
Storey displacement is extremely essential parameters for close building collision impact in seismic excitation for creating enough separation between close structures. The deflection profile is completely varying with the supporting fixity of the underneath base of structure. Significant soilstructure interaction for MRF buildings resting on Type II (sandy) soils could greatly enhance inter-storey drift and lateral displacement. As a result, increasing lateral deformations could change the building frame's performance range. Thus the results of SFSI within the model must be considered in a thorough dynamic study to determine the realistic performance level of a structure. In this study, a numerical soil-structure-foundation model has been developed that takes into account the behaviour of soil and structure with equal precision. Figure 10, 11, 12, 13 and 14 shows the findings of SFSI on the storey lateral displacements of 21-storey buildings under three distinct foundation conditions, including maximum storey displacement, maximum storey drift, spectral displacement, and spectral acceleration profile.
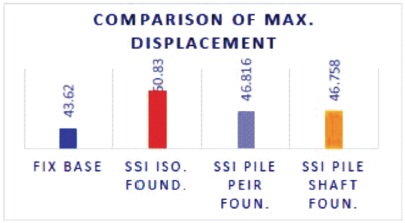
Figure 10. Comparison of Maximum Storey Displacement for NSSI, SFSI1, SFSI2, SFSI3
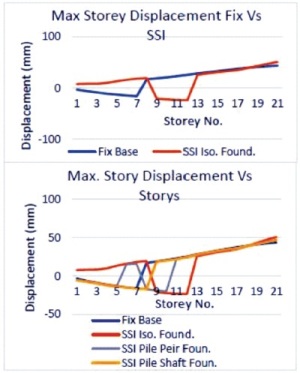
Figure 11. Maximum Storey Top Displacement in NSSI, SFSI1, SFSI2, SFSI3
It has been determined that when the displacement increases in SFSI models, the displacement would increase even more in foundations located on type II (sandy) soil, and this value reduces as the soil stiffness and building height decrease. Utilizing the response spectra approach, the maximum displacement influence for NSSI, SFSI-1, SFSI- 2, and SFSI-3 models has been 43.62, 51.0, 46.81, and 46.75 mm, respectively. Using TH, the average value of the El-Centro earthquake record has been determined.
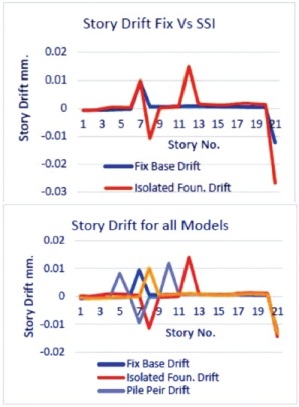
Figure 12. Maximum Top Storey Drift in NSSI, SFSI1, SFSI2, SFSI3
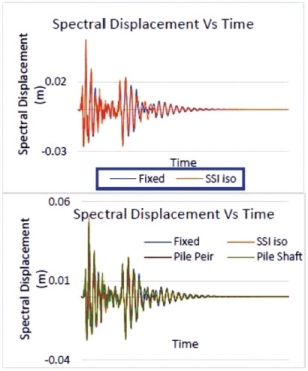
Figure 13. Maximum Top Storey Spectral Displacement vs. Time for TH in NSSI, SFSI1, SFSI2, SFSI3
The goal of this study is to distinguish the seismic performance of a typical moment-resisting building by considering the impact of soil-foundation-structure interaction. The seismic response of the structure in terms of storey shear as well as internal forces over the peak of structural components are preferred as response parameters of interest because these are commonly regarded as the most important response constraints in seismic design. The effect of SFSI on the base shear response contour over height for a 21-storey building has been calculated using three very distinct foundation designs compared to the results obtained from a fixed base NSSI model. The impact of variation in base shear due to soil flexibility assimilation as compared to the same result for fixed base condition has been shown as a quantitative relationship of such response of SFSI models to that of fixed based model.
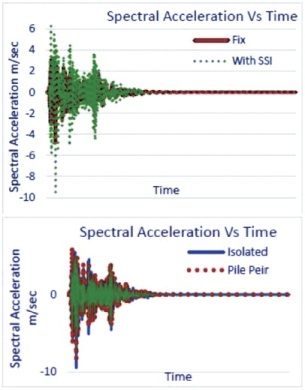
Figure 14. Maximum Top Storey Spectral Acceleration in NSSI, SFSI1, SFSI2, SFSI3
Figure 15 depicts the base shear response profile of 21- storey models as a function of building height. The average value of El-Centro earthquake ground motion records is 2055 kNm, 6769 kNm, 5913 kNm, and 5205 kNm, respectively, for NSSI, SFSI-1, SFSI-2, and SFSI-3 models using the time history approach. In the analysis, it has been evident that the values of base shear in the flexible base model incorporating SFSI are significantly higher than in the fixed base model.
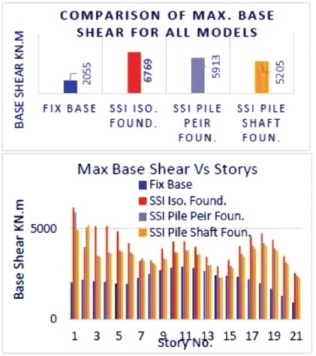
Figure 15. Maximum Storey Shear at Each Storey Level for NSSI, SFSI1, SFSI2, SFSI3
The goal of this study is to gain a better understanding of the seismic performance of typical MRF structures by combining soil structure effects. The effect of SFSI on the storey stiffness axial force response profile over height for 21-storey structures has been constructed using three distinct foundation conditions and compared to those produced from fixed base NSSI models with various SFSI models. The maximum storey stiffness and axial forces values for NSSI, SFSI1, SFSI2, and SFSI3 are shown in Figure 16, 17, 18 and 19 respectively. In the analysis it is found that the significant decrease in the values of model stiffness increases the axial forces that accounts in the structure comparison of the result.
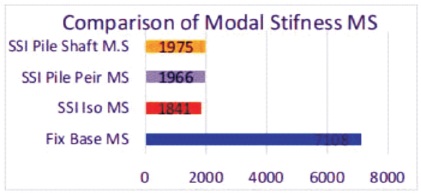
Figure16. Comparison of Maximum Modal Stiffness (MS) for NSSI, SFSI1, SFSI2, SFSI3
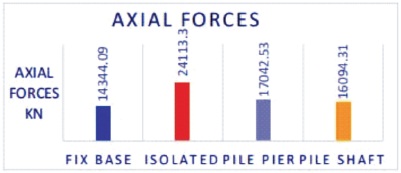
Figure 17. Comparison of Maximum Axial Forces (AF) for NSSI, SFSI1, SFSI2, SFSI3
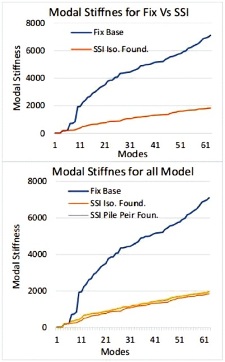
Figure 18. Maximum Modal Stiffness for NSSI, SFSI1, SFSI2, SFSI3
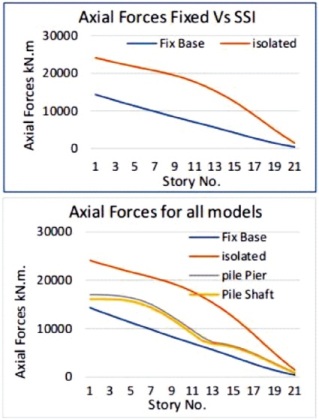
Figure 19. Maximum Axial forces at Each Storey for NSSI, SFSI1, SFSI2, SFSI3
Figure 20 shows the spectral displacement and spectral acceleration in the foundation top. It is found in the evaluation of result that structure with the fixed base has larger values of spectral displacement and spectral acceleration.
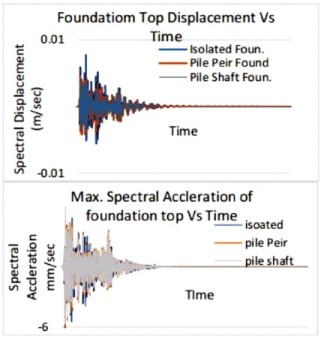
Figure 20. Maximum Acceleration and Displacement of Foundation Top
Table 6 and Figure 21 shows the variation in analysis result of models found on the three different foundation conditions to specify the better suitable foundation that performs well during seismic excitation.
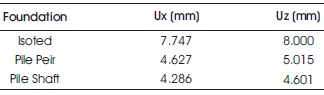
Table 6. Maximum Displacement and Settlement
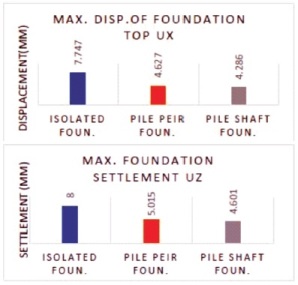
Figure 21. Maximum Displacement and Settlement of Foundation Top
Table 7, Figures 22 and 23 shows the variation in displacement, settlement, and stress in the soil profile as it progresses toward the conclusion. Overall, the soil supporting pile shaft foundation has the least variation in displacement, settlement, and stresses, whereas the other two foundations have larger variations.
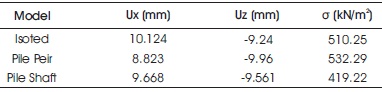
Table 7. Dispalcement, Settlement in Soil and Stress when Maximum
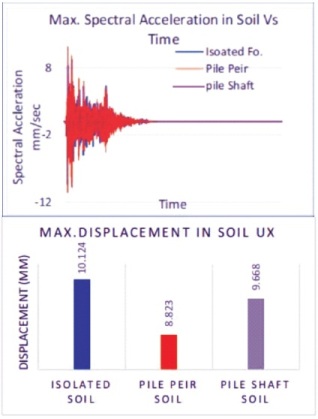
Figure 22. Maximum Acceleration and Displacement in Soil
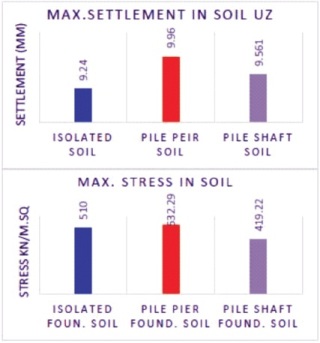
Figure 23. Maximum Settlement and Stresses in Soil
Figure 24 shows the maximum stress in soil for isolated foundation.
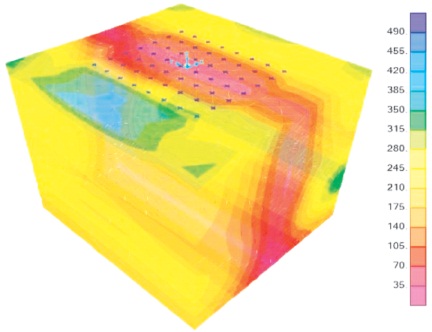
Figure 24. Maximum Stress in Soil for Isolated Foundation i.e., 510 kNm
Figure 25 shows the maximum stress in soil for pile pier foundation.

Figure 25. Maximum Stress in Soil for Pile Pier Foundation i.e., 532.29 kNm
Figure 26 shows the maximum stress in soil for pile shaft foundation.
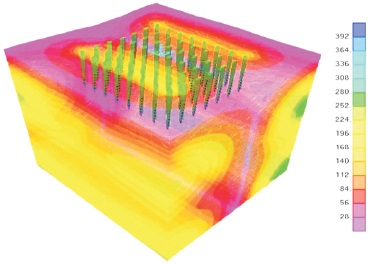
Figure 26. Maximum Stress in Soil for Pile Shaft Foundation i.e., 419.22 kNm
Figure 27, 28 and 29 represents the graphical variation of stress in the foundations with different colour schemes.
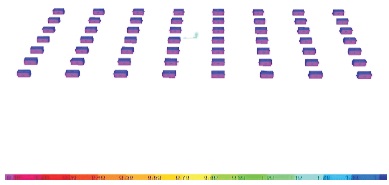
Figure 27. Stress for Isolated Foundation
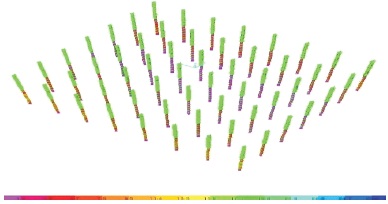
Figure 28. Stress for Pile Pier Foundation
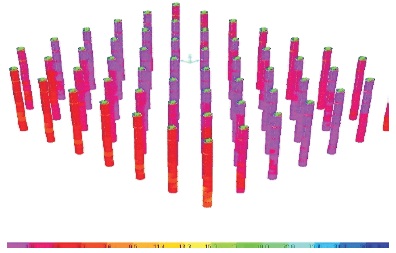
Figure 29. Stress for Pile Shaft Foundation
An entire study could be useful in creating design pointers for seismic design of building frames while taking into account the impact of soil flexibility in the analysis.
For medium soil conditions, a 21-story building has been analysed and built with isolated foundation, pile pier foundation, pile shaft foundation, and fixed base condition. The main goal of the study was to look into the overall seismic performance of buildings built on various foundation conditions according to the Indian standard code. The responses of the buildings were analysed including spectral acceleration, spectral displacement, storey drift, storey displacement, storey forces, fundamental period, frequencies, and base shear. SAP2000 has been used to perform the nonlinear time history and response spectrum analysis.
SFSI analysis is carried out by comparing the results obtained with those obtained from fixed base assumption. The following are the main findings of the analysis: