Figure 1. Pond Ash
Geopolymer concrete is an eco-friendly concrete as it produces less CO compared to ordinary Portland cement. The 2 scarcity of natural river sand has led to many investigations to find a substitute for fine aggregates. Pond ash which is an industrial waste, has been used as substitution for fine aggregates. The current paper investigates effect of pond ash gradation on mechanical properties of geopolymer concrete by ANN and MLRA analysis. Various data samples collected from literature were fed into ANN and MLRA tool box in MATLAB and Microsoft Excel respectively to obtain the strength predictions. The outcomes of analysis of ANN and MLRA model showed that ANN and MLRA results match well with experimental data from literature. The predicted strength results of geopolymer concrete having pond ash belonging to zone II exhibited better strength properties than geopolymer concrete having pond ash belonging to Grade I, III and IV.
Concrete is one of the extensively used material in the globe. Due to the use of ordinary portland cement (OPC) there is large quantity of greenhouse gases emitted to environment leading to pollution. To condense the expulsion of green house gases there is utmost necessity to substitute OPC with substitutional green building material which is eco-friendly.
Various ways to decrease the utilization of cement are as follows (Krishna & Rao, 2019).
Scarcity of natural river sand has led to find an alternative solution for fine aggregates. Therefore M-sand as fine aggregate with pond ash of different grades replaced partially were utilized for this study. This paper investigates the effect of pond ash gradation on mechanical properties of geopolymer concrete.
Joseph Davidovits has introduced “Geopolymer” word in the year 1978 for the first time. Geopolymer substances are alumina silicate products which are activated by alkalis leading to the formation of geopolymer gel. Geopolymer materials possesses very low carbon footprint than ordinary portland cement. Thus geopolymer concrete is environment friendly and requires modest energy to generate. It also recommends economical solutions to many problems where harmful deposit has to be treated and should be stored in decisive ecological situations (Krishna & Rao, 2019).
Geopolymer concrete strength has been enhanced with higher molar concentration (Krishna & Rao, 2019). Geopolymer binder is very good in fire resistance and has got high temperature stability hence geopolymer foamed concrete has been preferred over OPC based foamed concrete (Zhang et al., 2014).
Compressive strength of concrete incorporated with bottom ash as substitution material for sand remains unaffected upto 28 days curing while strength increases beyond that of conventional concrete following the completion of 90 days curing. Splitting tensile strength values of concrete had got better at every curing days. Young's modulus has been reduced at every curing days (Singh & Siddique, 2014).
Fly ash is an industrial waste got from the thermal power station. It is also known as pulverized fuel ash. In 2016-17 it is noted that the fly-ash production is around 300-400 metric tons, and if this is not utilized properly then it leads to a serious disposal problem and it may be hazardous to the environment. Therefore there is an utmost necessity to minimize the dumping problem of fly ash and one such way is to make use of it in construction industry. In this work it is used as binder in GPC (Duxson et al., 2007; Gunasekara et al., 2015). Specific gravity and fineness of fly ash has been obtained as 2.3 and 2.5% respectively.
GGBS is an industrial by-product acquired from iron or steel industries in crystalline glassy form and then it is made into the powder form by ground granulating. The most important constituents of the GGBS are SiO2, Al2O3, CaO and MnO. Due to the presence of alumina and silica this is used as replacement for cement. Curing geo-polymer composites at elevated temperature obtains good mechanical properties, but this is not suitable on-site. To achieve the reasonable strength at ambient curing condition, addition of GGBS is preferred (Deb et al., 2015). Specific gravity and fineness of GGBS has been obtained as 2.7 and 3% respectively.
Well graded M-Sand has been used as fine aggregates. Specific gravity and water absorption of M-Sand has been obtained as 2.61 and 6.31% respectively.
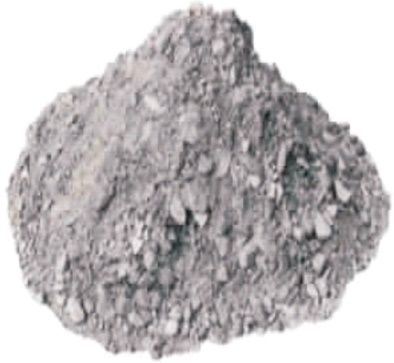
Pond ash (PA), also called as bottom ash, is an industrial waste by-product of coal combustion. The pond ash possesses various poisonous elements. These toxic elements can ramify soil and pollute soil as well as surface and groundwater. Therefore numerous research works on the use of pond ash as replacement for river sand had been performed but it has not been well received. This paper work includes fine aggregates partially replaced by pond ash (Singh & Siddique, 2014; Vasugi & Ramamurthy, 2014). Specific gravity and water absorption of pond ash has been obtained as 1.8 and 20% respectively. Figure 1 shows pond ash and Figure 2 shows combined grading of fine aggregates.
Figure 1. Pond Ash
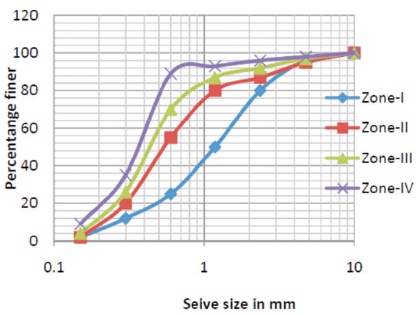
Figure 2. Combined Grading Curve of Fine Aggregates
Well graded coarse aggregates has been used in GPC. Specific gravity and water absorption of coarse aggregates has been obtained as 2.62 and 0.59% respectively.
Sodium silicate (Na2SiO3) and sodium hydroxide (NaOH) have been used as alkali activators which react with aluminosilicates to form binder gel.
Multi Linear Regression Analysis (MLRA) is used for conducting linear analysis and Artificial Neural Network (ANN), a mathematical tool in MATLAB is used to perform non-linear analysis. The sample data used for training is tabulated in Table 1. The data used for testing is listed in Table 2.
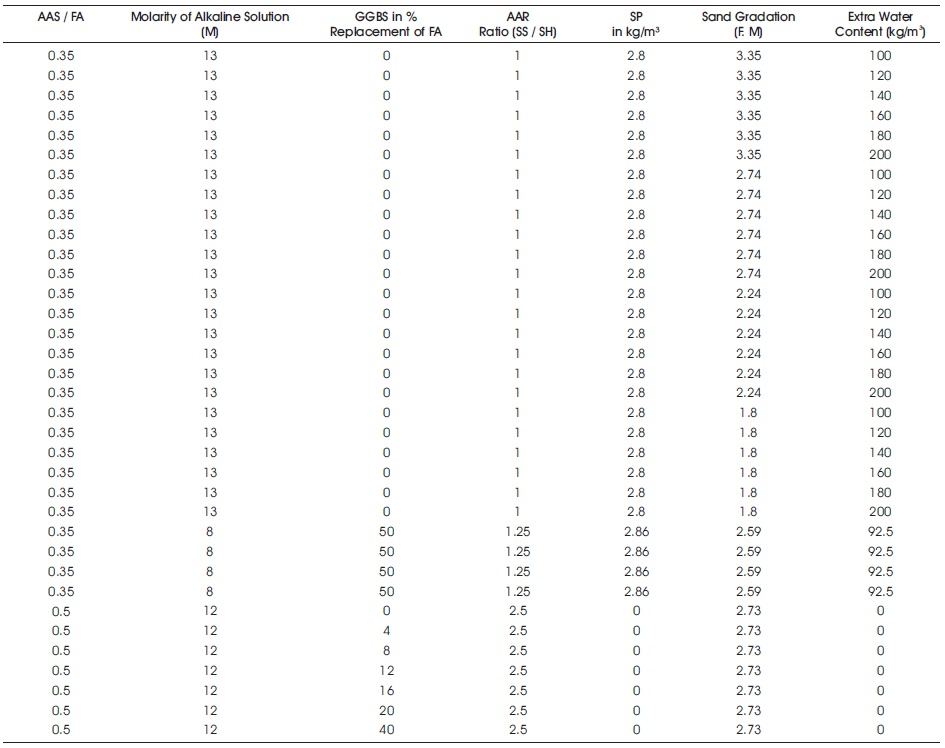
Table 1. Sample Data used for Training (Patankar et al., 2014; Sreenivasulu et al., 2016
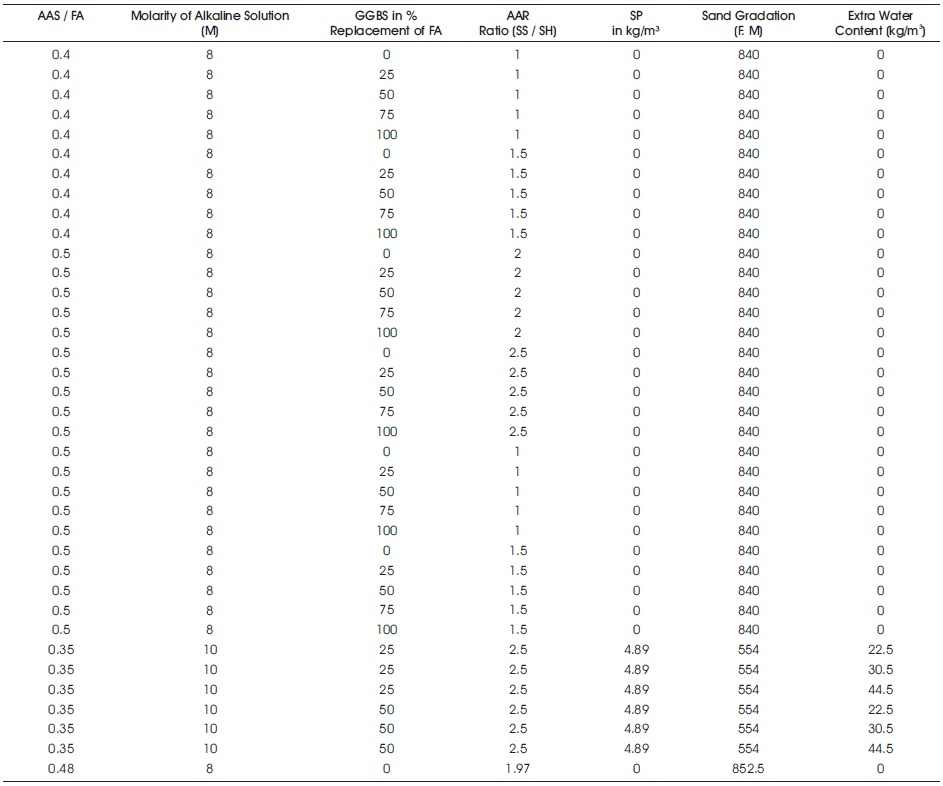
Table 2. Sample Data used for Testing (Bindhu, 2016; Tharrini, 2017)
An artificial neural network is a mathematical model which works similarly like a human brain. It learns from data and can be trained to identify the patterns, categorize data type and predict the future occurrences. It is used to perform time-series prediction and modelling. It includes, 1) input layer, 2) hidden layers, and 3) output layer. Each layer has been linked by means of nodes called neurons. Each layer uses the output of an previous layer as an input (Huang et al., 2014; Krishna & Rao, 2019).
A typical artificial neural network consists of a set of mutually interconnected neurons which carry the information. A neuron has a capacity of producing either a linear or nonlinear simulation. The entire artificial neural network can be divided into a set of layers. There are three levels of layers. They are input layer, hidden layer and the output layers. The training data is fed into the input layer which approaches one or more hidden layers for simulation.
The schematic diagram of typical ANN is shown in Figure 3. Here, the circular nodes signify an artificial neuron and the arrows represent the way how these neurons are connected. In a typical feed forward neuron network, the neurons in each layer are connected to the neurons of another layer. However, there will not be any interconnection among the neurons of the same layer. The efficiency of the passing signal is governed by the connecting weights which play a major role in obtaining the accurate results.
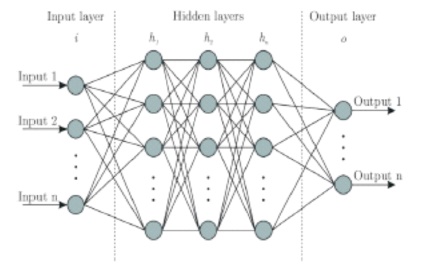
Figure 3. Typical ANN
Multiple linear regression (MLR) relates the independent and dependent variables. In this analysis molar concentration of alkaline solution, SS/SH, AAS/FA etc. are independent variables and the strength parameters are dependent variables. MLR model assumptions are,
Geopolymerization is a process of combining small molecules of alumina and silicates by a covalent bonded network forming a complex gel. The reaction mechanism involves,
The alumino-silicates reacts with the alkaline activators and dissolution of source materials takes place by forming aluminates and silicates. Further these aluminates and silicates forms a network of polySialates, a primary gel-1(NA- S-H), then the reorganization takes place and gel -2 is formed (NA- S-H). The polymerization takes place and a 3D network is formed as shown in Figure 4. The three dimensional gel formed is responsible for the strength enhancement of the geopolymer composite. The three dimensional gel may consists of some pores called mesopores, which causes drying shrinkage, and to overcome this shrinkage, filler materials could be used (Ryu et al., 2013).

Figure 4. Reaction Mechanism (Ryu et al., 2013)
Design of geopolymer concrete has been done by adopting AAS/FA ratio as 0.35. The percentage of solids in sodium hydroxide solution is 30% and in sodium silicate solution is 50%, 8M concentration of sodium hydroxide solution, and SS/SH=2.5 are the relevant parameters considered in the mix. The mix design studied is presented in Table 3. Four geopolymer concrete (GPC) mixes have been prepared confirming to grading zones I, II, III and IV respectively.
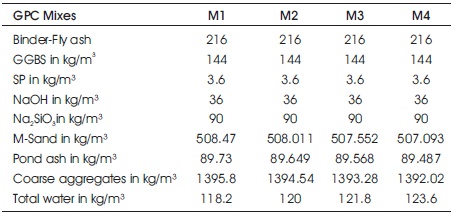
Table 3. Mix Proportion
The experimental results from the literature survey have suggested that compressive strength value for GPC is maximum for higher percentage of GGBS and higher ratio of  The compressive strength results are presented in Table 4.
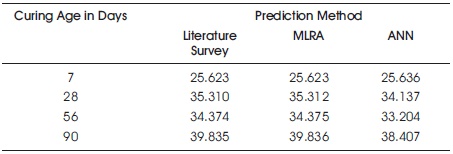
Table 4. Compressive Strength Results
Experimental results from literature survey suggested that flexural strength of GPC rises with rise in percentage of GGBS and for higher molar concentration of alkaline solution. The analysis results are presented in Table 5.
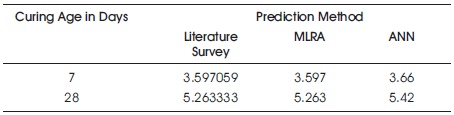
Table 5. Flexural Strength Results
Experimental results from literature survey suggested that as pond ash content enhances, split tensile strength reduces. Split tensile strength of GPC showed better results for higher percentage of GGBS. The analysis results are presented in Table 6.
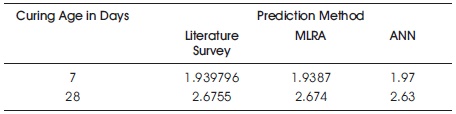
Table 6. Split Tensile Strength Results
Multi linear regression analysis (MLRA) is carried out using excel. As the number of variables increases, the accuracy increases in regression analysis. Gradation of sand and pond ash, SS/SH, percentage of GGBS, molarity of alkaline solution, AAS/FA, percentage of super plasticizers are independent variables and flexural strength, compressive strength, split tensile strength are dependent variables. By entering all the variables data in excel sheet, regression analysis has been performed. Using these results an equation is acquired from MS Excel.
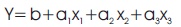
where Y is strength of GPC, b is intercept, (x , x , x ...) are 1 2 3 independent variables and (a , a ...) are coefficients of 1 2 independent variables (Uyanık & Güler, 2013).
Artificial neural network model (ANN) has been done using MATLAB. At first the input and target values are fixed. Gradation of sand and pond ash, SS/SH, percentage of GGBS, molarity of alkaline solution, AAS/FA, percentage of super plasticizers are input values and flexural strength, compressive strength, split tensile strength are target values. Using the input and target values, ANN model has been prepared and data training has been done to obtain the results.
Among the test data, 70% of the data has been taken for training, 15% for testing, and 15% for validation of ANN analysis.
Figures 5, 6, 7 and 8 shows the performance of compressive strength of geopolymer concrete in ANN model for 7, 28, 56 and 90 days respectively with respect to training, validation and testing. The prediction of compressive strength values by ANN models for training, testing and validation were satisfactory with R=0.93398, R=0.7368 and R=0.806 for 7 days curing, R= 0.973, R=0.888 and R=0.696 for 28 days curing, R= 0.988, R=0.964 and R=0.988 for 56 days curing, and R= 0.966, R=0.817 and R=0.964 for 90 days curing.
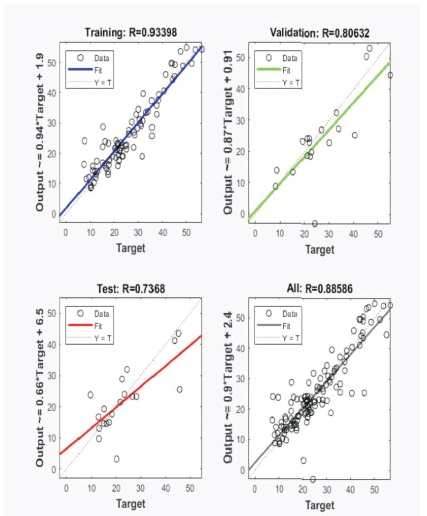
Figure 5. Compressive Strength in ANN Model Regression Graph for 7 days
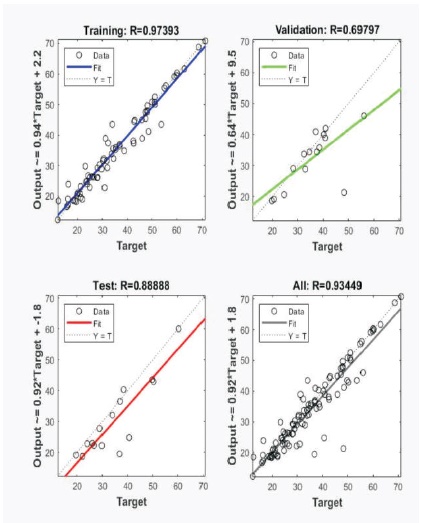
Figure 6. Compressive Strength in ANN Model Regression Graph for 28 days
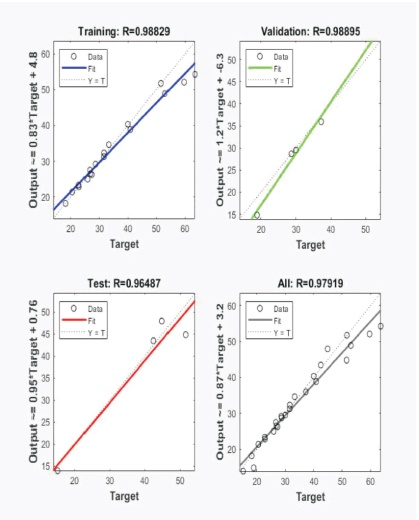
Figure 7. Compressive Strength in ANN Model Regression Graph for 56 days

Figure 8. Compressive Strength in ANN Model Regression Graph for 90 days
Figures 9 and 10 shows the performance of flexural strength of geopolymer concrete in flexural strength of geopolymer concrete in ANN model for 7 and 28 days respectively with respect to training, validation and testing. The prediction of flexural strength values by ANN models for training, testing and validation were satisfactory with R= 0.999, R=0.980 and R=0.983 for 7 days curing, and R= 0.997, R=0.976 and R=0.944 for 28 days curing.
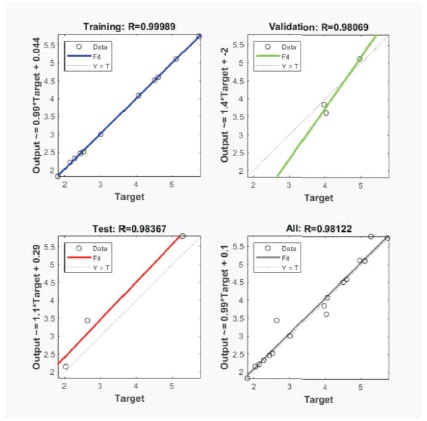
Figure 9. Flexural Strength in ANN Model Regression Graph for 7 days
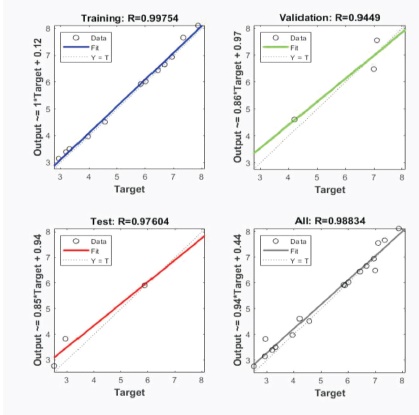
Figure 10. Flexural Strength in ANN Model Regression Graph for 28 days
Figures 11 and 12 shows the performance of split tensile strength of geopolymer concrete in ANN model for 7 and 28 days respectively with respect to training, validation and testing. The prediction of split tensile strength values by ANN models for training, testing and validation were satisfactory with R= 0.995, R=0.990 and R=0.983 for 7 days curing, and R= 0.992, R=0.944 and R=0.964 for 28 days curing.
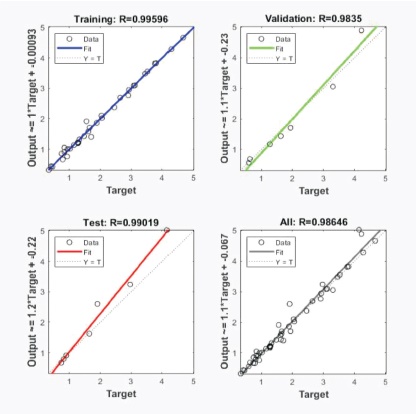
Figure 11. Split Tensile Strength in ANN Model Regression Graph for 7 days
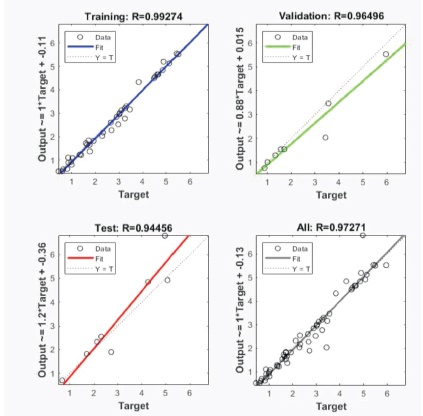
Figure 12. Split Tensile Strength in ANN Model Regression Graph for 28 days
Figures 13, 14, 15 and 16 presents the comparison of compressive strength results of geopolymer concrete obtained by MLRA and ANN models for 7, 28, 56 and 90 days respectively. R2 value of 0.743 and 0.636 for 7 days and 28 days curing indicates that 74.3% and 63.6% of values of compressive strength predicted by MLRA and ANN fall in best fit line. R2 value of 0.979 and 0.904 for 56 and 90 days curing shows that predicted values from both ANN and MLRA best fits with each other.
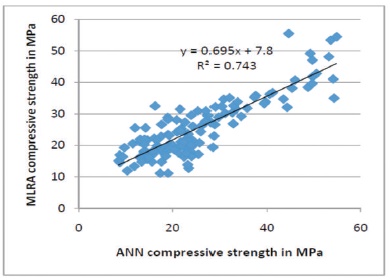
Figure 13. MLRA Compressive Strength vs. ANN Compressive Strength (7 days)
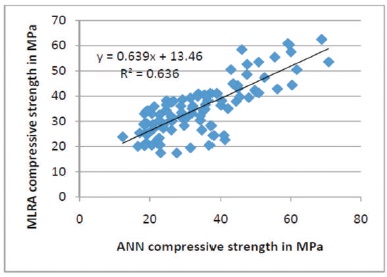
Figure 14. MLRA Compressive Strength vs. ANN Compressive Strength (28 days)
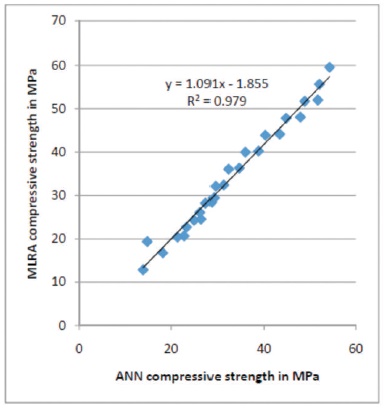
Figure 15. MLRA Compressive Strength vs. ANN Compressive Strength (56 Days)
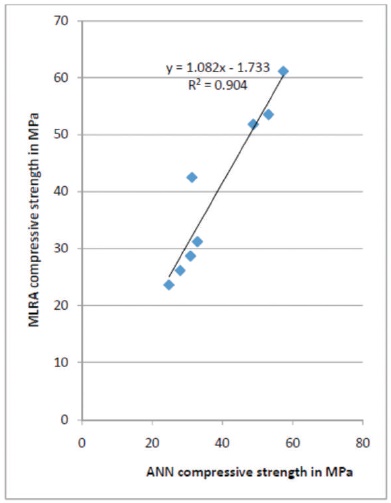
Figure 16. MLRA Compressive Strength vs. ANN Compressive Strength (90 days)
Figures 17 and 18 presents comparison of flexural strength results of geopolymer concrete obtained by MLRA and ANN models for 7 and 28 days respectively. R2 value of 0.965 and 0.978 for 7 days and 28 days curing indicates that values of flexural strength predicted by MLRA and ANN best fits with each other.
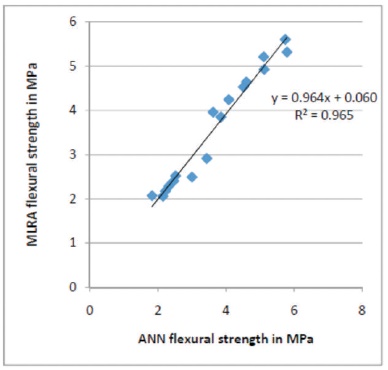
Figure 17. MLRA Flexural Strength vs. ANN Flexural Strength (7 days)
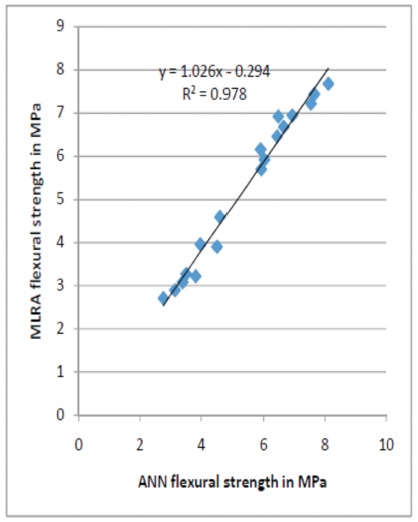
Figure 18. MLRA Flexural Strength vs. ANN Flexural Strength (28 days)
Figures 19 and 20 presents comparison of split tensile strength results of geopolymer concrete obtained by MLRA and ANN models for 7 and 28 days respectively. R2 value of 0.919 and 0.893 for 7 days and 28 days curing indicates that values of split tensile strength predicted by MLRA and ANN best fits with each other.

Figure 19. MLRA Split Tensile Strength vs. ANN Split Tensile Strength (7 days)
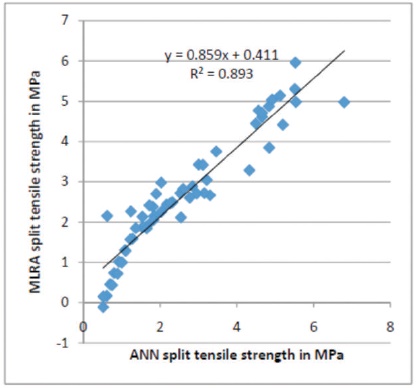
Figure 20. MLRA Split Tensile Strength vs. ANN Split Tensile Strength (28 days)
The Table 7, 8 and 9 shows gradation of pond ash effect on compressive, flexural and split tensile properties of geopolymer concrete respectively.
From the analysis results, it is noted that there is slight variation in strength value of GPC for all the grading zones having all other parameters constant. However, pond ash belonging to gradation Zone II showed higher strength values in comparison to other gradation zones. Compressive strength results of geopolymer concrete with pond ash belonging to gradation zone II showed higher strength with maximum value of 51.14 MPa for 28 days curing.
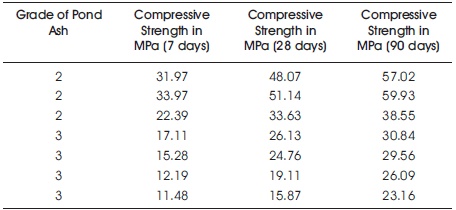
Table 7. Pond Ash Gradation Effect on Compressive Strength
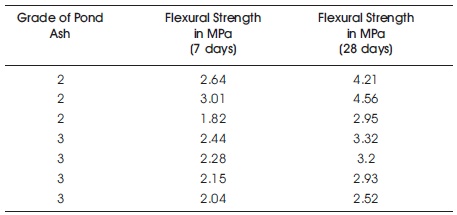
Table 8. Pond Ash Gradation Effect on Flexural Strength
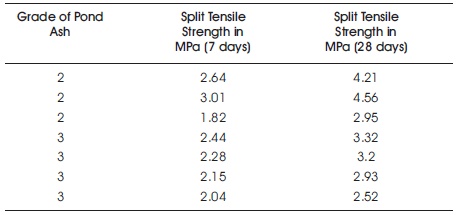
Table 9. Pond Ash Gradation Effect on Split Tensile Strength