

where,
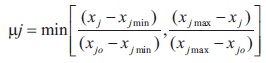
X jmin =Minimum optimization value for the passing from sieve J
X jmax =Maximum optimization value for the passing from sieve J
XLLj = Specification lower limit for sieve J
Xui = Specification upper limit for sieve J
Tj= Purposed tolerance percent for sieve J
Triangular membership function is given for the percent passing, for the purposed mix, from each sieve xj to represent its uncertainty within the minimum optimum value xjmin and maximum optimum value xjmax. The degree of membership μ(xj) is equal to 0 for both xjmin and xjmax. Although, the degree of membership is equal to 1 at the middle of design range xjo as shown in Figure 1. The optimum aggregate combination is attained when all the membership degrees are maximized to be close to 1 for all sieves (Akkurt et al., 2004).
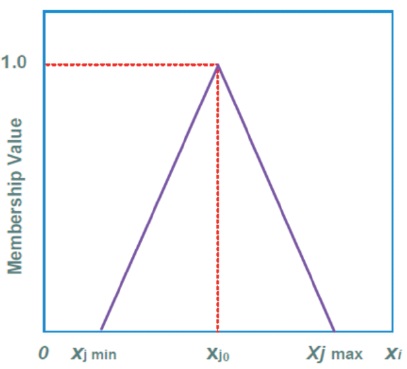
Figure 1. Illustrates the Shape of the Triangular Membership Function
3.4 Objective Function
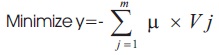
The objective of the future model is to maximize the summation of product of membership degree and the material variability for all sieves as indicated in Equation (3). This can ensure that the final gradation is the adjoining of the mid-range, which can be achieved by considering the variability of the material (Raj et al., 2014).
where,
m = Total number of Sieves
Vj= Final blend variability for the percent passing sieve j.
M=Membership value for the percent passing sieve j.
3.5 Limitations
The limitation of this study can be expressed as in Equation (4). It is an equality limitation to confirm that the sum of the proportioning of the various aggregate types will be equal to 100%. There are two types of constraints which are equality constraints and inequality constraints. Equality limitations is related to the fixed relationship between the variables whereas the inequality limitations contract with the flexible relationship between the variables.

where,
n = Number of aggregate types
Ri = Blending ratio for aggregate type i
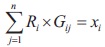
Equality limitations would join the aggregates proportioning by passing percentage of final gradation leading to m linear equations as given below.
where,
Gij = Actual passing percentage for aggregate size I from the sieve j
xj = Percent passing for the final combination from sieve j
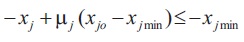
Based on the triangular membership function scheme in Figure 1, the degree of membership μ can be measured j by Equation (6) which could lead to two inequality illustrated as Equations (7) and (8). These two equations can lead to Equation (4).
3.6 Boundary Conditions
- Boundary conditions for the blending ratio R which i leads to inequality equation where n is the number of aggregate types.

- Boundary conditions for the percent passing for the final blend in each sieve x which leads to inequality j equation where m is the total number of sieves.

- Boundary conditions for degree of membership for the final blend in each sieve in which it leads to inequality j equation where m is the total number of sieves.

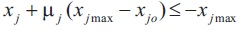
The aggregate proportioning of an individual fractions had been determined in various coarse to fine aggregates CA/FA ratio of 90:10, 80:20, 70:30, 60:40, 55:45, 50:50 as shown in Table 1 and Figure 2.
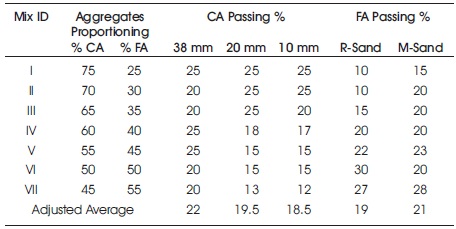
Table 1. Final Blending Ratios of Different Mixes
Figure 2. Illustration of Purposed Aggregates Gradation
3.7 Maximum Density Methods
To optimize the density of the all aggregate in concrete mixtures, the proportion of components would be selected in such a way for the voids between large particles should be filled up with medium and fine aggregates (Richardson, 2005). The higher degree of particle packing leads to minimum voids, maximum density and less cement and water requirement (Antunes & Tia, 2018; Mangulkar & Jamkar, 2013Obla & Lobo, 2015; Raj et al., 2014; Richardson, 2005). In the present study power chart, 0.45 has been used for all aggregates combination, in order to obtain a dense and stiff particle structure in concrete mixes. Regardless of its practical use, a maximum density gradation provides a convenient reference.
Fuller and Thompson (1907) developed an equation as cited in (Richardson, 2005; Tayabji et al., 2012) to describe a maximum density gradation for a given maximum aggregate size as certain in the following Equation.
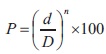
where,
D = Maximum size of aggregate
P = Percentage of finer than diameter d (by weight)
d = Maximum size of fine aggregate
n = Parameter which adjusts curve for fineness or coarseness (for maximum particle density n ≈ 0.5 according to Fuller and Thompson)
This equation with n = 0.45 is convenient for determining the maximum density line and by adjusting gradation it uses the sieve size raised to the nth power as the x-axis units. Thus, a plot of maximum density equation with n = 0.45 appears as a straight diagonal line generated from zero and the maximum aggregates size gradation for the various combinations from Table 1 had been considered as shown in Figure 3.
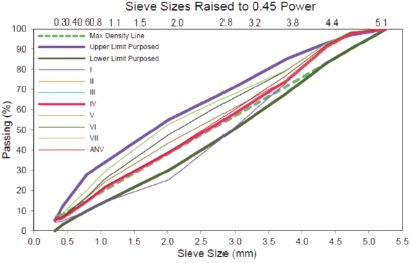
Figure 3. MDL of Proposed Aggregates for PQC
3.8 Coarseness/Workability Factor Chart
The coarseness factor is an experimental method for aggregate gradation analysis (Richardson, 2005). This method contains an illustration of aggregate gradation that can be used in a distinct chart to estimate the fresh concrete mixture workability and the probability of segregation (Antunes & Tia, 2018; Quiroga, 2003) as shown in Figure 4. Combined aggregate with poor gradation will be disposed to segregation onsite and will not provide the adequate workability. Presented are two factors resulting from the gradation of aggregate to forecast the workability of the fresh concrete mixtures (Tayabji et al., 2012). This method involves calculating a Coarseness and Workability Factor using the following (Mamirov, 2019; Obla & Lobo, 2015; Quiroga, 2003; Richardson, 2005).
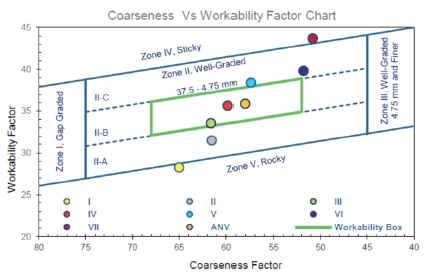
Figure 4. Coarseness and Workability Factor Relation of Mixes
where,
Cumulative retained percentage on the 9.5 mm sieve (Q)
Cumulative retained percentage on the 2.36 mm sieve (R)
The coarseness and work ability factors of the mixtures are as in Table 1 had been calculated by using the above mentioned equations and the result are presented in Figure 4.
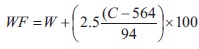
where,
Cumulative passing percentage the 2.36 mm sieve (W) Cementitious materials content (C) Kg/m3
3.9 Percent Retained Chart
This method assessing exact spreading of each sieve size has an individual retained percentage in the chart shown in Figure 5. This diagram can easily show the excess or missing sieve sizes of a combined grading with a maximum limit of 18-22% and a minimum margin of 5-12% retained on each sieve (Mamirov, 2019; Obla & Lobo, 2015; Quiroga, 2003; Richardson, 2005). The retained percentage of the mixtures listed in Table 1 have been calculated for each combination and the corresponding graphs are presented in the Figure 5.
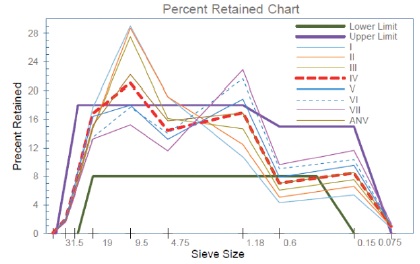
Figure 5. Individual Percent Retained Chart for PQC Mixes
In the current study Individual Percent Retained Chart are developed for all aggregates combination. In order to obtain limited upper and lower retained percentage in concrete mixes gradation which provides a convenient reference.
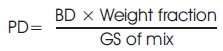
3.10 Determination of the Bulk Density and Air Voids Content of Mixtures
The void and packing density of aggregate mixtures can be expressed as Equation (12). The packing density of combined individual aggregate represents the maximum bulk density of the mixtures with respect to the overall specific gravity. The purpose of packing density is to minimize the porosity of the mixtures (Wong & Kwan, 2005) that allows using the minimum possible amount of binder.
The air voids content is the percentage volume of the aggregate or mixture of combined aggregates determined from its bulk density from the Equation (13).
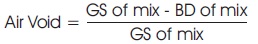
where,
PD= Packing Density (kg/m3)
BD= Bulk Density (kg/m3)
GS= Specific Gravity
3.11 Reconfirming the Mix Fractions
To reconfirm the selected mix proportions of coarse aggregates in the mixes by the CGM, fine aggregate percentages have been increased in the various mixes from 25% to 55% gradually. The specific gravity, air voids, and bulk density tests were carried out according to the Indian standard IS: 2386 (Part III)-1963 (Bureau of Indian Standards, 2016) and the test results are obtained in Table 2 accordingly.
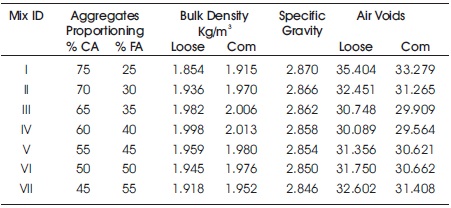
Table 2. Bulk Density, Specific Gravity and Air Voids of Proposed Mixes
4. Selection of the Desired Mixes to Perform the Experimental Investigation
Based on the results have been obtained in the Steps I to Step III, the samples that have more favorable conditions were selected for experimental investigation and taking into account the following priorities.
- Selection of Well Graded Mixes: From the Steps I to Steps III, and Figure 1 the samples which are in full file positions in the Middle zone will be nominated.
- Maximum Density Line: The mixes that, are very near to MDL from Figure 2, will be selected as dense and compacted mixes.
- Coarseness and Workability Factors: From Figure 3, the mixes which are laid down on the workability box will be obtained as workable mixes.
- Retain percentage: From Figure 4 the mixes that are within/closer to the limit will be selected.
- Bulk and Pacing Densities: From the Table 2, the maximum density has been plotted in Figure 6 and the minimum air voids in Figure 7.
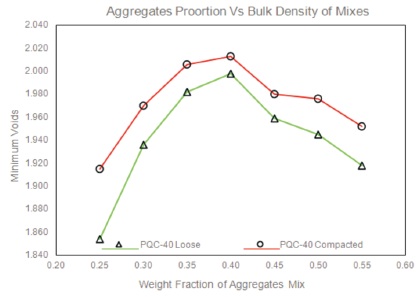
Figure 6. Maximum Loose and Compact Density of Mixes
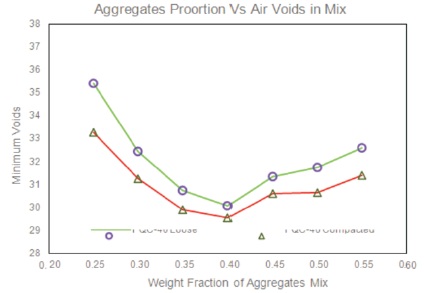
Figure 7. Minimum Air Voids in Loose and Compacted Density of Mixes
Step IV: Adopt the Experimental Design (DOE): From Steps I, II, and III in Section 3.1, for any desired result of atleast 90 percent achievement, a numeric value 1 will be assigned, and for mixes which have not achieved, a numeric value 0 will be given.
The mixes which have the value of +1 from the average numerical value (ANV), will be nominated for the design of experiments. In this case, the mixtures III, IV, V and average (ANV) have numerical value 4/5, 5/5 and 4/5 respectively as shown in column 7 in Table 3 which will be selected for further future experiments.
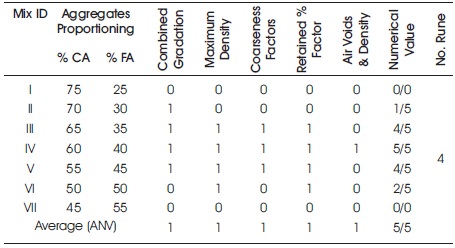
Table 3. Numerical Value of Concrete Pavement Mixtures
4.1 Pavement Quality Concrete Mix Design
Concrete mixes were carried out by the Indian code of standard IRC 44-2016 (Indian Road Congress, 2017) with the recommendation of MoRTH 5th revision for mixtures III, IV, V and similarly average (ANV) sample. The fresh and hardened concrete performance has been checked and compared with the various curing ages.
4.2 Mix Proportions for Trial Mix Based on Aggregate Gradation
The selected concrete mix design proportions in dry conditions are presented in the Table 4.
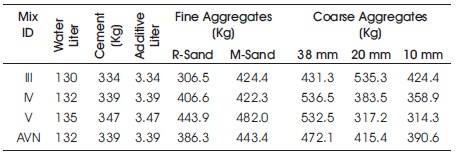
Table 4. Mix Proportions for One Cum Trial Mix with SSD Condition
4.3 Workability Measurement
The workability and fluidity of fresh mix were performed by slump cone test according to the Indian standard code of practice IS 7320-1974 (Bureau of Indian Standards, 2008). The level of the slump has been measured at the initial time, 5, 10, 15, 30, 45, 60, 90 and 120 minutes. The slump measurement continued until the concrete workability reached up to 0-25 mm. The relativity of slump and time losses is presented in Figure 8 where a scatter plot of the data for slump (y-axis) during the time losses (x-axis) has been plotted.
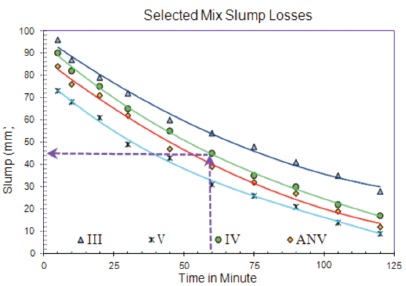
Figure 8. Concrete Slump Losses (mm)
4.4 Mix Design Strength Summary
The compressive strength test has been performed on cubes sample 150 mm and flexural strength of beam specimens with 150 × 150 × 700 mm standard size for the desired curing period. The samples were demolded after 24 hours of casting time and were placed in a fixed temperature tank at 25±2 ºC. The specimens were removed from water at 3, 7, 28, 42 and 90 days and were tested in surface dried condition as per IS: 516 (Bureau of Indian Standards, 2004). The mix design strength summaries are presented in Table 5, Figure 9 and Figure 10.
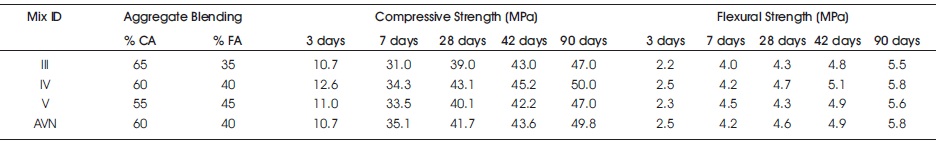
Table 5. Compressive and Flexural Strength of Concrete Mixes
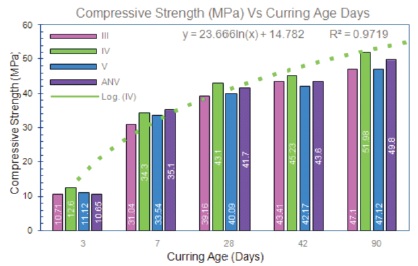
Figure 9. Compressive Strength of PQC Mixes During Curing Age
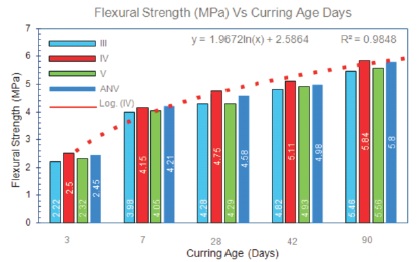
Figure 10. Flexural Strength of PQC Mixes During Curing Age
5. Procedure and Test Results
In the present study, based on the laboratory investigations and data analysis, the following conclusions can be drawn.
- Traditional and novel optimization techniques have been proposed in order to optimize the concrete mix design with admirable accuracy. But time consumption, the high number of EOD run, cost and environmental effect are the existing problems in the present scenario.
- In this study, an attempt has been made to bridge the gap between traditional and novel methods of concrete mixing design optimization in an effective manner.
- •Combined Graphical Method (CGM) is the consequence of various studies resulting from many experimental investigations with different methods that have been done by the authors to optimize the concrete mixes. The CGM method is an integration of existing methods to verify data analysis to predict the optimal blending.
- Well and continuous gradation is the most influential factor in the inherent properties of concrete mixtures. In the suggested method, the proportion of aggregate fraction can be selected in such a way that a well and dense aggregate blending is obtained, which fits the needs of the specifications, standard and design goal.
- Any possible method either conventional or novel technique can be used and proposed the blending of individual fractions by considering the volume of the aggregates in job mixes before casting of samples and can predict the suitability of the proposed combination.
- In respect to the mix gradation, the mixtures III, IV, V and ANV samples are positioned to the middle zone area as shown in Figure 1, wherein numerical value 1 is assigned and other samples that are out of this limit partially or entirely will be considered as zero.
- The average of the results obtained from the proportioning ratio shows the meaningful results as these values are very close to mixture PQC-IV. Therefore, these data are predictive combinations and could be used in future evaluations.
- From the average of individual gradation results, blending chart has been plotted in various propositions. Using the Maximum Density Line (M.D.L) determined from the max density equation and adopting grading with particle size raised to the 0.45 power and plotting on the grading chart cares the mathematical equation smoothing.
- The mixtures III, IV, V and ANV are the samples that were very near and close to the maximum density line wherein they were selected for concrete mix design optimization. However, the mixture IV and ANV had more acquired data.
- Using the numerical method of aggregate mix design and transforming them to the Fuller's curve, coarseness factor and cumulative retain percentage, efficiently as a criterion of packing ability of the aggregates are required to calculate aggregate mixes for a different type of concrete that might allow to predict strength and workability.
- As illustrated in Figure 4, the mixtures IV and ANV are within the limit and mixtures III and V are near to the workability zone and coarseness factor. Wherein they were selected for concrete mix design optimization by assigning the numerical value of 1 and other mixtures which are out of limit, the numeric value of zero has been assigned.
- In a similar way, mixture III, IV, V and ANV about 90% where, in the limit to retain percentage will be assigned with numerical value 1 and the other samples which were out of limit were nominated as 0.
- The packing density of combined individual aggregate represents the maximum bulk density of the mixtures concerning the overall specific gravity for different mixes from 25 to 55% gradually. Specific gravity, air voids and bulk density tests were performed according to the Indian standard IS: 2386 (Part III) -1963 (Bureau of Indian Standard, 2016). The mixtures IV and ANV have a maximum density of loose and compacted density and a minimum air voids, subsequently, the numeric value 1 have been obtained for them and other mixtures that have a lower density and more air voids were assigned numeric value 0.
- The sum of the results of the experiments of studies were intended for the various fine to coarse aggregates ratio as shown in Table 3. The numerical value of mixtures to their total acquired values from 5 experiments has been compared. The mixtures in which the value is ± 1 of the average of the results, were used for subsequent experiments.
- The slump has been measured at the various timing to measure the concrete workability for the selected mixes slump loses during the time as shown in Figure 8.
- The compressive strength and flexural strength of selected mixes were carried out during the desired curing period as per Indian standard IS: 516 (Bureau of Indian Standard, 2004). The compressive and flexural strength of mixes IV and ANV were more than other mixes.
Conclusion and Recommendation
In the present study, based on the field and laboratory investigation and analyzing the result, following conclusions can be drawn.
- As mentioned before, despite of all the efforts made to provide a comprehensive approach that can meet entire needs of concrete design, it cannot be claimed that such design has been provided so far. Concrete is not only a mixture of aggregate, cement, water but also needs a little bit of awareness as well, which might be less in the existing method.
- In the present study, an attempt has been made to provide a bridge between traditional and novel methods and using the most available software MS office Excel (VBA) Visual Basic for Applications, which can be used in a more practical way in the concrete industry with more accuracy.
- Aggregate is commonly considered inert filler, which accounts for 60 to 80 percent of the volume and 70 to 85 percent of the weight of concrete. The aggregates' characteristics are an important factor for the selection of aggregate. The aggregates are several times stronger than the other components in concrete and therefore an attempt has been made to consider important features such as combined gradation, maximum density, coarseness and retained percentage factor, packing density and air voids had been considered.
- CGM is a combined technique that had been used in the concrete mixing design which significantly reduce the number of design of experiments, save time and cost involved.
- It has been observed that by using the CGM for mix design of pavement quality concrete, the values of bulk density and air voids in the concrete mixtures significantly have been changed. In which the PQC-IV with CA/FA ratio of (60:40) loose bulk density is 1.936 7 kg/m3 and compacted density is 2.013 kg/m3. Air voids are 30.089 for loose and 29.564 for compacted density.
- The workability of concrete after one hour has been 45 mm for sample IV and 40 mm for ANV sample, which is an acceptable range for concrete paving.
- The slump loses for the selected mixes IV and ANV provide uniform mixes without bleeding and segregation that could be fitted by the polynomial model. This regression is statistically above than the 95 % confidence level for mixes IV and ANV.
- Slump test for ANV: y = 0.0029x - 0.9596x + 87.348 R² = 0.9946
- The characteristic compressive strength of mix IV has been about 8% and ANV mix has been more than 5%, and the flexural strength at given ages for mix IV has been more than 7% and ANV has been 3% more than other mixes and could be fitted by the logarithmic model. This is statistically above than 95 % confidence level for mixes IV and ANV with the following equation respectively.
- Compressive Strength: y = 23.666ln(x) + 14.782 R² = 0.9719
- Flexural Strength: y = 1.9435ln(x) + 2.6171 R² = 0.9855