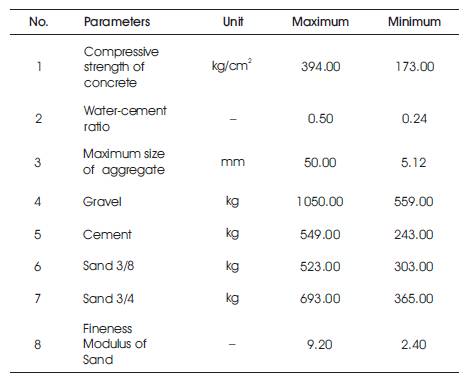
Table 1. Characteristics of Cylindrical Samples
Predicting the compressive strength of concrete has always been a difficulty, since the concrete is sensitive to its mixture components, methods of mixing, compaction, curing conditions, etc. Scientists have proposed different methods for predicting the compressive strength of concrete. Some of these methods have been successful, however, some others were not suitable enough to predict the compressive strength of concrete. The aim of this study is to evaluate the capability of Artificial Neural Network Model (ANN) in predicting the 28 days compressive strength of concrete. Therefore, considering the specific concrete characteristics as input variables, Artificial Neural Network Model is constructed and the compressive strength of concrete is predicted. Results show that ANN is a suitable model to predict the 28 days compressive strength of concrete.
Concrete is one of the most important materials in construction. It is essentially a mixture of paste and aggregate. The paste, which is comprised of water and cement, sticks the aggregate into a hard mass. The Paste hardens because of the chemical response of the cement and water, which is also called as hydration. In concrete, quality assurance and mix design of the 28 days compressive strength of concrete is believed as the most important property, which is affected by many parameters. These parameters can be identified as water to cement ratio, coarse aggregate size, characteristics of mortar, sand fineness modulus, different types of coarse aggregate with different shapes, mineralogy, texture, etc. In recent years, researchers have conducted various investigations on different types of concretes (Khalilpasha et al. 2012; Khademi and Behfarnia, 2016; Mosavi and Sadeghi-Nik, 2012). Different materials such as, nanoparticles (Bahari et al. 2012; Kafi et al. 2016; Sadeghi-Nik et al. 2011), pozzolans (Sadrmomtazi et al. 2016), and fibers have been used for the improvement of concrete compressive strength. The 28 days compressive strength of concrete is assumed as the standard compressive strength of concrete, and therefore, the strength at other concrete ages can be carried out if necessary (Siddique et al. 2011; Khademi et al. 2015b; Nikoo et al. 2015a). It is worth mentioning that in both engineering judgements and concrete constructions, prediction of concrete compressive strength is an undeniable fact.
Researchers have predicted different concrete properties using different methods. Ahmadi-Nedushan used ANFIS and optimal nonlinear regression models to predict the elastic modulus of normal and high strength concrete (Ahmadi-Nedushan, 2012). Nikoo et al. used evolutionary artificial neural networks to predict the displacement in concrete reinforcement building (Nikoo et al. 2012). Sadowski used imperialist competitive algorithm to predict the corrosion current density in reinforced concrete (Sadowski and Nikoo, 2014). Ramezanianpour determined the compressive strength of high strength concrete using ANFIS (Ramezanianpour 2004). Nikoo et al. used selforganization feature map (SOFM) to predict the compressive strength of concrete (Nikoo et al. 2015b).
This research focus is on the prediction of the 28 days compressive strength of concrete using Artificial Neural Network (ANN) model.
The specific concrete data set should be provided to be able to apply the ANN model for the purpose of predicting the compressive strength of concrete. In this study, 150 different concrete mix designs are prepared and the related specimens are constructed in the laboratory. Based on ASTM C39, the specimens were constructed in cylindrical shapes with a diameter of 15 cm and a height of 30 cm. The efficient parameters in concrete mix designs are varying from the amount of different constituents, namely 3/4 sand, 3/8 sand, cement, gravel in kilograms, maximums and size of gravel in millimeter, fineness modulus of sand, and water-cement ratio. Tables 1, 2, and 3 show the characteristics of concrete cylindrical samples, the mean and standard deviation of each parameter, and the number of patterns used in ANN model, respectively(Nikoo et al. 2015a).
Table 1. Characteristics of Cylindrical Samples

Table 2. Mean and Standard Deviation of each Concrete Characteristic
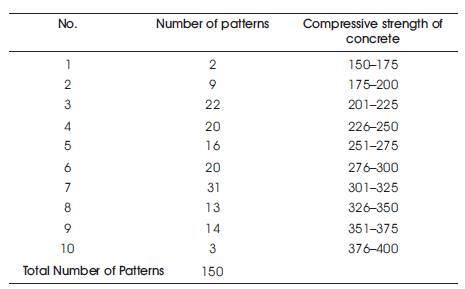
Table 3. Number of Patterns used in ANN Model
After curing of the specimens for 28 days in water, the compressive strength test was performed on all the specimens. It is worth mentioning that, the concrete compressive strength test was performed based on the ASTM C39 / C39M – 16.
Artificial Neural Network (ANN) has the ability to learn from the experiences in order to develop its performance. Same as human brain, Artificial Neural Network obtains information through learning. This model is a soft computing technique composed of simple elements which can be replaced with the customary computations which cannot solve the problems precisely. Basically, ANN consists of an input layer, one or more hidden layer(s), and an output layer. The hidden layer is connected to the other layers by weights, transfer functions, and biases (Deshpande et al. 2014; Khademi et al. 2015a). By adjusting the values of the weights (connections), neural network can be trained to perform a particular function (Diab et al. 2014). The structure of the ANN model is shown in Figure 1.
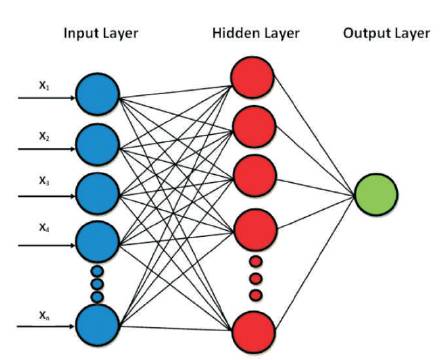
Figure 1. Structure of the Artificial Neural Network Model
In general, ANN contains three different steps of training, validation, and test. In the training step, the epochs are repeated as long as it is not gotten into the desired output accuracy. The errors of the validation step is monitored during the training step. The test set error is the one which is used to compare different models.
The ANN has been used in various engineering applications, since it has the ability to generate the communication between input and output parameters and tolerate incomplete tasks and to produce approximate results (Duan et al. 2013, Khademi et al. 2015a).
The most common statistical goodness-of-fit criteria for evaluating the result is coefficient of determination (R2), which always varies between 0 to 1. R2 implies how well the observed outcomes are replicated by the model. The higher the value of R2 is, the better the model would be. The formula of R2 is shown in Equation (1) (Khademi et al. 2015a).

where “n” is the number of specimens, “yi” is the experimental strength of “i”th specimen,  is the averaged experimental strength,
 is the calculated compressive strength of “i”th specimen, and
  is the averaged calculated compressive strength.
Choosing appropriate input variables is one of the most significant concepts in modeling the system. The selected input variables should contain all the relevant information on the target values. In this study, 7 different factors have been chosen in order to predict the 28 days compressive strength of concrete. These 7 different parameters are identified in the following:
In ANN model, the data set was divided into three subsets of training, which contains 70% of total data (i.e. 104 samples), validation which contains 15% of total data (i.e. 23 samples), and test data which contains 15% of total data (i.e. 23 samples). This division is due to increase in the generalization capacity of the ANN model and overcome over-fitting. Various algorithms were used in this research and finally, LM which is the short term of Levenberg- Marquardt was selected as the most efficient one. In addition, only one hidden layer and one output layer have been used in organizing the network, however, the number of hidden neurons in the hidden layer was selected as 15. Figures 3, 4, 5, 6, and 7 are the results recorded from Matlab software (Haario et al. 1990). The structure of the artificial neural network performed in this research is shown in Figure 2.
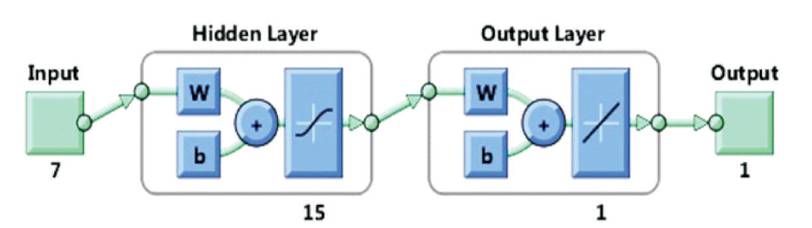
Figure 2. Structure of the ANN Model used in Matlab Software
Figure 3 shows the training states for the artificial neural network model. As it is illustrated in the figure, the errors are repeated 6 times after epoch 9 and the test is stopped at epoch 15. This error repeats starting at epoch 10 demonstrated over-fitting of the data. Therefore, the epoch 9 is selected as the base and its weights are chosen as the final weights. Moreover, the validation check is equal to 6, due to the fact that the errors are repeated 6 times before stopping the process.
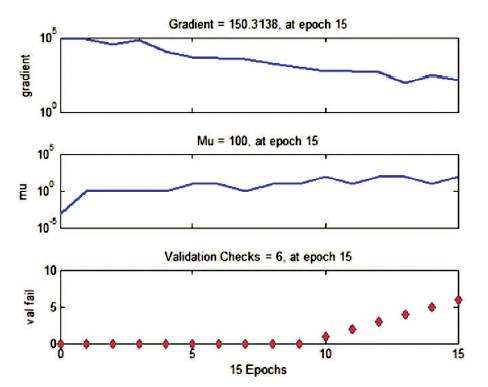
Figure 3. The Training States for the Artificial Neural Network Model
Figure 4 presents the validation performance and mean squared error of the network starting at a large value and reducing to a small value. The plot consists of three lines for three different steps of training, validation, and test. Training process on the training vectors continues until the model gets to the point that the training reduces the error of network on the validation vectors, which would lead to avoiding the over-fitting of the data sets. As it is shown in the figure, the best validation performance has occured at epoch 9, and after 6 error repetitions, the process is stopped at epoch 15. The results presented in Figure 4 illustrates the same ones in Figure 3.
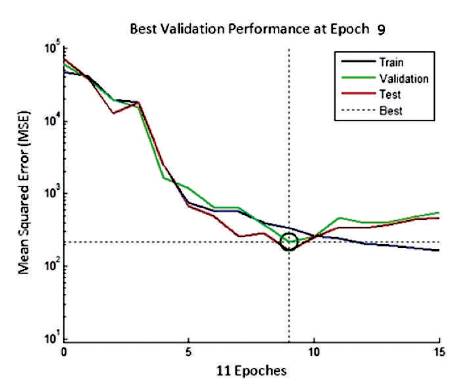
Figure 4. Best Validation Performance in Artificial Neural Network Model
Figure 5 shows the error histogram with 20 bins for the three steps of training, validation, and test in artificial neural network modeling. As it is shown in the figure, the zero error is illustrated with a yellow line in the middle with 9 instances in the training set.
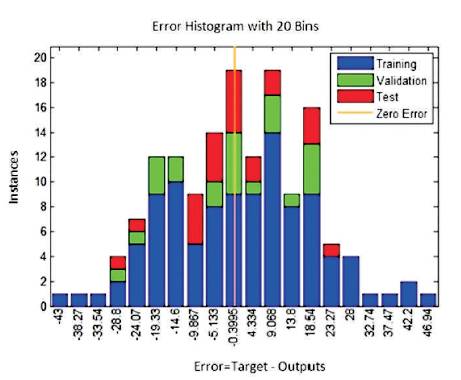
Figure 5. Error histogram with 20 Bins for the Training, Validation, and Test Steps
Figures 6, and 7 illustrate the coincidence between the target and output variables for training, and validation steps, respectively. The “Target” values imply the “Measured Compressive Strength” and the “Output” values imply the “Predicted Compressive Strength by Matlab Software”. The term “R2” is obtained by Matlab Software, which demonstrates the model efficiency. In both the Figures, “R2” confirms the acceptable accuracies of the model in both the training and validation steps.

Figure 6. Comparison between the “Target” and “Output” parameters for “Training” set in ANN model
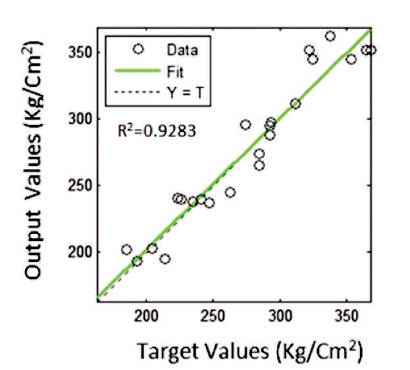
Figure 7. Comparison between the “Target” and “output” parameters for “Validation” set in ANN model
Figure 8 shows the performance of Artificial Neural Network model in predicting the 28 days compressive strength of concrete. As it is illustrated in the figure, the term R2 is equal to 0.9543, which implies efficiency of the model. The accuracy of the artificial neural network model might be due to the fact that in the ANN, the nonlinear relation between the input variables is involved. Therefore, the ANN is a reliable method for predicting the 28 days compressive strength of concrete and can be used widely in the field of Civil and Material Engineering.
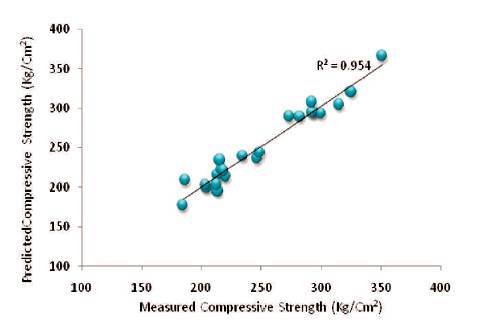
Figure 8. Comparison between the Measured and Predicted Compressive Strength by the ANN model for “Test” data
Artificial Neural Network (ANN) model is a reliable computational model to solve different complex problems such as, prediction problems. This research presents the application of artificial neural network to predict the 28 days compressive strength of concrete based on different concrete characteristics. ANN analysis indicates good correlation between the input and output variables. The statistical parameter R2 is 0.9111, 0.9283, and 0.9543 for training, validation, and testing steps, respectively, which implies a good efficiency of the ANN model.
It can be concluded that, ANN presents a good accuracy in predicting the 28 days compressive strength of concrete. Therefore, in order to predict the compressive strength of concrete with high reliability, instead of using costly experimental investigation, ANN model can be replaced.