Table 1. Condition Index of Different Airports
In this study, maintenance solutions for 19 airport pavements in New Mexico are derived based on Pavement Condition Index (PCI) and nonlinear deterioration rate. In a Pavement Management System (PMS), PCI indicates the functional condition of the pavement. In this study, a specific maintenance treatment is applied when the PCI value of a pavement section reaches a minimum defined value or cutoff value. Using system dynamics modeling, modules to quantify the benefit and Life Cycle Cost (LCC) were developed and utilized to determine the relative benefit and life cycle treatment cost of a maintenance solution or treatment. This study indicates that airports with higher initial PCI have lower functional benefit and lower LCC for maintenance solutions of different PCI improvement or PCI rises. Benefit and cost are determined using two different system dynamic modules developed in Powersim and then benefit and cost are compared using developed design charts. Benefit cost ratio (BCR) design charts are capable of showing the BCR for airport pavements having initial PCI 30 to 80, cutoff-PCI 10 to 80 and rise 10 to 40. For PCI rise 30 and 40, initial PCI 60, 70 and 80 have shown almost the same BCR for a different cutoff-PCI.
Pavement maintenance is usually based on only the Pavement Condition Index (PCI). In critical PCI method, maintenance is applied when it reaches critical PCI. Pavements having the same PCI may reach critical PCI at different ages depending on their deterioration rate. PCI deterioration rate is very important to predict future pavement condition. For different degradation rates, both load and environment are related. Without multiple year pavement distress data, it is very difficult to predict future condition and to establish a reliable deterioration rate. In few instances, linear deterioration is assumed in pavement management for simplification of the analysis. However, non-linear deterioration rate should also be used in Pavement Management System (PMS).
Relative benefit of different treatments and life cycle treatment cost are determined over the design life for different minimum acceptable conditions and condition improvements. Minimum acceptable condition means minimum threshold value of PCI, and different condition improvement means the PCI rise due to maintenance treatment. However, in Life Cycle Cost Analysis (LCCA), it is assumed that all alternatives will give the same benefit over the design life and this assumption is not always correct. Hence, Benefit Cost Ratio (BCR) should also be studied over the design life. In this study, relative BCRs are determined for different values of minimum acceptable PCI, PCI rise and initial PCI. In the current study, non-linear deterioration rates are considered and various design charts are developed.
Relative benefit, Life cycle cost (LCC) and relative BCR are determined for different pavements over the design period. Benefits and costs are studied for different minimum acceptable conditions, PCI rises, and are plotted against different initial conditions. From BCR versus cutoff-PCI, it would be easier to select a condition level where maintenance should be applied. From BCR versus initial condition results, the peak indicates the most suitable airport pavement to start pavement maintenance. BCR curves for different PCI rise helps to determine what type of maintenance should be applied. The peak of BCR curves against initial PCI signifies the most cost effective maintenance treatment type. The peak of the BCR curve indicates the most optimum treatment type and pavement type where to start maintenance. Few new outcomes are expected from this study. The difference in BCR for different initial PCI helps develop an idea about which airport should be maintained in the near future. BCR design charts also help determine the most optimum treatment type or PCI rise, and which minimum acceptable condition should be maintained. Effect of non-linear deterioration rate on different aged pavement should be studied.
The PCI for airfield pavement, roads and parking lots are published as ASTM standardsD5340 and D6433 respectively ( ASTM 2012 and ASTM 2011). The use of PCI is adopted as standard procedure by many agencies worldwide including the Federal Aviation Administration (FAA), The U.S. Department of Defense (DOD) and the American Public Work Association (APWA) ( Green et al. 2004 ). In the PCI method, maintenance is done based on the critical PCI, which is defined as the PCI value at which the rate of PCI loss increases with time or the cost of applying localized preventive maintenance increases significantly. PCI is a visual distress survey based on pavement evaluation method and minimum acceptable PCI of 55-70 are used ( Shahin, 2005). The PCI method does include some distresses that are related to structural condition, but there is no well-defined relationship between structural and functional performances ( Zaniewski, 1991). However, Structural Condition Index (SCI) only considers load related distress such as alligator crack and rutting for flexible pavements and has minimum required value of 80 ( Hicks et al., 2000).
LCCA is performed widely in PMS to select the best alternative and the optimum time for the application ( Walls & Smith, 1998). In LCCA, all alternatives are assumed to have similar benefit ( Smadi, 2004). However, the functional benefit for different alternatives is not always the same for different treatment types and different application times. Perhaps the best known method for measuring the efficiency of an activity is the benefit cost analysis ( Hass et al., 1994). Hence, the study of BCR of different maintenance treatments is more pragmatic than their simple LCCA. The BCR is defined as the ratio of the benefit divided by the cost of the application of maintenance treatments. The BCR is used to determine the relative cost-effectiveness of maintenance treatment with respect to various times of application ( Morlan, 2011). However, functional benefit achieved by a maintenance treatment solely depends on the life increase and frequency of the treatment over the analysis period, which is also responsible for LCCA. Different maintenance types have different pavement condition improvements and different expected lifespans ( Ningyuan et al., 2001).
A PMS is a complex system affected by several variables such as pavement condition, PCI improvement, deterioration rate, and maintenance timing and therefore is suitable for System Dynamics (SD) study ( Friedman, 2003, Linard, 2000). Using the SD model, the effect of maintenance type and timing can be studied for different pavement conditions at different minimum required values. Effect of maintenance time on LCC of a pavement is not analyzed adequately. Although many researchers have implemented preventive maintenance strategies, there is still very little study on determining the optimum time of application of such treatment ( Hajj et al., 2011, Peshkin et al., 2004 ). A rational methodology is needed to evaluate pavement preservation alternatives to maximize benefits ( Haider&Dwikat, 2011).
The specific objectives of the study are to:
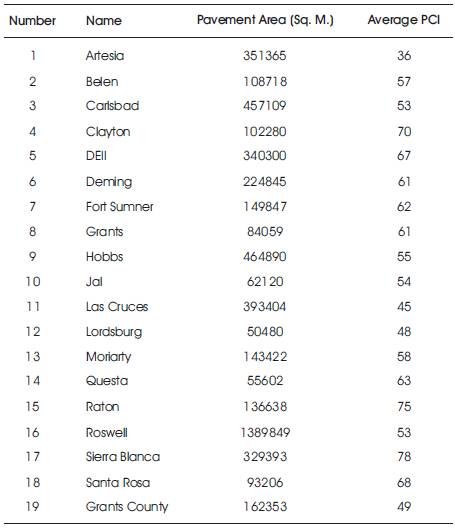
A visual distress inspection has been performed by the Aviation Division of the New Mexico Department of Transportation (NMDOT) to determine the condition of different branches (runway, apron, and taxiway) of 19 general aviation airports in New Mexico (NM). PCI was determined for various pavement sections of the airports based on the survey data. The area weighted average PCI of the 19 airports are shown in Table 1.
Table 1. Condition Index of Different Airports
This study focuses on the effects of maintenance treatments on functional benefit and LCC. Maintenance is applied when PCI reaches minimum required PCI or cutoff-PCI. Benefit analysis and LCCA were performed using PCI data collected by the visual distress surveys. Benefit cost results for different current PCI aids in determining the optimum time of maintenance application. No condition deterioration data was available. Therefore, only one year of data was given as input. Pavement condition was assumed to deteriorate non-linearly, which will be discussed in the next section.
Pavement deterioration models consider the network and project levels of pavement management. Two basic types of models are deterministic and probabilistic, which are further classified into primary response, structural, functional and damage for the deterministic type, and survivor curve and transition for the probabilistic type. Prediction models can be broken down into four basic types for operational purposes:
The State of Washington developed a set of regression equations, based on a long-term pavement performance database of the form:

where
PCR = pavement condition rating, scale of 0 to 100,
C = 100,
m = slope coefficient,
A = age of pavement, years,
P = constant which controls the shape of the curve.
Table 2 provides an example listing of the standard or default performance curves for Washington State PMS for different pavement types. The nonlinear analysis equation for new or reconstructed asphalt concrete type has been used in this study. No deterioration data is available for NM airports; hence the deterioration equation from a renowned PMS with greater data points has been used in this study. As there is a lower traffic condition for NM airports, the deterioration equation previously developed for newly or reconstructed pavements have been used. For different PCI rise, the same deterioration rate after the corresponding age has been used. A different benefit module has been used, which has taken the nonlinear deterioration rate as input instead of the linear deterioration rate.
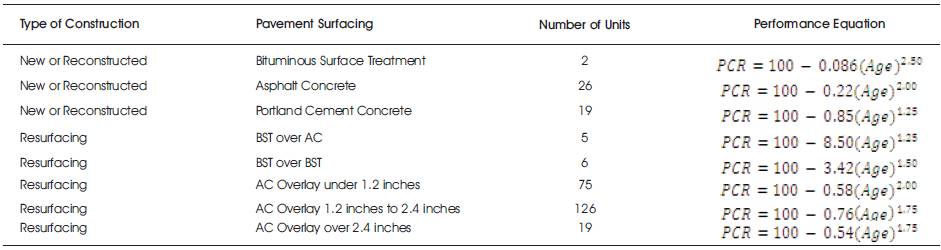
Table 2. Standard Performance Equations
System dynamics is a modeling technique, which determines the variation in a specific parameter with time. It contains a conceptual model or flow chart that describes the processes included in the model. The conceptual model identifies the variables and their interconnections. Storages and flows are the building blocks of a conceptual model. Storages are the accumulators in the system and help characterize the state of the system. Flows indicate the rate of movement of the commodities in and out of the system. Values and relationships for each storage and flow are to assign in the form of constants, equations or data tables. System dynamic model describes cause-effect relationships of its different variables and handles continuous interactions between its parameters.
A system dynamics module was developed in this study to determine the relative functional benefits of different maintenance strategies known as benefit module. Pavement condition without any maintenance or do nothing condition and condition after maintenance treatment were used as storage in this module. Pavement condition deterioration rate was used as outward flow in the model. The do nothing deterioration rate and the deterioration rate after maintenance were determined by using Eq. (2).
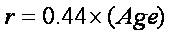
where r=PCI Deterioration Rate, Age = Age Variable (in years) of the pavement, which is the function of initial PCI (for do nothing PCI) or PCI after maintenance (for any maintenance treatment or rise).
Initial pavement conditions and minimum cutoff conditions were used as constants, which can operate the do nothing condition changes and timing of condition improvement or maintenance treatment in the entire analysis period. Different initial condition indices were used for different airport pavements. Other system dynamic model parameters used in this module are shown in Table 3.
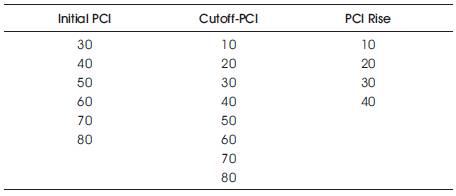
Table 3. System Dynamics Model Parameters
The benefit module helped draw the relationship of the relative benefit of pavements of different conditions with different minimum acceptable conditions, condition improvements and deterioration rates. It applied a treatment whenever pavement condition reached the minimum acceptable limit. The condition curve after maintenance is known as the maintenance condition curve. The do nothing condition curve and the maintenance condition curve were used to determine the relative functional benefit of a treatment or PCI rise. Figure 1 shows the procedure to determine the relative benefit using those two curves. The relative benefit is the ratio of the benefit area (B) or the area under the maintenance PCI curve over the area under the do nothing PCI curve (A) up to the terminal value of PCI. The terminal value of PCI is used as the minimum PCI or 0.
The LCC module determines the life cycle cost after taking output values from the benefit module as input, including maintenance year, corresponding PCI and PCI rise. As the unit cost of major maintenance varies depending upon PCI when the treatment is applied, the unit cost of the maintenance treatment can be estimated from the benefit module. The PCI after last maintenance, maintenance deterioration rate, and last maintenance spend life also are the output of the benefit module and were used as inputs in the LCC module to calculate salvage Net Present Worth (NPW). The pavement area is assumed to be the same for all airports, which is 10,000 square meters. A 4% discount rate and 20- year analysis period are assumed as these values are used widely in pavement maintenance practices. Maintenance & Rehabilitation (M&R) Cost NPW, Salvage NPW, NPW, and Equivalent Unit Annual Cost (EUAC) are calculated for different PCI rises at different minimum acceptable PCI. EUAC is the annual cost of different maintenance applications over the entire analysis period and is obtained from the total NPW of maintenance treatments. Unit cost to increase PCI to 100 depends on the current PCI in the following manner:
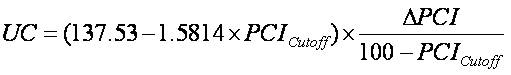
where UC is the Unit Costs of a maintenance treatment in dollars required to maintain a per square meter of pavement area and PCIcutoff is the minimum acceptable PCI.
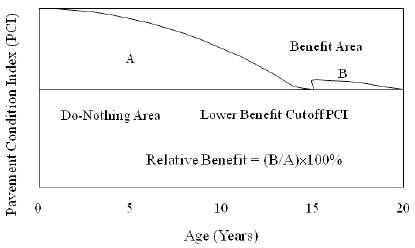
Figure 1. Conceptual illustration of benefit areas and do nothing areas
In the benefit module, condition indices were used as stock and deterioration rate was used as flow. To determine the do nothing condition of a pavement section in the analysis period, is the first step to follow in benefit module. The do nothing condition depends on two factors, the initial index value and the deterioration rate. If PCI deterioration rate of a specific pavement section is unknown, do nothing PCI deterioration rate can be determined by using Eq. (2). Rehabilitation is applied when PCI reaches minimum acceptable value.
Maintenance is applied when the do nothing PCI reaches a minimum acceptable value in the PCI based study. Figure 2 shows the conceptual benefit model where the diamond and the circular symbols are active tools for constant and for auxiliary respectively. The rectangular box represents active tool for storage, and the circular sign with valve indicates the flow with rate.
In this study, initial PCI and minimum acceptable PCI were considered as inputs. Initially, the do nothing PCI was equal to the initial PCI and it decreased with time because of the deterioration rate. When the do nothing PCI reached the minimum acceptable PCI, this module applied a maintenance treatment with an assigned PCI rise. Different PCI rises were taken for this current study. After application of a maintenance treatment, the PCI value improves by the PCI rise value and the revised PCI is known as maintenance PCI. Values of 10, 20, 30, and 40 were used for the PCI rise and minimum cutoff-PCI values of 10- 80 were used for all 19 airports.
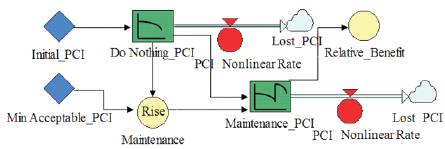
Figure 2. Benefit Module
To determine relative benefit for different initial PCI, PCI rise and cutoff-PCI of a newly developed module was used. The nonlinear module used variables like initial PCI, PCI rise, cutoff-PCI and deterioration rate. As a deterioration rate, the nonlinear module used age dependent equations used by Washington State PMS. Relative benefit is obtained by dividing the area under the do something curves by the area under the do nothing curves similar to the linear module. As initial PCI, PCI 30 to 80 was used with cutoff-PCI 80 to 10. 10 to 40 PCI rise was used. LCC module was used to determine the LCC.
Figure 3 shows do nothing and do something PCI deterioration curves for nonlinear benefit module. This figure shows analysis output for initial PCI 60, cutoff-PCI 40 and PCI rise 20. For this instance, benefit area and do nothing area was obtained as 745 and 260, respectively, which showed 14.32% benefit per year. As deterioration rate, Washington State PMS equation was used. Pavement PCI reached at 40 in 2015 and a maintenance treatment of 20 PCI rise was applied. Do something PCI again reached cutoff-PCI 40 in 2018 where second maintenance treatment was applied. The number of treatments applied in the 20-year analysis period was 6, having a unit cost of $24.76 ea. per square meter. The unit cost was calculated using the following equations. EUAC was obtained for a $7.00 per square meter pavement area. Benefit Cost Ratio (BCR was found at 2.03 for this instance, which indicates the relative functional benefit was achieved after a $1.00 investment in a year in a square meter of pavement area for pavement restoration).
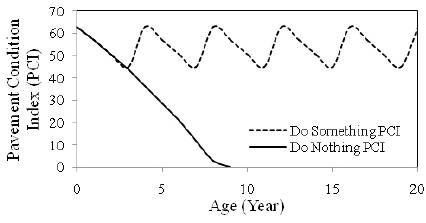
Figure 3. Nonlinear do something and do nothing condition curve
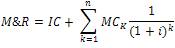
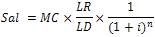
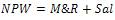
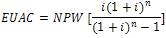
where i = discount rate, k= year of expenditure, n = analysis period, MCk = Maintenance treatment cost at year k, IC = Initial Cost, LR = Last maintenance remaining life, LD = Last maintenance design life, NPW = Net Present Worth, M&R = Maintenance and rehabilitation NPW, Sal = Salvage NPW.
EUAC is particularly useful when funds are used on an annual basis; therefore, it is well suited to pavement maintenance treatment evaluation. Where, NPW discounts all costs to a single base year, which can then be compared, EUAC discounts all alternative activities to a yearly cost, which can then be compared.
Benefit module dynamic response of PCI and SCI due to maintenance treatment can be seen and these responses can be used in calculating benefit and cost for the analysis period. Analysis period and discount rate are used from a typical airport project. Benefit results and LCC results for all sections of the current study for this study are discussed in the following sections.
Relative BCR is simply drawn from dividing relative benefit by EUAC. As EUAC was for a 1000 square meter area, it is converted for a unit area before using it to get the BCR. It is also divided by the analysis period to get the BCR for a year. BCR signifies the airport pavement, achieved the relative functional benefit after a $1.00 investment in a year in a square meter of a pavement area for pavement restoration. Several BCR design charts were developed using system dynamics modules, which helped determine BCR for different initial PCI, different cutoff-PCI, and PCI rises.
Figure 4 shows the effect of cutoff-PCI on relative BCR for nonlinear analysis. Figure 4(a), Figure 4(b), Figure 4(c) and, Figure 4(d) show the results for PCI rise 10, 20, 30 and 40 respectively. Different curves on a graph indicate BCR for different initial PCI. Figure 4 shows that a higher rise always gives higher BCR and a specific maintenance always gives a higher BCR if it is applied on more deteriorated pavements. For rise 10 and for a specific initial PCI, maximum BCR was obtained for maximum cutoff-PCI. However, as PCI rise increases, it shows different slopes and for rise 40, cutoff-PCI 40 and 50 show almost the same BCR. If several cutoff values show similar BCR like this, then the most cost effective treatment should be applied. For PCI rise 30 and 40, initial PCI 60, 70 and 80 show almost the same BCR. The dashed line indicates the average BCR of all pavement maintenance of all data points obtained for a specific maintenance or rise. This line helps to identify a maintenance treatment that will give good results or BCR values, more than the average BCR obtained for that particular rise.
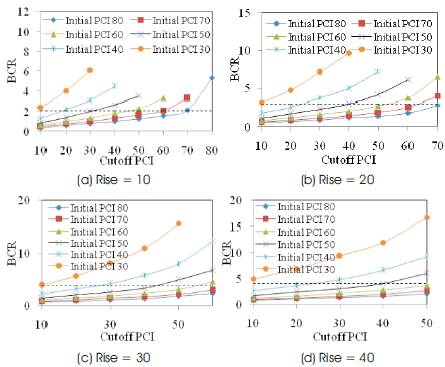
Figure 4. Effect of cutoff-PCI
Figure 5 shows the effect of PCI rise on BCR for nonlinear analysis. It indicates that the higher rise always gives a higher BCR for a specific initial PCI and cutoff-PCI. The dashed line indicates the average BCR for maintenance of a different rise for a specific initial PCI. For an initial PCI 80, rise 10 gave maximum BCR and, for a specific PCI rise, the highest cutoff-PCI always shows the maximum BCR. In nonlinear analysis, maximum cutoff-PCI always shows maximum BCR unlike the linear analysis. Figure 5 indicates that for a different initial PCI, a different PCI rise shows almost the same BCR for a lower cutoff-PCI.
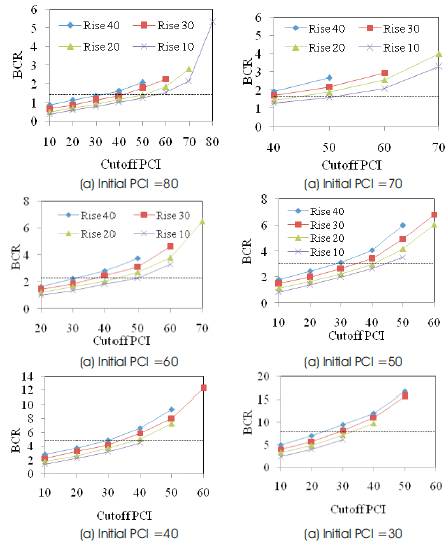
Figure 5. Effect of PCI riseon BCR