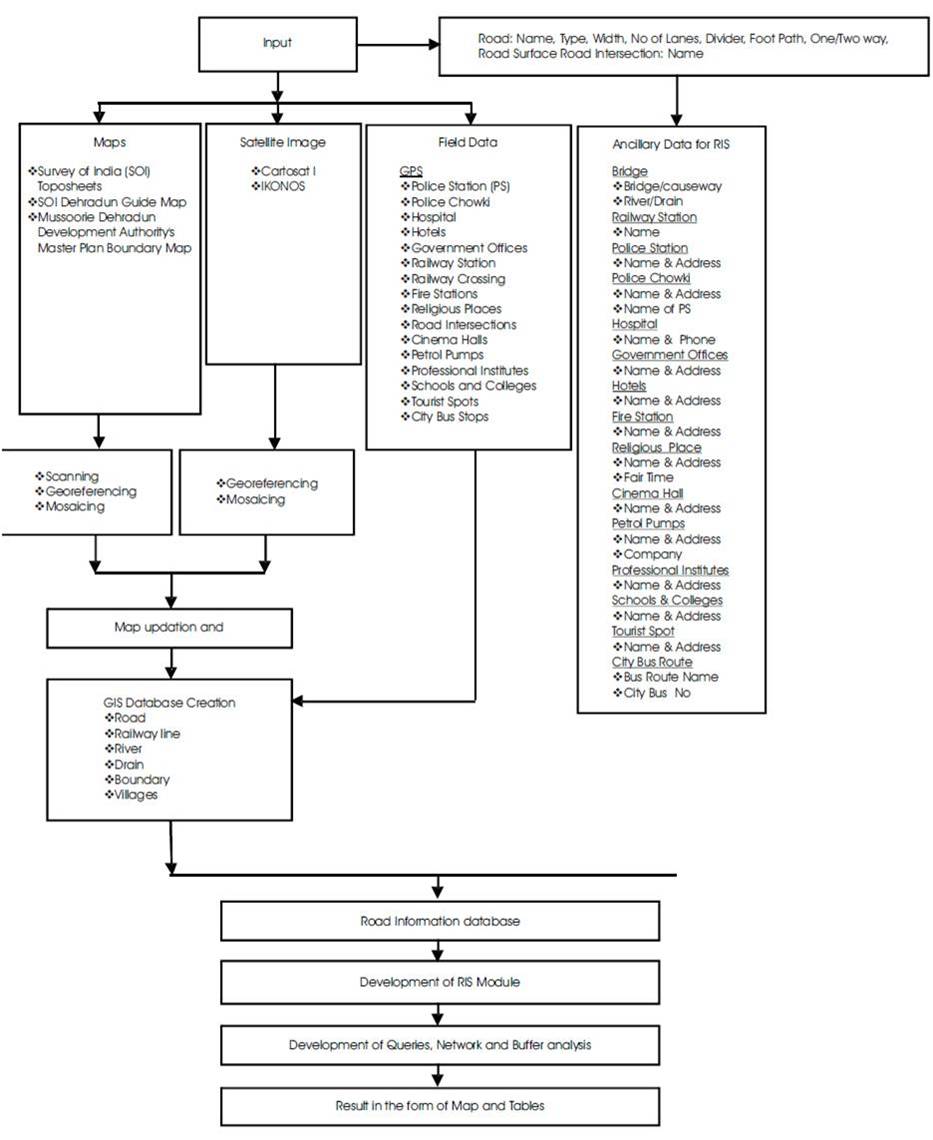
Figure 1. Methodology
A Road Information System (RIS) has been developed as a component of Road Information and Management System (RIMS) for Dehradun urban agglomeration with the main objective to obtain accurate, up-to-date roadway information which may result in reduced travel time. It provides road information, like geographical location, wayside amenities like petrol pumps, police stations and chowkis, fire stations, government offices, hospital, schools and professional institutes road inventory, traffic load etc. The geospatial techniques make the process of data collection and analyses easy, faster and economical. This paper outlines the data requirement for the development of RIS.
A RIS may be defined as an integrated system for collection and storage of highway related data in a format compatible to the requirements of various user groups. The RIS is a system to collect and distribute road information (information on the weather surrounding roads, constructions, regulations and so on) so that road managers can manage roads safely and effectively. Since such road information has been broadly provided for general road users too, an even more and reliable system would be required. RIS can thus be used to improve the system's reliability, and provide road information in a real-time manner.
RIS is consolidated, interrelated and analytical information on the highway component characteristics, based on continuously updated data, readily available at the users end. Information would include all highway components like geographical location, asset, traffic, pavement, bridges, accidents, operating level of service and costs, environment, etc. RIS, would provide information of a highway as a whole or by its individual link stretches. RIS helps in rational, quick and on time decision making, optimizing resources, equitable distribution of resources, minimizing costs, maximizing productivity of highway users, prolonging the life of assets, minimizing life cycle costs, measuring level of service and improving environment.
The system developed in GIS environment provides information with geo-references coordinates. Such system is client oriented, flexible with large number of attributes and provides connectivity between spatial and non-spatial database as well as with networking facilities.
An Integrated Road Information System 8.0 (IRIS 8.0) (1998) [2] [3] has been developed by the Association of Oregon Counties (AOC) which has 36 counties and the population varying from approximately 2000 to over 600000, specifically for use by the counties of Oregon to acquire and maintain data concerning the roads and related objects contained within the Oregon counties. IRIS provides a seamless method for any Oregon Road Department to have a complete computerized road inventory system in a Microsoft Windows environment. IRIS 8.0 is a Microsoft Windows application designed and built in the Microsoft Visual Basic programming environment.
As per the study of Schwartz (2009) [6], the road network is broken down into net-nodes, legs, branches and road-nodes according to instructions regarding the road database. Stock-data (i.e. road network data) consist of longitudinal and cross-sections, superstructure (pavement), longitudinal and cross inclination, structures, road signalling, traffic volume, costs for measures and their depreciation. Additionally, secondary data are stored, e.g. (i) Accident data, usually filed by the police, Weather data, providing information about the road conditions at specific (especially critical) times (fog, black ice, aquaplaning), (ii) Information about sewers, water pipes, power and telecommunication lines needed for supply and waste disposal of road appurtenances and building structures. The sewers are an important factor in connection with the transport of oil and of other dangerous or special goods, especially in the case of accidents, (iii) Real estate information including diverse rights governing utilisation of the lots for road use.
Centre for Development of Advanced Computing (C-DAC) (2006) [1] has developed GIS-enabled Road Information Management and Monitoring System (GRIMMS), which provides GIS interface to the existing Online Management and Monitoring System (OMMS). The OMMS is the management information system for Pradhan Mantri Gramin Sadak Yojna (PMGSY) which is a popular Central Government Scheme. The PMGSY GIS project involved generation of spatial database, customisation of a standalone GIS system (GRIMMS-S) and development of web GIS (GRIMMS-Web) application (http://omms. nic.in /grimms).
National Highway Authority of India (NHAI) has developed a RIS for Golden Quadrilateral for a length of 5,846 km connecting North South East West parts of India, together. RIS comprises of computerised time series database on highways attributes, like traffic analysis, pavement condition, road inventory, asset condition on GIS interface along with economic modeling with HDM – IV software. RIS has two major groups i.e. core system and support modules. [5]
As per the information available from the source http://www.kpwd.gov.in/gis.asp for Karnataka State, a GIS based RIS has been developed by collecting data of road network consisting of National Highways (NH), State Highways (SH) and Major District Roads (MDR), Sub-divisionwise and km-wise. The data collected RIS are
Dehradun is an interim capital city of newly formed state Uttarakhand, formed in November 9, 2000. It is famous for its natural climate and beauty. The city is surrounded by Himalaya in north, and Shivalik mountains in south. In its east, river Ganga flows and in the west river Yamuna. Dehradun region lies within the jurisdiction of Mussoorie Dehradun Development Authority (MDDA) as envisaged in the master plan 2005-2025. It lies between 30° 13′ 0" N to 30° 29′ 0" N Latitude and 77° 52′ 0" E to 78° 10′ 0" E Longitude.
Figure 1 shows the data requirement and proposed methodology for developing a RIS for the study area, respectively. The data collected are SOI toposheets (53J/3, 53J/4, 53 F/15, 53 F/16) at 1:50,000 scale, guide map of Dehradun at 1:20,000 scale, printed maps from Mussoorie Dehradun Development Authority (MDDA), IRS Cartosat-1, IKONOS satellite images LANDSAT TM images, and SRTM images. Thematic layers are directly created from these sources such as roads, railway, rivers, drains, contours, etc. The framework of proposed methodology involves creation of digital layers, addition of attributes, and development of RIS and analysis from RIS.
Figure 1. Methodology
Since a large amount of attribute information, such as road characteristics and conditions, traffic data, name of river, bridges, hospitals, schools & colleges, professional institutes, police station, fire station, petrol pumps, city bus routes, tourist spots etc., is required for RIS. Intensive field visits, were carried out from 18.11.10 to 27.11.10, 13.12.10 to 16.12.10 and 15.01.11 to 17.01.11 to collect these data. These attribute information were attached with the thematic layers in GIS environment.
First of all toposheets 53F-15, 53F-16, 53J-3 & 53J-4 were geo-referenced in UTM projection and WGS 84 datum, to prepare a mosaic. From the field survey, non-spatial data, like traffic data of important junctions, tourist spots, bus routes, existing parking, road characteristics and conditions, traffic data, name of river, bridges, hospitals, schools & colleges, professional institutes, police station, fire station, petrol pumps, city bus routes etc. were collected. From these data, basic thematic layers, like roads, railways, rivers, drains, bridges, tourist spots, police stations, etc., were created in ARC Map 9.2.
From the GIS database, a number of queries can be generated to derive new maps and useful information. The module is capable of providing the results of the following queries on roads:
The module is able to solve the complex queries which may form by combining the above mentioned simple queries . The answer of few queries is tabulated in Table 1.
The module is very beneficial for traffic police /administrator, as one can get the idea that what type of sign board/signal is required and where, i.e. sign boards for hospitals or professional institutes, drive slow, signals on cross roads etc. The ideal places for drive slow sign board are schools and hospitals, for beforehand information of the drivers to drive slowly. The number of sign boards and their location can be fixed with the help of the system (Figure 3).
With the help of buffer analysis the planner can get the new locations for schools, colleges, professional institutes, police stations, and fire station. Moreover connectivity of places with the roads can be get by the buffer analysis. For example to know the connectivity of the picnic spots by all weather roads, a road buffer of 500 m is made and analysed that all the picnic spots lies within the buffer area or not (Figure 4).
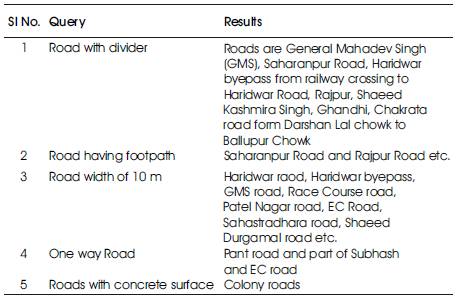
Table 1. Queries formed under different category and their results
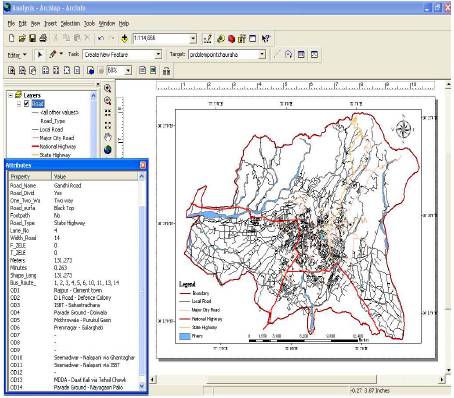
Figure 2. City bus and its origin and destination on a particular road
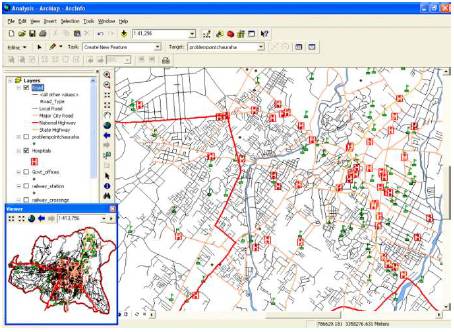
Figure 3. Placing of Sign Board
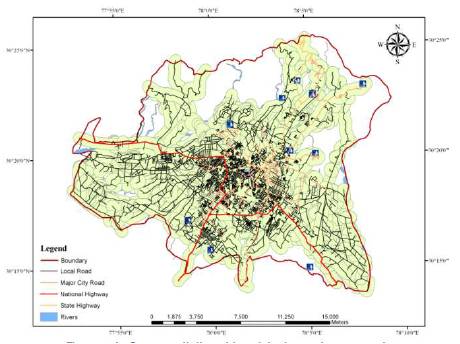
Figure 4. Connectivity of tourist place from road
With the help of network analysis, the following can be achieved:
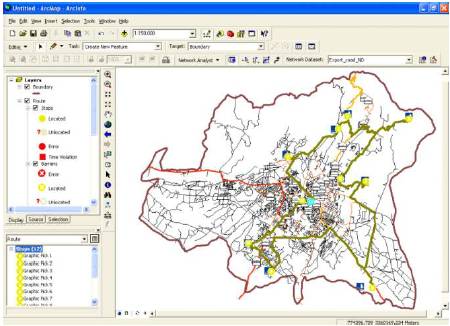
Figure 5. Shortest Route covering all the tourist Points starting and ending from a hotel at Gandhi Road
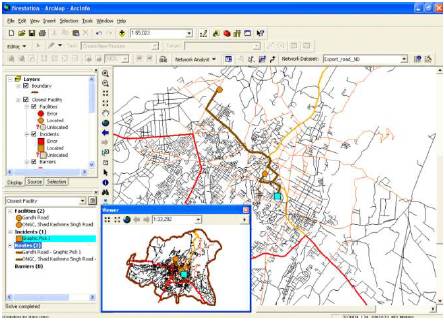
Figure 6. Minimum time requirement of a Facility situated at two different places to the point of incident
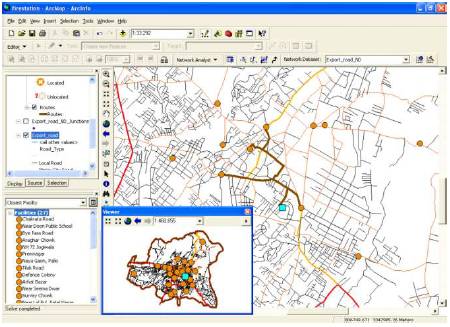
Figure 7. Minimum time requirement of a Facility situated at four different places to the point of incident
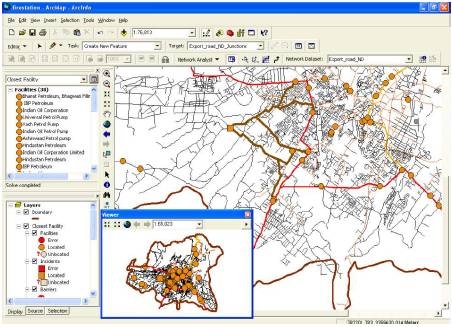
Figure 8. Locations of petrol pumps in 5000 m distance
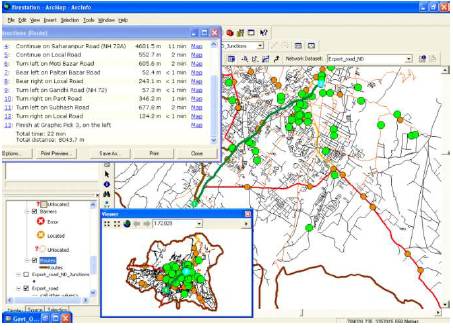
Figure 9. Minimum distance to reach a Govt. Office
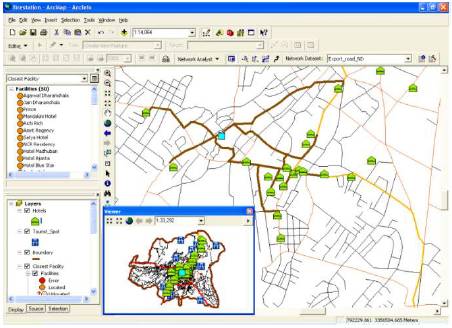
Figure 10. Hotel near an attraction
A RIS has been developed using geospatial tools. RIS can be used for generation of new information through integration of various thematic layers. Query system in RIS would help planners and decision makers to derive useful information as per need of work. It can therefore be used for a large number of applications such as, in the planning of phase wise development of new facilities and infrastructure, planning of routes for city buses, to fix the priority of roads for maintenance and to develop a new facility at the right spot etc. Remote sensing and GIS have played a great role for collection and analysis of large amount of information related with roads sector, effectively and efficiently.
The first author would like to thank the Quality Improvement Programme (QIP) Centre, Indian Institute of Technology, Roorkee for providing financial support to carry out this work which is a part of on-going Ph. D. work, and College of Technology, G. B. Pant University of Agriculture and Technology Pantnagar for providing study leave.