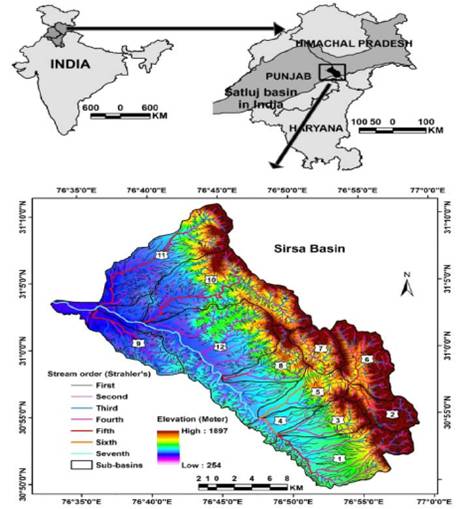
Figure 1. Location of the study area along with its relief and stream order
Morphometric analysis is more efficiently used in geomorphology and hydrology to interpret basin hydrologic behavior since Horton's period. Morphometric analysis concomitant with time of concentration and runoff coefficient are used in this study for the analysis of hydrologic responses of Sirsa basin. Toposheets-based drainage lines are used in this study; while Digital Elevation Model (DEM) data are used for relief and slope analysis. Landsat Thematic Mapper (TM) data was used to prepare land use/cover map. Some selected morphometric parameters and hydrologic behaviour of the basin as well as its twelve sub-basins were analyzed. The overall analysis of the whole basin indicates low to moderate peak flood. A sub-basin wise analysis indicates that only three higher order downstream sub-basins are flood prone. The study is very useful for watershed prioritization.
Hydrologic response of a hydrologic unit or basin is governed by its topography, underlying rock (or soil) composition and structure, surface cover and climatic condition. Geomorphological characteristics include topographical and morphological characteristics of a basin. The morphometric parameters of a basin are indicative to reflect its hydrological response because these attributes directly or indirectly control runoff generation, peak flow, flood inundation and soil erosion. Therefore, it is pre-requisite to link morphological parameters with hydrologic characteristics of a basin in understanding the hydrological behaviour, particularly for the ungauged basins.
The morphometric analysis includes relief aspects (relief and slope), linear aspects (stream order, stream number, stream length, bifurcation ratio etc.) and areal aspects (drainage density and frequency, basin shape, drainage texture, constant of channel maintenance etc.). The morphometric analysis has been popularly applied on various river basins and sub-basins throughout the world since 1940s [5](Horton 1945),[21] (Strahler 1952) ,[22](Strahler1957),[24](Strahler1964) ,[9](Leopold and Miller 1956),[13] (Morisawa 1959). Morphometric analysis has popularly been used in India for watershed prioritization and hydrologic response simulations [6](Jain and Sinha 2003),[25](Thakkar and Dhiman 2007),[7](Javed et al. 2009),[12](Mishra and Nagarajan 2010),[16](Prasannakumar 2011),[18] (Romshoo et al 2012).
Morphometric measurements using traditional methods (like planimetric measurement) are cumbersome and time consuming. Geographic Information System (GIS) in association with remote sensing data make it easy to prepare, analyze and display spatial and non-spatial data.In the present study an attempt has been made to understand hydrologic response of Sirsa basin using morphometric parameters and satellite data based land use/cover map in ArcGIS 9.3 environment.
Extending from 300 49'22” to 310 11'00” north latitudes and 760 32'48” to 760 59'22” east longitudes, Sirsa basin covers about 698 square km geographical area that mainly lies in Solan district of Himachal Pradesh, India.The study basin is an intermontane river system lying between outer Siwalik hills in the west and sub-Himalayan mountains in the east (Figure 1).
Figure 1. Location of the study area along with its relief and stream order
It is a seventh order stream and downstream tributary of Satluj river. Originating from the Kasuli–Ramshahr ranges in sub-Himalayan mountain, the Sirsa river flows along Nalagarh valley through Surajpur fault and joins Satluj River below the Bhakra dam near Rupnagar in Punjab. Numerous streams viz. Chikni nadi, Balad nadi, Ratta nadi, Surajpur Choa, Nanakpur nadi, ramnagar nadi, Kiratpur nadi, Khadiad nadi, Kanahan nadi etc. draining from the sub-Himalayan mountain and outer Siwalik join the main axial river (Sirsa river). The outer Siwalik hill is highly eroded and composed of Upper Siwalik formation of boulder, conglomerate and mudstone [15] (Philip et al. 2011).The sub- Himalayan mountain is highly elevated and composed of lower tertiary rocks. Several drainages draining from Siwalik and sub-Himalaya deposited thick quaternary alluvium in the intermontane valley (Pinjaur Dun). Soil of the basin is categorized as B and C Hydrologic Soil Group (HSG). The study basin receives about 1000 mm rainfall annually, mainly between July and September.
The Survey of India toposheets on 1:50,000 scale were georeferenced and projected in UTM projection (WGS 84 zone 43 datum) and digitized in ArcGIS 9.3 to delineate streams, basin and sub-basins. The streams were ordered using Strahler's method. The basin was divided into nine fifth order sub-basins (no 1, 2, 3, 6, 7, 8, 9, 10 and 11), two sixth order sub-basins (no 4 and 5) and one seventh order subbasin (no 12) taking fifth order streams as threshold. The Advanced Spaceborne Thermal Emission and Reflection Radiometer Global Digital Elevation Model (ASTER GDEM) of 1 arc-second resolution was used to derive relief and slope parameters. Relative relief, average slope, drainage density and stream frequency of the whole basin was derived for each of the 1 km square grid. Several selected morphometric parameters of whole basin and all subbasins were calculated based on literatures [4] Horton 1932,[5] Horton 1945 ,[21] Strahler 1952a ,[24] Strahler 1964,[19]Schumm 1956,[11] Miller 1953.
The land use/ land cover (LULC) map was prepared from Landsat TM data (acquired on 16/10/2009) using supervised classification technique in ERDAS IMAGINE 9.2.The National Bureau of Soil Survey and Land Use Planning (NBSS & LUP) soil map was used to classify soil into different hydrologic soil group. The slope map (in percent) was generated and reclassified using ASTER GDEM in ArcGIS. Runoff coefficient (C r ) map was generated by making a look up table, where a coefficient value was assigned for each combination of soil hydrologic group, slope, and land use/land cover based on literature. Area-weighted mean runoff coefficient for all sub-basins was made. Time of concentration of all sub-basins was also estimated using [8] Kirpich method (1940) to calculate time required for water to travel from the more distant part of the sub-basins
The significance of basin relief as a hydrologic parameter has been investigated by several authors [20] Sherman, 1932,[5] Horton, 1945,[23](Strahler, 1958).Relief of the study basin varies from 254 to 1897 m. Sub-basins 1, 2, 6, 7, 10 and 11 that lie in the eastern part of the basin are highly elevated.
Basin relief, calculated from DEM, of these sub-basins are also high (Table 1).The relative relief of the basin, extracted for each of the 1km square grid, shows that high relative relief zones are mainly concentrated in northern and eastern part of sub-basins 1, 2, 6, 7, 10 and 11 (Figure 2a).The grid wise average slope of the basin varies between 1.150 and 28.880 (Figure 2b); although actual or local slope of the basin varies between 00 and 600 . Sub-basin 2, 6 and 7 have high (>180 ), sub-basin 3, 5, 8 and 10 have moderate (100 - 130) and sub-basin 1, 4, 9, 11 and 12 have low (<100 ) average slope (Table 1). The high average slope of sub-basin 2, 6 and 7 infers the generation of quick runoff after prolonged rainfall [26](Tucker and Bras 1998). As time of concentration is reduced with increase of relief, hillslope and stream gradients, flood peaks increase. Thus, keeping all other conditions as constant, the greater the relief of a basin, the greater the rate of hydrograph rise [14] (Patton and Baker 1976)
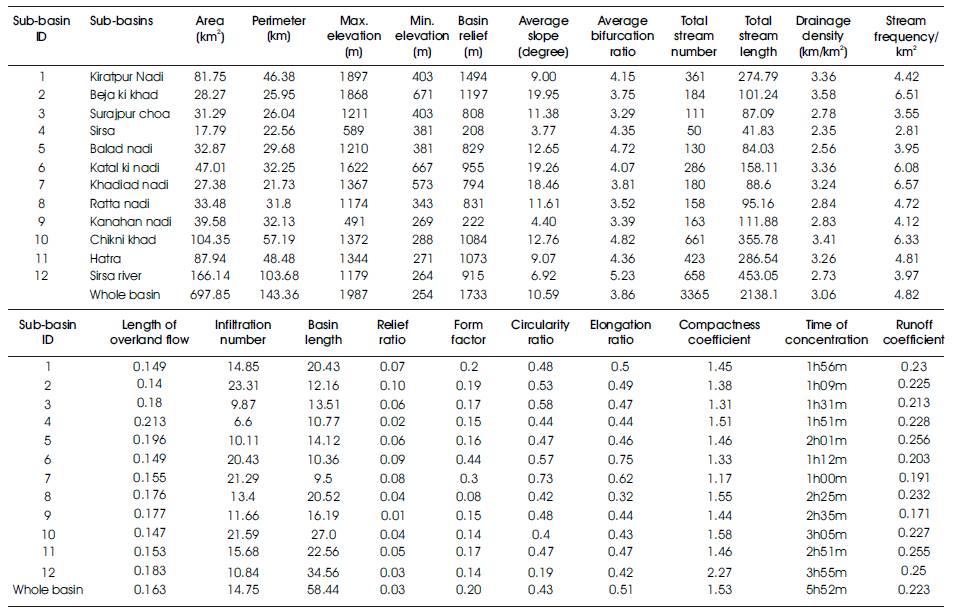
Table 1. Morphometric parameters of Sirsa basin
The bifurcation ratio (R b ), an index of relief and dissection, is expressed as ratio between stream numbers of an order to the stream numbers of next higher order [5] (Horton 1945). A normal basin in which drainage pattern is not influenced by geologic structure, R b characteristically varies between 3.0 and 5.0 [24] (Strahler 1964).Order wise stream number and R b of the basin are presented in Table 2. Though R b of the basin ranges between 2.0 and 4.55, but it is more or less constant. Average bifurcation of the sub-basins (Table 1) varies less significantly, it was found that sub-basins associated with less vegetation cover and agriculture dominated land have high bifurcation ratio.
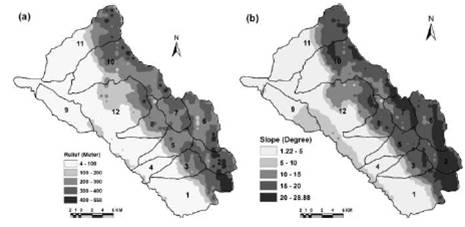
Figure 2. Relative relief (a) and average slope (b) of the Sirsa basin
Stream length ratio (RL ) is the ratio of mean stream length of a given order to that of next lower order. Stream length, mean stream length and stream length of all order are presented in Table 2. In the basin, RL varies between 1.19 and 3.96.
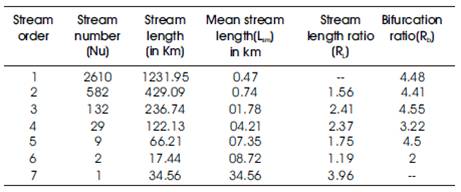
Table 2. Linear morphometric parameter of Sirsa basin
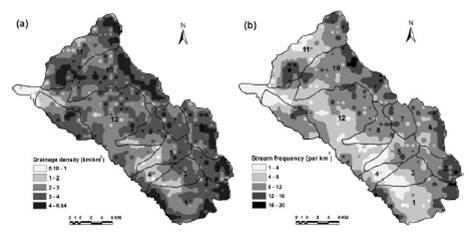
Figure 3. Drainage density (a) and stream frequency (b) of the study basin
Drainage density, expressed as the length of the channel per unit of drainage area, is influenced by several variables, including the relief, rainfall, infiltration capacity, and resistance of the land to erosion [5] (Horton, 1945). . Drainage density (Dd ) reflects the efficiency of basin to remove excess rainfall [14] (Patton and Baker 1976). In the study area, grid wise Dd varies between 0.10 and 6.84 km/km2(Figure 3a), whereas for the whole basin it is 3.06 km/km2. Sub-basins 3, 4, 5, 8, 9 and 12 have low Dd (<3 km/km2 )and sub-basins 1, 2, 6, 7, 10 and 11 have high drainage density (>3 km/km2 ) (Table 1). Low Dd was associated with the sub-basins which have low absolute and relative relief. Sub-basins that fully or partly lie in the alluvial plain are highly permeable and have high infiltration capacity. This results in less generation of runoff. High Dd of the sub-basins reflects a highly fragmented relief with a relatively rapid hydrological response to rainfall events, whereas low Dd infer a slow hydrologic response from the sub-basins [10] (Melton 1957)..
Stream frequency (F), i.e the number of stream segments of all orders per unit drainage area, are controlled by several factors like, rainfall amount, resistance of rock to erosion, permeability, structure of rock, basin shape, tectonic influences etc. [4] Horton 1932. [5] Horton 1945. In the study ,high frequency zones are noticed in sub-Himalayan ranges; outer Siwalik hills and Pinjaur Dun which are characterized by low stream frequency (Figure 3b). High frequency in the sub-basins 2, 6, 7 and 10 (Table 1) indicates that the sub-basins are moderate to highly impervious and well drained. On the contrary, moderate frequency of sub-basins 8 and 11; low frequency of sub basins 1, 3, 4, 5, 9 and 12 (Table 1) implies that they are associated with moderate to low relief, semi-permeable to permeable soil and moderate to highly eroded surface. Overall, the analysis shows that the sub-basins 2, 6, 7 and 10 have high and quick peak discharge than others.
Length of overland flow (Lg ) is one of the most important independent variables that affect both, the hydrologic and physiographic development of a basin. According to [5] Horton (1945) . Lg is the length of flow path from a point on the drainage divide to the point of adjacent stream channel and is expressed as half of the reciprocal of drainage density. In the present study L g or Sirsa basin is 0.16. Lg of the sub-basins varies from 0.14 to 0.21(Table 1). Low Lg value (<0.15) of sub-basin 1, 2, 6 and 10 indicate that slope is high and flow path length is short which in turn governs the quick hydrologic responses. High Lg (>0.15) of rest of the sub-basins infer low slope, long flow path and slow hydrologic responses.
Infiltration number (If ) is defined as the product of drainage density and stream frequency per unit basin area. It gives an idea about the infiltration characteristics of the basin. The higher If indicates low infiltration and high runoff and vice versa. In the sub-basins If values vary between 6.60 and 23. 31(Table 1), whereas it is 14.75 for the whole basin (Table 2). It was found that sub-basins 2, 6, 7 and 10, composed of lower tertiary and Siwalik rock formations showed high If (>20) and consequently, have high runoff potential. Rest of the sub-basins in which more than 50% area are formed by loose alluvium of quaternary period have low and high infiltration capacity.
Relief ratio (Rh ) is the ratio between maximum basin relief and basin length [19] (Schumm 1956).Rh measures the overall steepness of a drainage basin and is an indicator of the intensity of erosion processes operating on basin slopes [24] (Strahler 1964).It has close relation with sediment delivery rate [19] Schumm 1956.[3] Hadley and Schumm 1961.In the present study sub-basin 2 has highest Rh and is followed by sub-basins 6 and 7 (Table 1). High Rh of the sub-basins, due to high elevation and steep slope, implies high sediment loss and high kinetic energy of streams. On the other hand,sub-basins 4, 8, 9, 10 and 12 have low Rh value. Low relief and gentle slope cause low relief ratio and therefore, less sediment loss.
[19] Schumm (1956) defined the basin length (Lb ) as the longest dimension of the basin parallel to the principal drainage line. Lb has great influence on shape and hydrologic response of a basin. As lag time and time of concentration are dependent on Lb , probability of flood and immediate runoff in a small basin are reduced with the increase of Lb . Lb of Sirsa basin is 58.44 km. The basin lengths of all sub-basins are enlisted in Table 1. The large Lb (>20 km) of sub-basins 1, 8, 10, 11 and 12 gives an indication about slow but steady hydrograph. Sub-basins 2, 3, 4, 5, 6 and 7 that have low Lb (<15 km) may responsed quick during storm. The sub-basins with large L b may discharge high amount of runoff and sediment than others.
Quantitative expression of basin geometry was made by [5] Horton (1945) through form factor (Rf ) which is expressed as the ratio between basin area (A) and the square of basinlength (Lb ). The value of Rf for the whole basin is 0.20 that indicates elongated shape of the basin. For the sub-basin sit varies between 0.08 and 0.44 (Table 1). Sub-basin 6 has highest Rf value (0.44) and was followed by sub-basin 7 (0.30), whereas sub-basin 8 has lowest Rf value (0.08). This indicates that sub-basins 6 and 7 are relatively circular in shape than other sub-basins. Low Rf of rest of the sub-basins indicates low side flow for shorter duration and high main flow for longer duration and vice versa [17] Reddy et al. 2004. [16] Prasannakumar et al. 2011.
Circularity ratio [11] (Miller 1953). a dimensionless measurement of basin shape, is defined as the ratio of basin area (A) to the area of circle (Ac ) having the same perimeter as the basin. The circularity ratio (Rc ) is influenced by the relief and slope of the basin, drainage density and frequency, lithology, land use/cover and meteorology [1] (Ahmed et al. 2010). The Rc of the Sirsa basin is 0.43 which indicates that shape of basin is elongated. Rc of the sub- basins (Table 1) varies from 0.19 (sub-basin 12) to 0.73 (sub basin 7). Sub-basins 2, 3, 6 and 7 have high Rc (>0.5) among all sub-basins. This shows that rest of the sub-basins are less circular in shape and may produce low peaked hydrograph. Table 1 also reveals an inverse relation of Rc with sub-basin area (Singh 1970)
Elongation ratio (Re ) is defined as the ratio between the diameter of a circle having same area to the basin and maximum basin length [19] (Schumm 1956).The Re of the Sirsa basin (0.51) indicates that the basin is near elongated in shape. Re for the sub-basin (Table 1) varies between 0.32 (sub-basin 8) and 0.75 (sub-basin 6). Re of all sub-basins, except sub-basins 1, 6 and 7, is below 0.50 which indicate that most sub-basins are elongated in shape. The low Re of sub-basins indicates their high susceptibility to erosion and high sediment transport [17] (Reddy 2004).
Compactness Coefficient, Cc (Gravelius 1914) is the ratio of perimeter of the basin to the circumference of circle having the same area of that of the basin. Low value (1.0) indicates high compactness and circularity of basin and vice versa. The Cc of the Sirsa basin is 1.53. The highest and lowest values of Cc of the sub-basins are 2.27 and 1.17 respectively (Table 1). Low compactness of sub-basins 2, 3, 6 and 7 infer quick and high peak discharge.
From the analysis of sub-basins geometry, their hierarchy in drainage network and relief distribution it can be inferred that the sub-basins are less prone to generate peak flood excluding sixth and seventh order sub-basins (4, 5 and 12).
Time of concentration (Tc ) is the maximum time required to travel water from furthest point of watershed divide to its outlet. It is a most important parameter that determine the time of peak discharge from a basin. We used Kirpich method [8] (Kirpich 1940) . to estimate Tc . The equation is expressed as:
Where, Tc is time of concentration in minutes, L is the length of longest watercourse in the basin and S is the average slope of the watercourse. Table 1 shows that sub-basin 12 has largest Tc (3h 55m) and low Tc for sub-basin 7 (1h). Approximately same Tc of sub-basins 2, 6 and 7 creates high peak discharge to sub-basin 5 just 1 hour after prolonged rainfall. Similarly, sub-basins 1 and 3 create high peak discharge to sub basin 4. Tc of sub-basins 9, 10 and 11 (Table 1) indicate probability of high peak flood at downstream of Sirsa river near the confluence with Satluj.
The basin is dominated by agriculture land (36.31%), open forest (23.56%) and dense forest (22.56%) cover. The detailed land use/cover distribution of the whole basin and sub-basins are presented in Table 3 and Figure 4. The forest cover is mainly found in Siwalik hills and sub-Himalayan mountain, whereas agricultural land is predominant in Pinjaur dun. The built-up area is concentrated at piedmont and alluvial plan region (Pinjaur dun). Barren lands that include bare rock surfaces, waste land and sandbar are scattered throughout the basin. The sub-basins 2, 6 and 7 are mainly covered with dense forest. While, combined cover of open and dense forest share over 50% area in sub-basins 2, 3, 5, 6, 7, 9 and 10. Sub-basins 1, 3, 4, 8, 9, 10, 11 and 12 are agriculture land dominated. Dominant builtup area is noticed in sub-basin 4, while moderate built-up area is found in sub-basins 5 and 12. Sub-basins 2, 6, 7, 10 and 11 have very low (<5%) built-up area.
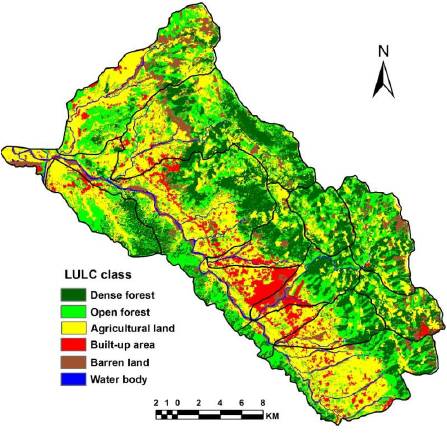
Figure 4. LULC of the basin
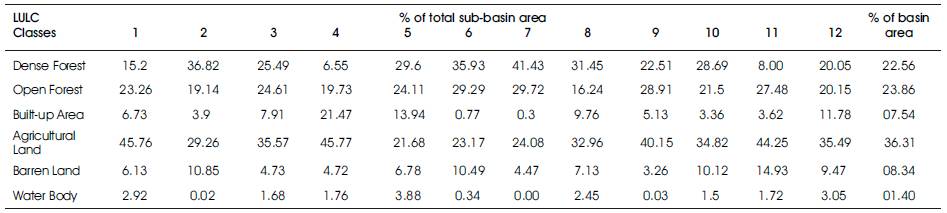
Table 3. LULC distribution of sub-basins and basin
The runoff coefficient (Cr ) is the fraction of precipitation that drained out from a basin. it is estimated as ratio of runoff to total rainfall [2] (Church et al. 1999).The runoff coefficient determines the ability to generate runoff of a basin. The low coefficient signifies low runoff generation from a basin and vice versa. In this study, after combining reclassified LULC, soil and slope map, a look up table was generated using literature based coefficient value to prepare runoff coefficient map. The average Cr of all sub-basins, presented in Table 1, was estimated using zonal statistics option in ArcGIS. The C of the basin (average 0.23) is shown in Figure 5. Sub-basin wise average Cr varies between 0.171 (sub-basin 9) and 0.256 (sub-basin 5). The high Cr (>0.25) is found in sub-basins 5, 11 and 12. The low Cr (<0.20) are noticed in sub-basins 7 and 9. The result infers that sub-basins 5, 11 and 12 are highly capable of generating runoff than other sub-basins.
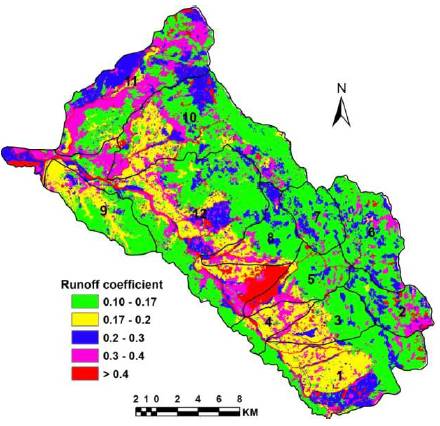
Figure 5. Runoff coefficient map of the basin
This study has made an attempt to analyze hydrologic responses of Sirsa basin and its twelve sub-basins using morphometric technique in geospatial environment. The basin is normal and near-elongated. High relief, high slope and short basin length of sub-basins 2, 6 and 7 are able to generate quick and high peak discharge. Morphometric analysis along with time of concentration and runoff coefficient of sub basins also indicate that there is a tendency of floods in sub basins 4, 5 and 12 because of its downstream position in alluvial plain just below the sloppy mountainous sub basins (2, 6 and 7), where slope drops rapidly. Sub basins 2, 6, 7, 10, 11 and 12 are hydrologically more efficient to transport water and sediments than other sub basins. The high stream frequency and fine drainage texture of sub basins give an indication about low to moderate infiltration and, both, moderate to high runoff and sediment loss. The study also shows that geospatial tools along with remote sensing data are highly efficient and less cumbersome for scientific analysis of basin hydrologic behaviour.
The first author is grateful to Council of Scientific and Industrial Research (CSIR), New Delhi for providing financial support for the present research work. The authors are also grateful to Dr. Y.V.N. Krishna Murthy, Director, IIRS, Dehradun and Head, Department of Geography, Banaras Hindu University for providing all the necessary facilities and support to carry out present work.