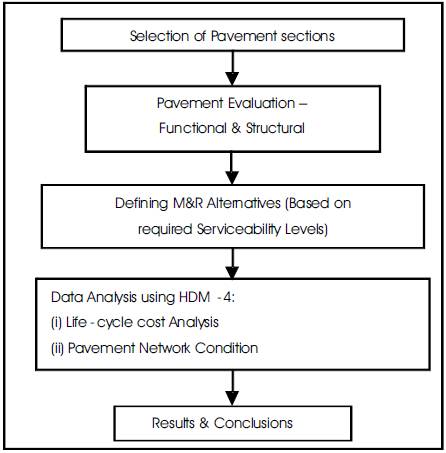
Figure 1. Study Methodology
The level of service defines the appropriate level of maintenance and the priority placed on the work. These levels can be used in planning, performing and evaluating the various maintenance activities with available funds. According to Indian codes, the priorities for levels of service are set for three possible levels of maintenance funding viz. (i) desirable level (highest level of funding) (ii) average level (iii) acceptable level (lowest level of funding). The main objective of a pavement maintenance management system is to provide a scientific tool to maintain roads at desired serviceability levels. It is also well accepted fact that due to paucity of funds it is not possible to provide the highest level of serviceability and hence there's a need to evaluate the pavement conditions at lower serviceability levels.
This case study demonstrates the determination of fund requirements for maintaining the urban pavement sections as per three serviceability levels defined as desirable, average and accepted. The analysis has done using HDM-4 (Highway Development and Management Tool)shows the effect of changing the serviceability level on varying fund requirements and the pavement network condition. Also, the effect of applying the deferred maintenance to the urban pavement sections due to scarcity of funds is analyzed. The 23.7 Km road length of Noida urban city, near Delhi is selected for this study.
One of the fundamental aspects in the field of road design and maintenance is the evaluation of both current and future conditions of street and highway infrastructure. The 'Serviceability' of roads and its evolution through time is a concept widely accepted by pavement engineers and professionals to evaluate road quality and conditions. Pavement Serviceability is a concept representing the level of service which streets and roads offer users riding vehicles.
Some past studies related to maintenance serviceability levels and their effects on maintenance funds are narrated in brief. Aggarwal et al. [2004] determined the fund requirements for maintenance of National Highways as per different serviceability levels. Al-Suleiman et al. [2007] estimated the effect of maintenance cost on pavement serviceability by developing a statistical relationship between maintenance cost and pavement serviceability rating before and after maintenance. Reigle, J.A. & Zaniewski [2002] discussed the development of a probabilistic model for deriving flexible pavement designs, generating preservation strategies, and evaluating the life-cycle agency and user costs for each alternative.
An attempt has been made in this study to determine the effects of maintaining the urban pavement sections at different serviceability levels. Three serviceability levels viz. high, medium and low are considered as M&R (Maintenance and Rehabilitation) alternatives for selected urban pavement sections for analysis. The methodology adopted for this case study is shown in Figure 1.
Figure 1. Study Methodology
Few studies conducted related to urban pavement maintenance management are narrated here in brief. Battiato et al. [1994] conducted a study and implemented the PMS for the main urban roads in the municipality of Padua, Italy. Chen, X. et. al [1994] described the project-level pavement design and maintenance subsystems of URMS. Sohail, et. al [1996] discussed about the URMS (Urban Road Management System), the network-level implementation for two cities of Texas viz. Lampasas and Terrell. Rawat [1998] and Jain, et al [1999] developed a prototype PMS for urban roads, collecting traffic and pavement condition data on a number of road sections located in different areas of Delhi. Naidu, et. al [2005] made an attempt to select optimum maintenance strategies and to develop PMMS (Pavement Maintenance Management System) based on economics of life cycle costs using HDM 4 for the inner ring road of Delhi. Project analysis and programme analysis components of HDM 4 were used for developing PMMS. Prakash, et. al [2009] developed a Maintenance Management System (MMS) for an identified Urban Road network of Patna City using HDM-4.
The study area includes total 23.70 Km road network consisting of 11 road sections, of Noida, a satellite town of Delhi capital of India. The details of selected sections are given in Table 1.
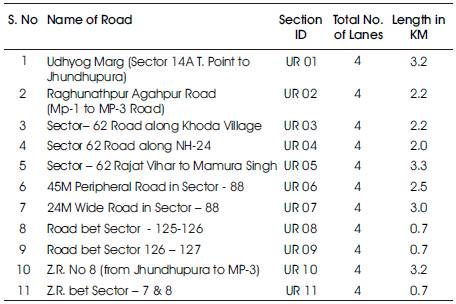
Table 1. Urban Road Sections Selected for Study
The input data for this study were created as per the HDM-4 requirements and named as 'Noida Pavement Network' and 'Noida Vehicle Fleet'.
The details collected under 'Noida Pavement Network' included:
The results of functional and structural evaluation conducted on the selected pavement sections are given in Table 2.
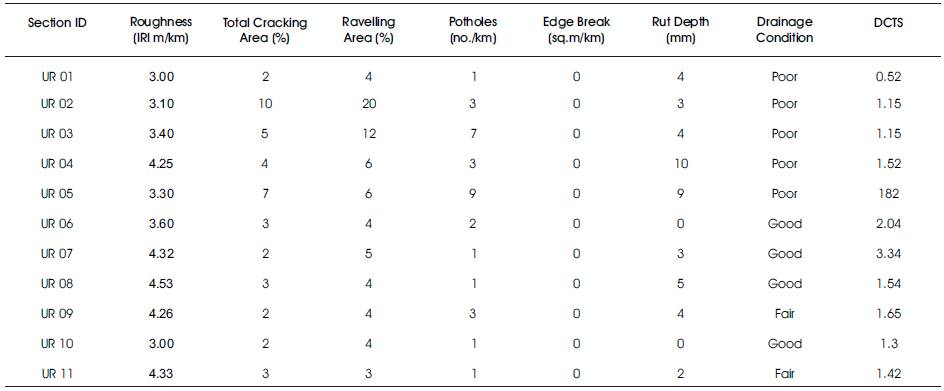
Table 2. Functional and Structural Evaluation of Pavement Sections
The details collected under 'Noida Vehicle Fleet' included:
Maintenance levels of service are needed to (i) effectively communicate maintenance planning and maintenance performance expectations, and (ii) aid in the evaluation of maintenance performance. Each pavement section should be substantially maintained at the level of service designated for the current level of funding.
Suggested serviceability levels and the limiting levels of surface defects based on measurement of roughness, cracking, rutting etc. as per “Guidelines for Maintenance of Primary, Secondary and Urban Roads”, MORT&H [2004], are given in Table 3.
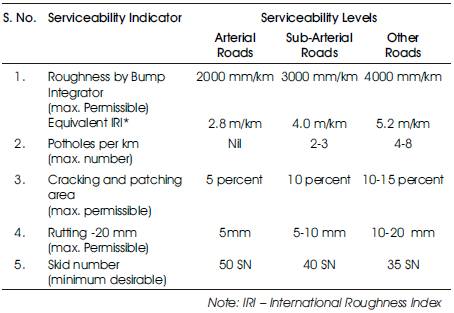
Table 3. Levels of Serviceability for Urban Roads
The above levels of service are given as per categories of urban roads. For analysis purpose in this study the above standards were considered equivalent to three levels of services viz. desirable, average and acceptable and the effect of maintaining selected sections at these levels was evaluated.
Four alternative M&R strategies have been defined for each road section on the basis of desired level of serviceability to which the road section is to be maintained. The selected M&R alternative strategies, M&R works and their respective intervention criteria are shown in Table 4. The optimum M&R work was found by performing the programme analysis in HDM 4 [Kerali et al. 2000]. All these M&R strategies are effective from the start year analysis period i.e. 2011.
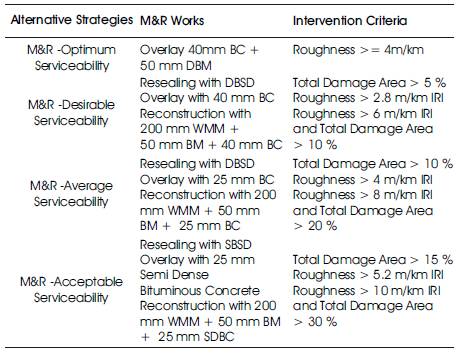
Table 4. Details of Selected M&R Strategies
After selection of the alternative M&R strategies, the programme application is run and the road works summary, as applicable under each M&R strategy, is obtained along with the costs for the same. The total year-wise fund requirements as obtained from this analysis are shown in Table 5. A graphical representation of total fund requirements, under each M&R strategy, over the analysis period of 10 years is shown in Figure 2.
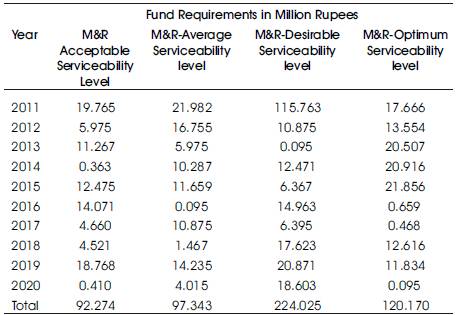
Table 5. Fund Requirements for Each Maintenance Strategy
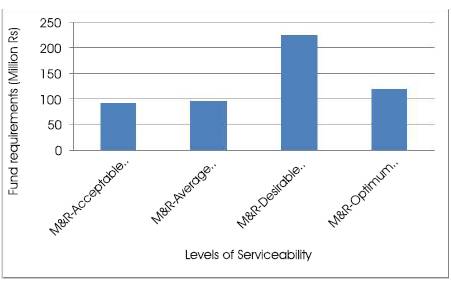
Figure 2. Fund Requirements for Each Serviceability Level
The above results indicate that the funds requirements for maintaining the selected pavement sections at the desirable level of serviceability is about 86 per cent more that those required for maintain it at the optimum level of serviceability. It would be possible to maintain the same pavement sections at an average level of serviceability at about 30 per cent of funds required for obtaining optimum serviceability. The funds requirement for maintaining all selected pavement sections at the acceptable level of serviceability would only be of the order of about 23 per cent. But as per the prevalent practice of allocation of funds in India, only 50-60 per cent funds are available for maintenance management of National Highways [MORT&H, 2001]. With such kind of fund allocation, it would not be possible to maintain all the pavement sections either at high or even at medium level of serviceability. However, the available funds would be sufficient enough to maintain these sections at the lower level of serviceability.
The average condition of the pavement network has been presented by the average roughness value (in terms of IRI m/Km) under the different M&R strategies as shown in Figure 3. The roughness progression is showing quite an expected trend with the various maintenance strategies.
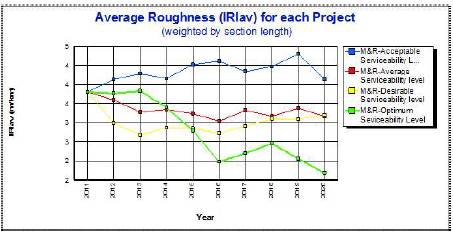
Figure 3. Pavement Network Condition under each M&R Serviceability Level
This part of the study demonstrates the effect of not taking up the maintenance when it is due, may be because of unavailability of funds altogether and thereby deferring the maintenance to subsequent years. The main objective of this analysis is to show how the condition of the highway network will get affected because of this postponement in taking up the requisite maintenance and rehabilitation activities.
The input data for this case study includes all 11 sections. Four alternatives M&R strategies namely; M&R-2011, M&R-2012, M&R-2013, and M&R-2014, have been defined for each pavement section of the highway network. In each M&R strategy, the M&R works and the intervention criteria is such as to maintain the various pavement sections included in the highway network at their respective levels of serviceability, but the starting year of application of M&R strategies is different in each case.
The average condition of the highway network under the different M&R strategies has been represented by the average roughness value in terms of m/km IRI, and the same has been shown in Figure 4.
It is quite evident from Figure 4 that the average roughness value of the highway network will not change much if the maintenance is delayed by one year(IRI is 5m/km in 2012), but in case the application of maintenance activities is deferred by two years, the roughness value will rise very sharply to 8 m/km IRI in the year 2013. A further delay of one year will cause rise in roughness value up to 12 m/km IRI in the year 2014, there by deteriorating the pavement completely requiring a reconstruction. This will result in very high vehicle operation cost for the road users. Thus, it may be concluded on the basis of this case study that deferring the maintenance activities has a very detrimental impact on the overall condition of the highway network. Therefore, the M&R activities should not be delayed much from the time they have been triggered by the respective intervention levels.
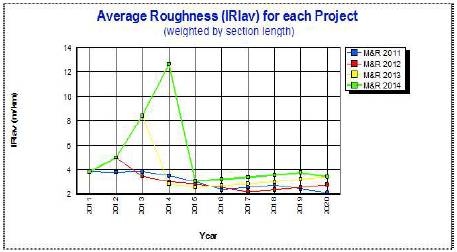
Figure 4. Pavement Network Condition under each M&R strategy