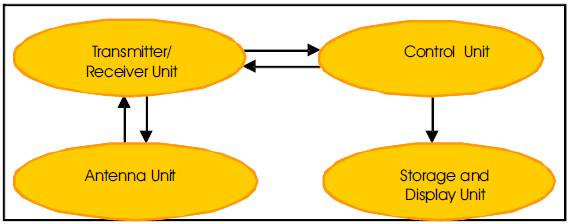
Figure 1. Basic Components of a GPR System
The application of Ground Penetrating Radar (GPR) for pavement evaluation is relatively new concept in India, especially for transportation infrastructure study to evaluate its defects and condition rapidly, continuously and non-destructively. The images of the studied pavement section containing underground utility (here metallic water pipes & electric cables are taken) items show hyperbolic signatures and by using velocity calibration by hyperbolic matching approach it is possible to determine the depth and leakage status. But, generally the main problem that is encountered in the analysis of the GPR image is the occurrence of false hyperbolic signatures which may appear due to the reflection from nearby big trees, houses and overhead bridges/ under ways. It is therefore, important to resolve the issue of detection of false target in air by GPR. Thus, in the present work practical data have been acquired using 250 MHz ground coupled GPR from the areas having big objects that can interfere with the GPR images. The GPR signatures of the trees, fly over and overhead pathway have been collected, and based on the GPR acquired velocity (from GPR image) of the electromagnetic (EM) wave propagating through the ground has been analyzed to differentiate between the air objects and the ground objects. After analysis it has been found that if the GPR extracted velocity is within the range of (0.050 m/ns to 0.150 m/ns), it represents all sorts of ground materials (generally used for construction) under various moisture conditions (presence of huge water to dry condition), and the object is under the earth surface. Whereas, if the velocity is above 0.19 m/ns or 0.200 m/ns and above represents false air events i.e. object is in air. This work can provide technical assistance to the beginners involved in the GPR based manpower development programmes.
Ground Penetrating Radar (GPR) technology has been used to assess pavement performance and damage detection for the past 30 years in a variety of ways. Currently the GPR based inspection of road pavement is actually becoming a standard technique for monitoring and maintenance program for the problems largely related to the structural damage of the infrastructure, despite the challenges lying in the electronic data processing (Angio,C. et al., 2003).Till today most of the transportation agencies are dependent upon destructive methods to evaluate layer thicknesses and the properties of pavement layers which include digging test-pits and extracting cores from the pavements. These methods provide relatively accurate thickness measurements, but at the same time it is time consuming, hazardous and requires traffic control yet provide limited point specific information and hence, they cannot be reliably used to find defect areas (Benedetto and De Blasiis, 2001; Maser, 1996). That means the limitation is due to the road data collection by core samples taken at discrete locations of road. The digging and extraction of cores cannot be performed frequently since it adds to the pavement distress by causing man-made defects (Al-Qadi and Lahouar, 2005), whereas GPR based survey provides significant advantages over the traditional methods as (a) this is the only technology that can be used at highway speed to provide subsurface information about the pavement structure (using air coupled antenna) and can be considered very safe with respect to the static traditional measurements and (b) GPR methods are not destructive especially when compared to the traditional drill core methods, therefore, they can be considered cost effective. In spite of that, it has the limitations in terms of interpretation of GPR data which is mainly because of the fact that the backscattered signals collected by GPR depend largely on the unknown dielectric properties of the structural materials and also it cannot detect different layers unless they have sufficiently dissimilar dielectric constants (Loizos and Plati, 2007). The dielectric constant of the Hot Mix Asphalt (HMA) material is of great importance because it can usually be correlated to its density, air voids, moisture contents and asphalt content (Maser 1992) and this dielectric constant for new pavement systems, can be estimated non-destructively from the GPR-collected signal amplitudes (Maser 1996). Further, GPR data collection can be used to target concurrent invasive investigations to optimize the analysis of variable urban pavement structures. Thus it can also be utilized to maintenance treatments and methodologies (Evans et al., 2006).
There is another problem that is frequently encountered during data analysis and interpretation of the data acquired from the areas having underground utility lines (here metallic water lines and electric cables have been considered), that is the appearance of false targets hyperbolic images in the GPR data. These false hyperbolic signatures appears in the GPR image data due to the reflections from the surrounding objects in air like big trees, building, overhead bridges and under paths and these false targets are known as air events. These hyperbolic images may be mistaken as signature of underground pipe lines (objects) which are not present physically. The problem related to the analysis and interpretation of the data corresponding to underground pipe lines for the detection of its actual presence must be solved. Keeping the above mentioned points in mind and to solve the issue related to air events, 250 MHz ground coupled GPR has been used for the identification and distinction of the air events (objects) from the underground lying utility lines (objects). Various roads in India including the roads under the Moti Bagh flyover, New Delhi, road under the underway connecting the Civil Engineering building to Transportation Engineering block in Indian Institute of Technology Roorkee (IITR), Roorkee, and the road under the big trees in the IIT campus have been surveyed using GPR. As per the documents available there are no pipe lines under the targeted sections of study in New Delhi flyover, under the road surface in IITR campus. Further, the roads survey has been conducted on the roads having undersurface pipe lines to compare the image results of the actual subsurface utility services with the false target images. Here, the velocity of the GPR has been determined by calibrating it with the help of hyperbolic calibration approach and verified by digging and measuring the depth of the detected pipe line. Whenever the GPR passes over the pipe lines buried under the ground, a hyperbolic signature is produced representing the presence of a pipe line, and then using an option available on the GPR system a new hyperbola is synthetically generated which is then tried to fit and matched with the hyperbolic signature of the pipe until it is fully fit. When the two hyperbolic signatures are fully matched, the exact velocity of the electromagnetic wave passing through the ground is extracted by the GPR system. This process is also known as velocity calibration by hyperbolic matching method. These velocities obtained corresponding to actual pipe lines present under the ground/ road sections in all the surveys have been collected, and compared with the velocities of similar hyperbolic false signatures, to find out their velocity values to differentiate false & actual ground objects in GPR image.
The RADAR (Radio Detection And Ranging) is a well established technique that uses radio waves to detect objects and determine their distance from echoes they reflect (Loizos and Plati, 2007). The GPR is a special kind of radar which moves on ground and sends electromagnetic pulses to penetrate the ground and collects back the backscattered signals from the ground. This technique is used for the detection and locating the targets in the structures. By monitoring the amplitude and time delays between the signal peaks from different layers, it is possible to evaluate both layer dielectrics and thicknesses. A variety of GPR systems are available for the purpose of survey but the primary components of all the GPR systems are the same (Bala at el. 2012) as shown in the Figure 1. The antenna unit of the GPR system transmits and receives radar signals. The transmitter/receiver unit consists of a transmitter for signal generation, a receiver for signal detection and timing electronics for synchronizing the transmitter and the receiver. The control unit controls the overall operation of the GPR system and sends the received data to the data storage and display unit (Loizos and Plati, 2007). For pavement evaluation purposes, air-coupled and ground-coupled antenna systems are used. Ground coupled antenna based GPR is shown in Figure 2.
Figure 1. Basic Components of a GPR System
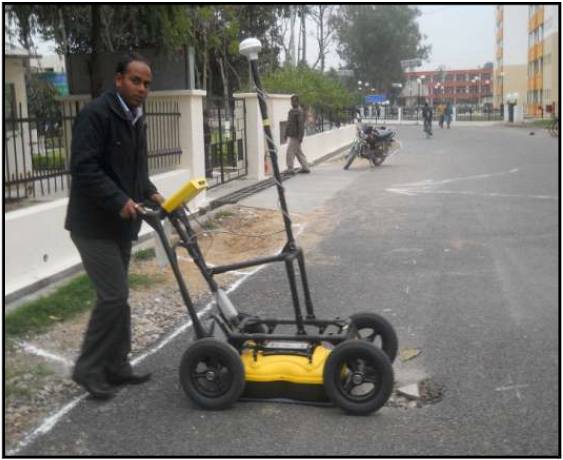
Figure 2. Ground Coupled GPR
It acquires data at lower speed as it is moved by operator. The drawback in the air coupled GPR is that the penetration depth is limited in comparison to that of ground-coupled GPR. The thickness of each layer can be accurately known if the dielectric constant of the corresponding layer is known. There is limited literature available for the calibration of the ground coupled GPR and so, its use for the estimation of the dielectric constant is difficult. Whereas, for the air coupled GPR systems, the estimation of the dielectric constant of pavement layers can be computed using the amplitudes of the reflected pulses collected by the GPR system (Maser, 1996; Al-Qadi et al., 2006). The majority of today's GPR technology is based on ultra-wideband (UWB) impulse radar principles due to its high time resolution and because of the depths at which most targets are located (Daniel, 1996). The velocity of electromagnetic waves (EM) propagating through a media is a function of its dielectrics and therefore, the dielectric constant can be alternatively taken in terms of velocity of the electromagnetic wave passing through the medium. Here, the ground coupled GPR has been used for the data collection and the velocity parameter has been chosen as the indicator of the ground changes. The velocity of the EM wave is lower (different) when the soil is wet, and the velocity is of the EM wave is higher when the soil is dry. Here, the parameter for the distinct identification of the false air events and the signature of the actual subsurface utility has been chosen as the EM velocity. In fact, in air the velocity of EM wave is of the order of 0.300 m/ns whereas, in the ground the velocity of EM wave ranges from (0.18 to 0.19 m/ns) maximum value to (0.03 m/ns) the minimum value corresponding to different ground materials under dry and high water condition respectively. Standard values of dielectric constants are available in literature (Loizos and Plati, 2007) and also can be seen in (Evans at el. 2007). These dielectric values which can be converted into equivalent velocity values.
In New Delhi, under the Moti Bagh flyover (Figure 3a and 3b) a small section has been surveyed using 250 MHz ground coupled GPR. As per the subsurface layout documents available with the local highway authority no utility lines are present in the road section under study and at the survey spot. Still the hyperbolic signature has been noticed in the GPR image as shown in Figure 3c. In Figure 3c it is clearly seen that no utility lines are present below the flyover within the length section of 0 m to 30 m and 40 m to 60 m. The velocity has been calibrated using hyperbola fitting method and been found equal to 0.248 m/ns. Data has been collected in line format which means GPR is pushed along a line. In the image (Figure 3c) within 0 to 30 m and within the depth range from 5 m to 10 m bright and dark wavy thick signature is seen which is due to the reflection of EM waves from the roof of the flyover. The velocity of EM wave obtained by GPR is seen on the white vertical space in the left side of the GPR image data (Figure 3c).
Figure 3c is the GPR image corresponding to the area as shown in Figure 3a and Figure 3b i.e. under the Moti Bagh flyover. The air event (the reflection from the flyover is seen in this GPR image i.e. Figure c) is easily noticed as an inverted hyperbola with red colour. Velocity of EM wave corresponding to this hyperbola has been estimated and the velocity shows the hyperbola structure is an air event as its velocity is close to that of EM velocity in air.
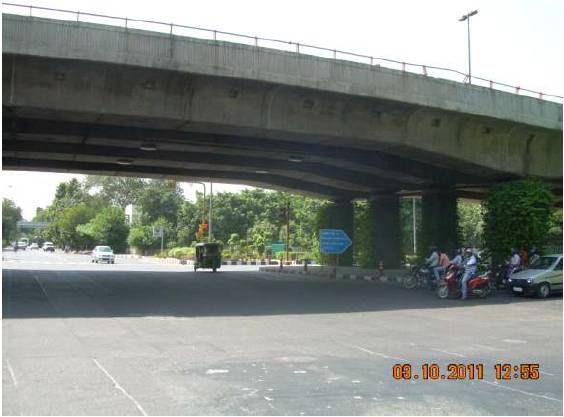
Figure 3a. Moti Bagh Flyover before data Collection
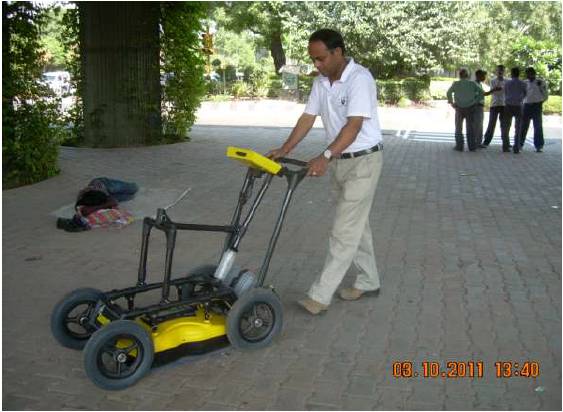
Figure 3b. Data Collection by Ground Coupled GPR
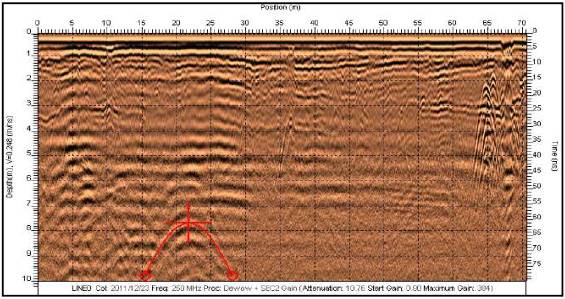
Figure 3c. No utility lines present within 0 m to 30 m and 40 m to 60 m length under the flyover. Still hyperbolic signature is seen at 8 m depth and red colored velocity calibration tool has been used for velocity extraction
It can be clearly noticed in GPR image (Figure 3f) that the velocity obtained by GPR is 0.300 m/ns which is the velocity of EM wave in air. The velocity has been found by hyperbolic fitting method. This is the velocity of light (EM wave) in vaccum or in air. So, the object, whatever it is, is present over the ground in air. Data collection using 250 MHz ground coupled GPR is shown in Figure 3d and 3e. Figure 3f is the GPR data obtained while passing under the overhead pathway. The EM velocity is seen on the left vertical space of the GPR image (Figure 3f).
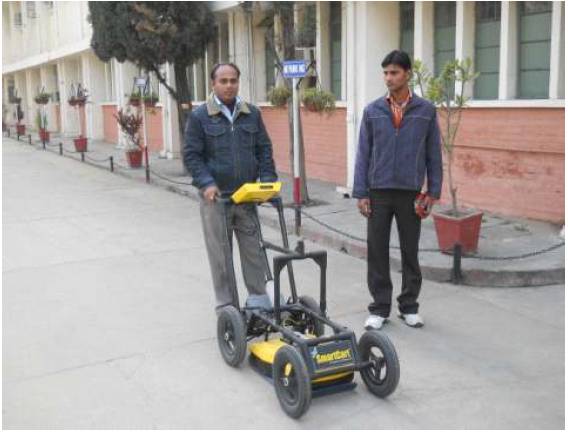
Figure 3d. GPR based Data Collection
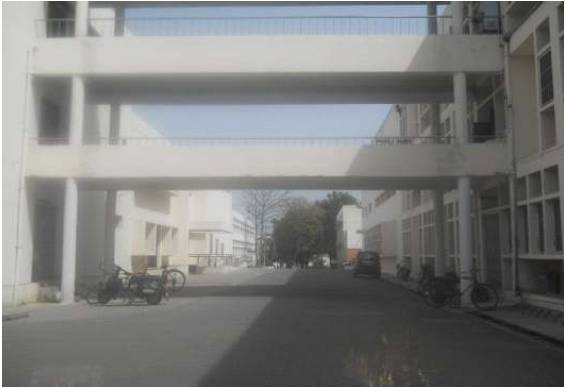
Figure 3e. Overhead pathway in Civil Department
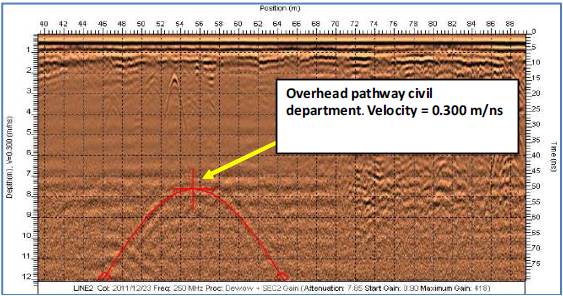
Figure 3f. Hyperbolic Signature of Overhead Path way in Civil Department of IITR
The roads having huge trees have been chosen for the GPR survey to see the range of velocities achieved by the reflections of these trees. Whether or not there is any impact of these trees on the GPR image can be seen by the values of velocities and the identifying the false air events. It is interesting to note that the EM velocity obtained using GPR is closer to the velocity of EM waves in air indicating that the detected hyperbolic images are simply air events and not the pipes lines under the road surface. Figure 3g, 3h, 3i & 3j are the site crowed by all sorts of trees. In Figure 3k, the EM wave velocity obtained (0.231 m/ns) indicates that the hyperbolic signatures do not indicate physically buried utility lines they represent trees. It has been verified by the subsurface layout plan available with the concerned authority.
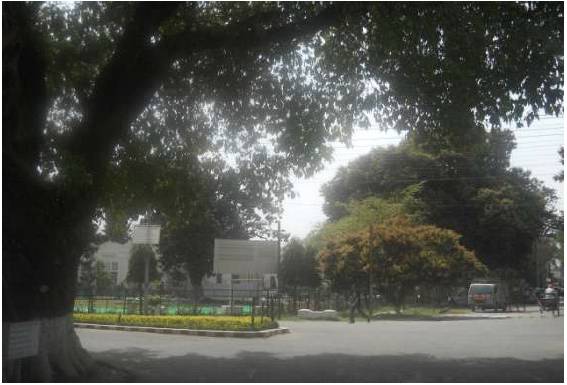
Figure 3g. Huge Tree Chosen for Data Collection
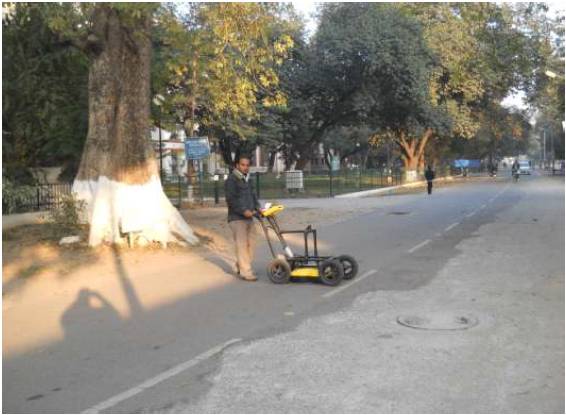
Figure 3h: GPR Data Collection below Tree
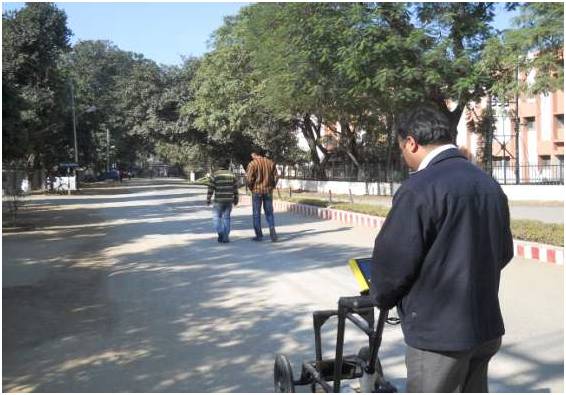
Figure 3i. GPR Survey below Dense Trees
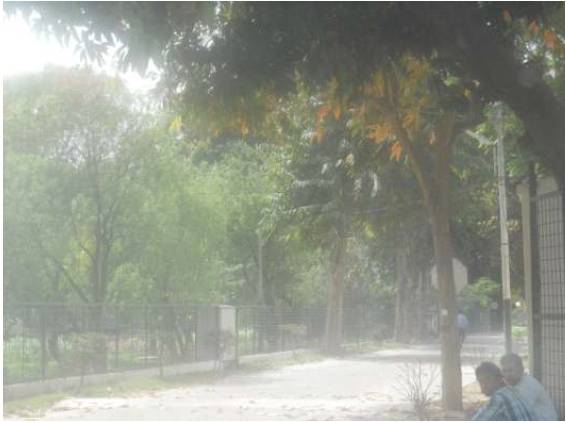
Figure 3j. Tree surrounded area for GPR study
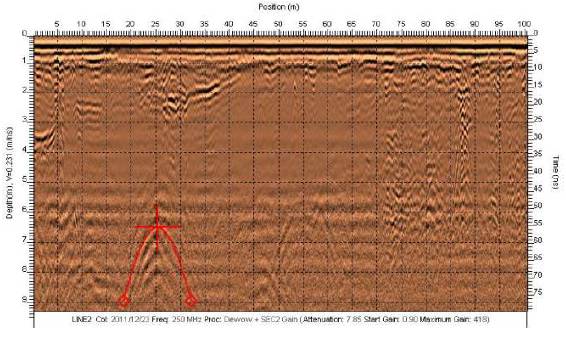
Figure 3k. GPR acquired image: Hyperbolic signatures of trees appear as false underground pipe lines
250 MHz GPR based data has been collected from the residential area having multiple cables & metallic pipes (Figure 3l, 3m, 3n) and the velocity of the EM wave has been monitored through GPR using hyperbolic velocity calibration approach. On the basis of velocity of EM wave extracted by GPR it can be said that all the hyperbolic signatures are actual underground cable or metallic pipe lines and not the air events. The velocity obtained after GPR calibration is 0.116 m/ns as can be seen in the GPR image (Figure 3o) and can be observed on the depth scale of the GPR image. Velocity is 0.101 m/ns (Figure 3p).
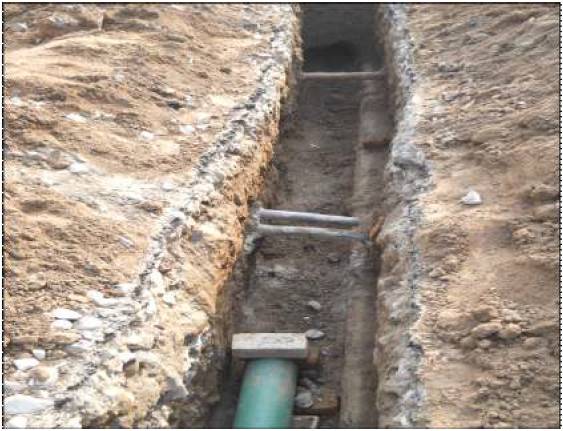
Figure 3l. Metallic water lines
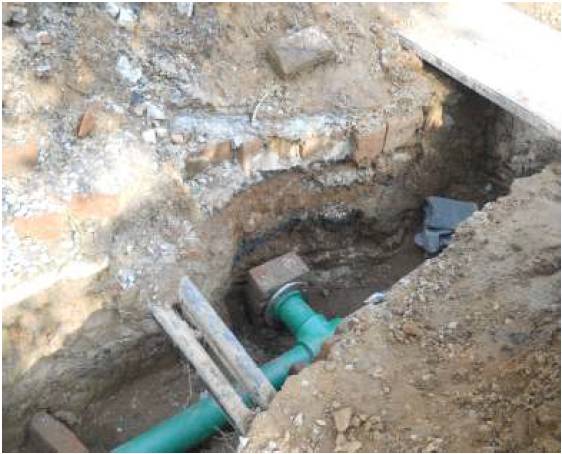
Figure 3m. Electrical cables
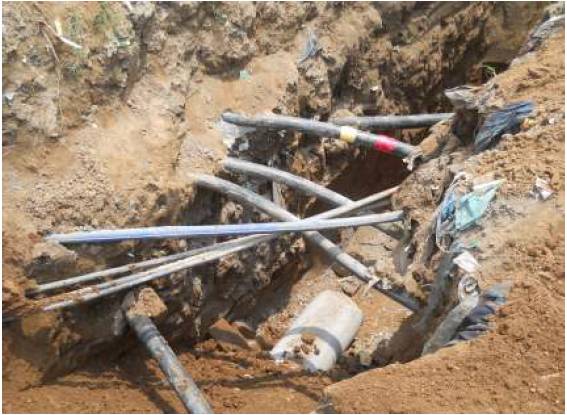
Figure 3n. Electrical cables
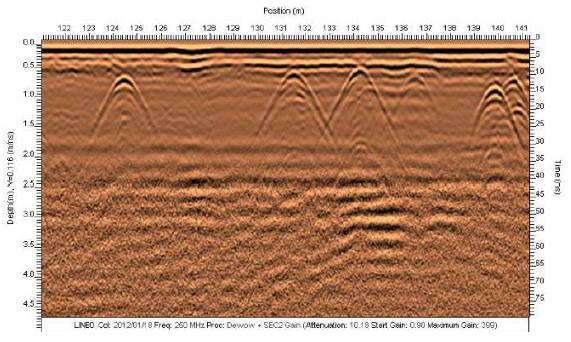
Figure 3o. Hyperbolic signatures of the underground cables and water pipes. Velocity = 0.116 m/ns
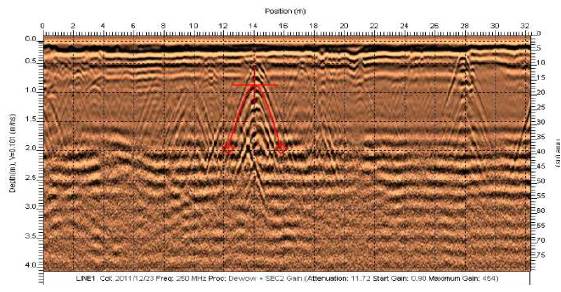
Figure 3p. Multiple cables are indicated by the hyperbolic signatures. Velocity = 0.101 m/ns
GPR survey has been done on a road having a water (metallic) line leaking at joint. This area was being excavated for laying of new water line and accidently the pipe join was hit leading to a crack. GPR has been calibrated for its velocity and due to the presence of huge water the EM wave velocity (what has been acquired by the GPR) comes out to be 0.058 m/ns. This velocity value is closer to 0.033 m/ns (water).
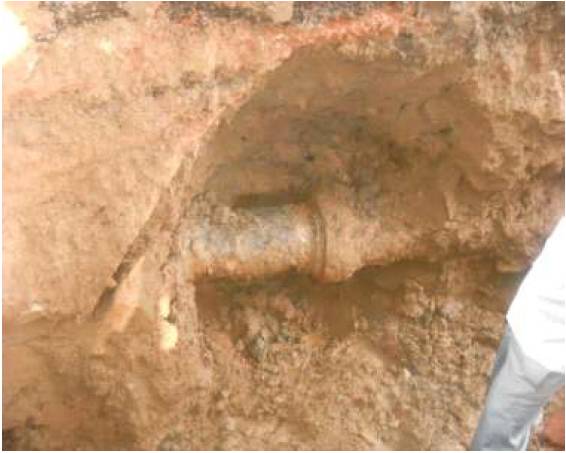
Figure 4a. Water pipe crack point
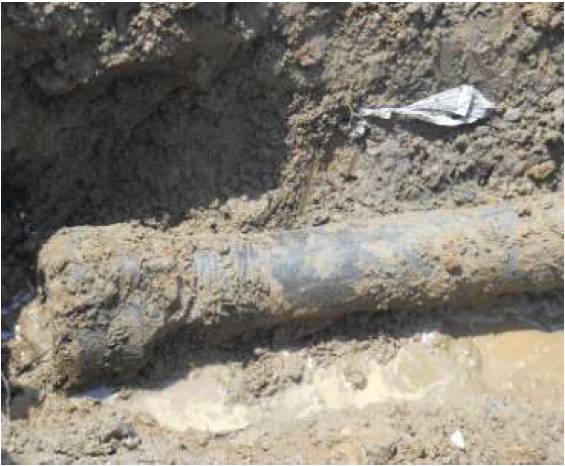
Figure 4b. Pipe excavated out
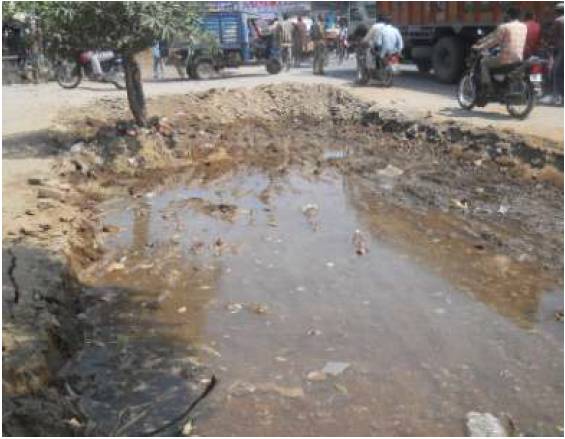
Figure 4c. Water from pipe
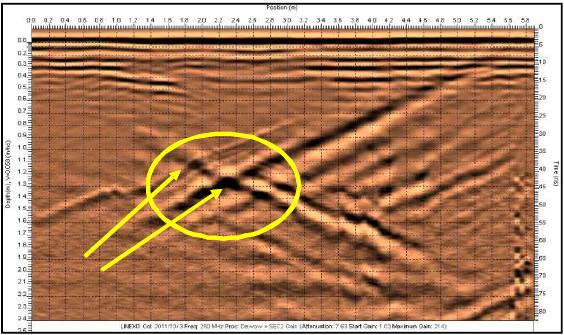
Figure 4d. GPR based image of the metallic pipe before it isexcavated out. Velocity = 0.058 m/ns
From the study of various roads using GPR, it has been possible to identify the false hyperbolic signatures which does not indicate underground objects (i.e. actually not present in the ground). These hyperbolic signatures are generated in the GPR image because of the reflections of the electromagnetic waves (emitted from the GPR) from the big objects above the ground. The basis of identification is checking the velocity of EM wave propagating through the ground. The easiest way of knowing the air events (objects) in the images acquired by ground coupled GPR is by knowing the EM velocity and which is obtained by using curve (hyperbolic) fitting method. In this method a synthetic hyperbolic curve is generated in the GPR and that is tried to fit on the hyperbolic curves acquired from the field survey. If the velocity of EM wave corresponding to the image obtained by hyperbolic matching method is closer to the velocity of EM wave in air (0.300 m/ns), then the object shown by the GPR is not the ground object rather it is present in air. The results obtained from the GPR based field survey study under the fly over and overhead pathway; indicate that the velocities of such false objects (roof of fly over and over head pathway) are 0.248 m/ns, 0.300 m/ns and 0.231 m/ns which are close to 0.300 m/ns. Thus, it is clear that the velocities above 0.200 m/ns is an air event (object). Researchers have already provided standard dielectric constants values of the general construction materials and using them their corresponding equivalent velocities can be obtained. Therefore, referring to the standard velocity values ranging from 0.030 m/ns (wet condition) to 0.150 m/ns (dry) condition corresponding to various ground material, the threshold velocity value for the distinction of ground objects from the air objects can be achieved. It is clear that if the GPR extracted velocities are in the above range, then the detected object is lying under the ground not in the air. The GPR survey results also support this logic. To be precise, the velocity results (0.101 m/ns and 0.116 m/ns) obtained from survey of the residential area having actual underground utility pipes & cables, and the velocity result (0.058 m/ns) obtained from water line leakage location can be used to validate the present approach which ensures that the object is in the ground. Thus, on the basis of analysis of GPR based velocity extraction the air objects can be separately identified from the ground objects.
The non destructive GPR technology for the pavement infrastructure investigation is very much new to India and a little awareness is prevailing so, first it must be studied, and special manpower development programmes must be initiated for direct utilization by PWD and other transportation related divisions. Further, GPR based transport infrastructure investigation procedures guide lines should be framed after rigorous research & development activity in this field. Its data processing is quite challenging and therefore, a group of Mathematicians, Electronics engineers and Civil engineers must work together to develop this field in India and solve field and technical challenges.