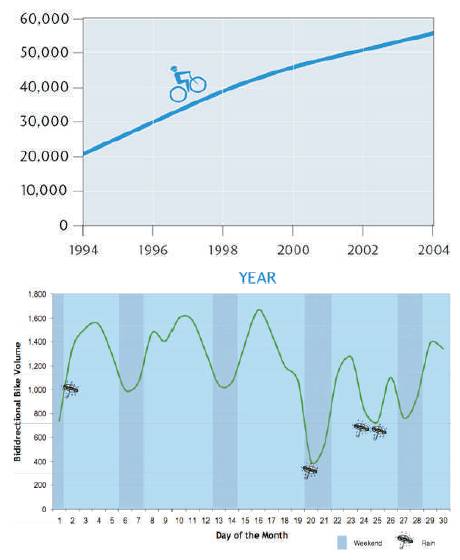
Figure 1. Bicycle trips per day in Vancouver, Canada (City of Vancouver, Cycling Statistics; Leblanc, 2009)
This paper uses hourly bicycle counts and weather data that are continuous and year-round to model bicycle traffic in Vancouver, Canada. The study uses seasonal autoregressive integrated moving average (ARIMA) analysis to account for complex serial correlation patterns in the error terms and tests the model against actual bicycle traffic counts. Temperature, rain, rain in the previous 3 hours and humidity are all found to be significant, with clearness found to be marginally significant at the 10% level. The combined effect of rain and its lags is close to 24% of the average hourly bicycle traffic counts, which is larger than the impact of it being a holiday or a Saturday, although the impact of it being a Sunday is still larger. An increase of one degree Celsius from the mean is generally found to increase bicycle traffic counts by 1.65%, so an increase of 10 degrees would increase bicycle traffic by 16.5%. The coefficients on humidity and clearness are small. A decrease in bicycle traffic of only 0.08% is observed per unit change in relative humidity and 0.62% at each of the four transitions between categories of cloudy to perfectly clear skies.
Since 1994, the number of bike trips per day in Vancouver tripled, increasing from 20,000 to 60,000 (City of Vancouver, Cycling Statistics). Even so, only 1.7% of trips to work in Metro Vancouver, and 3.7% within the City of Vancouver proper, were made by bike in 2006 (Dobrovolny, 2009). Although cycling in Vancouver has seen a dramatic increase, mode share is still very small and has room to grow.
In Vancouver, bicycle traffic is expected to continue growing quickly over the coming decades as both the City of Vancouver and Translink, Metro Vancouver's regional transportation authority, are aiming to grow the share of sustainable modes of transportation (cycling, walking and transit) to 50% ( Translink, 2008; City of Vancouver, 2009) by 2040 from the current share of 25% (Translink, 2010). Translink and the City have developed strategies for achieving a complete, safe and attractive cycling network that provides an abundant supply of bicycle parking and end of trip facilities, improved integration of cycling with transit and the implementation of a bike-sharing program in the downtown and other high cycling-potential areas ( Translink, 2008; City of Vancouver, 2009). The increases in cycling in Vancouver are apparent and will likely continue into the future.
As shown in Figure 1, while cycling is on the rise, day-to-day bicycle traffic fluctuates considerably. For example, one report from the City points out that bike counts for the Ontario Bikeway at 10th Avenue for September 2009 were as low as 400 on a rainy weekend and as high as 1600 on a non-rainy weekday. Even same days of the week can vary widely. For example, the count on Wednesday September 10 was 1600 whereas, on Wednesday September 24, a rainy day, it was only 700 (Leblanc, 2009). More than 3,500 cyclists commute to work downtown every morning, which is the equivalent of 65-75 full transit buses (City of Vancouver, Cycling Statistics). Citywide, daily bicycle trips are the equivalent of up to 1276 full transit buses. Fluctuations in these bicycle traffic counts will have service planning implications for transit, especially with the number of cyclists expected to rise. Further dedicated studies could have a more systematic approach, employ variables besides rain, account for cyclical fluctuations due to time/day of the week and utilize a larger dataset over a longer period of time. This study seeks to better understand weather's effects on bicycle traffic as well as the planning implications.
Figure 1. Bicycle trips per day in Vancouver, Canada (City of Vancouver, Cycling Statistics; Leblanc, 2009)
A number of factors, including the built environment, socio-economics, psychological (attitudes, norms, habits) and cost, travel time, effort and safety, have been identified as influencing the demand for bicycle travel ( Goldsmith, 1992; Heinen, 2010). Among these factors the natural environment, including the effect of climate (Winters, 2007) and weather on cycling. This study focuses on the day-to-day and hour-to-hour effects of weather rather than the city's long-run climate.
Bicycle traffic is generally found to increase with temperature and decrease with precipitation (Brandenburg, 2004, 2007; Niemeier, 1996; Richardson, 2000; Thomas, 2009; Miranda-Moreno, 2011; Lewin, 2011; Hanson, 1977). Miranda-Moreno (2011) also finds humidity and additional precipitation variables including the presence of rain in the morning and/or during the previous three hours to be significant too. In both [1] Thomas (2008) and Miranda-Moreno (2011), wind is tested but only found significant in [1] Thomas (2008). Niemier (1996), Lewin (2011) and [1] Thomas (2008) all suggest that the effects of precipitation and temperature are nonlinear. Richardson (2000) notes that bicycle traffic decreases in both very cold and very hot weather and bicycle traffic is found to decrease slightly after 28 degrees in Montreal (Miranda-Moreno, 2011) and 32 degrees in Boulder (Lewin, 2011). Although most cyclists value the weather in a similar way, recreational demand is much more sensitive to weather than the utilitarian demand of, for example, commuters (Richardson, 2000; Thomas, 2009. Bicycle traffic is found to decrease on weekends in Boulder (Lewin, 2011) and Montreal (Miranda-Moreno, 2011), suggest that there are more utilitarian cyclists on weekdays.
Studies generally use simple regression, setting bicycle counts as the dependent variable and weather variables as the independent, or survey analysis to draw conclusions about the weather and climate's effects on bicycle traffic. Exceptions include (Miranda-Moreno, 2011) which develops a count model and Thomas, 2009 which develops a time-series model. Niemier (1996) also uses a Poisson model to statistically confirm that many of the factors thought to influence cyclists, including both weather and non-weather variables, and identifies that count volume may be biased +/-15% depending on the time of year in which the count was taken. Richardson (2000), similarly, uses the results of the analysis to derive seasonal adjustment factors that can be applied to the results of cycle surveys conducted under varying weather conditions. The present study takes an approach similar to that of Thomas, 2009 that attempted to develop a time-series model for forecasting future bicycle traffic, although Thomas, 2009 differed in that it focused on the differences between recreational and utility cyclists.
The most recent studies use data collected from automatic counters ( Thomas, 2009; Miranda-Moreno, 2011; Lewin, 2011), although past studies have also drawn upon travel surveys ( Richardson, 2000; Hanson, 1977), time-lapse video recording ( Brandenburg, 2004, 2007) and manual counting methods ( Niemeier, 1996; Richardson, 2000). With the exception of Thomas (2008) and Miranda-Moreno (2011), daily, as opposed to hourly, bicycle counts and weather are employed. Miranda-Moreno (2011) uses hourly data from April 2008 to July 2010, excluding winters because the bulk of the bicycle network is closed during that time. In addition, other portions of data are missing due to construction, bike path closures and maintenance. The Lewin (2011) study used data from between 2000 and 2004 but only subsets of those days actually have counts due to issues such as formatting, duplicating and stamping. Thomas (2008) drew upon a large and consistent dataset collected by Wageningen University on various bicycle paths throughout the Netherlands. The present study takes an approach similar to Thomas (2008) as a uniform and continuous dataset has been obtained.
The objective of this study is to determine the significance and magnitude effect of temperature, relative humidity, wind speed, clearness, fog and precipitation (including drizzle, showers, rain and snow) on bicycle traffic in Vancouver and devise a time series model that can be used to forecast future bicycle traffic.
It is expected that weather variables, especially temperature and precipitation, will continue to be significant predictors of bicycle traffic, but that the coefficients and t-statistics will be lower in a model that uses autoregressive integrated moving average (ARIMA) analysis.
Hourly bicycle traffic counts were obtained for four sites at which the City of Vancouver has installed permanent inductive loop counters. The data for each site was mostly intact and continuous, although some exceptions, due to equipment malfunction and vandalism, are noted in Table 1. The total number observations amount to 15,312 hours.
The counts for each lane were also graphed and visually assessed. Because the coefficient of variation and cyclical patterns in bicycle counts are similar for each lane, it is reasonable to combine the lane totals for analysis. Burrard has the highest count, so will hold the most weight. The total bicycle count across all lanes was adjusted where data for an individual lane was missing by using mean counts to determine each lane's average contribution to total count, and multiplying that factor by the total where individual lane data is missing. The amount of missing data was quite small.
As will be discussed in the next section, cyclists frequently base their decision to bike on current rather than forecasted weather. Therefore, our analysis is based on actual rather than forecasted weather. The Canada National Climate Data and Information Archive maintain a historical record of hourly weather information the Vancouver International Airport station. A description of the weather variables is shown in Table 2.
Figure 2 plots daily bicycle traffic counts, seven-day average, daily mean temperature and days where more than 50% of the hours between 6am and 9pm had precipitation. At the annual scale, bike counts generally cycle with temperature, peaking in July and hitting a low in December. Counts also tend to be higher during periods without precipitation. Weekend and holiday counts tend to fall beneath the moving average. February counts in 2010 are higher than usual because of the Winter Olympics. Table 3 summarizes the statistics for weekday, weekend, holiday and Olympic counts. Weekdays had higher bicycle counts and lower variation than weekends and holidays.
Figure 3 shows that bicycle traffic follows annual, weekly and daily cycles. As counts closely follow temperature at the annual scale, temperature can be used to account for the annual fluctuations. Weekly and daily cycles are more of the function of the temporal patterns of human activity. We will use lagged variables, autoregressive and seasonal autoregressive terms to account for them. Additional observations are worth noting: peak in bicycle traffic in July is 4.5 times higher than December's low and variation within each month hits a low in the summer months and peaks in the winter months. Also, bicycle traffic is about 40% higher on weekdays than weekends and there is more count variation on weekends. Finally, bicycle traffic generally peaks twice per day, between 8-9am and 5-6pm and variation in bicycle traffic hits a low during the afternoon.
The weather variables were each studied in turn. The proportion of hours with rain peaks in November and hits a low in July, which is typical for Vancouver. The mean temperatures for all months during the study period were typical for Vancouver, except for the January data, which was cooler than usual.
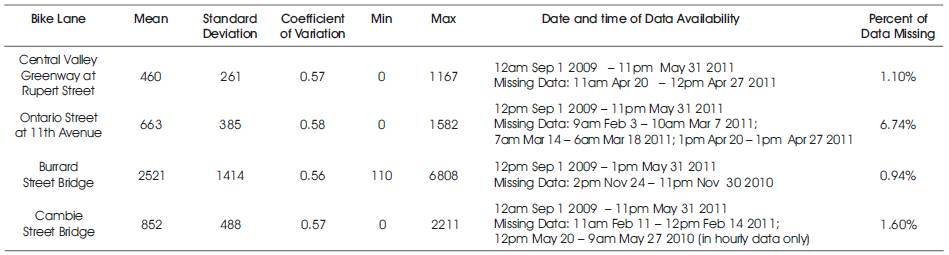
Table 1. Daily Bicycle Counts by Lane
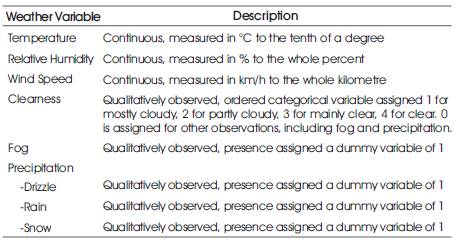
Table 2. Weather Variables Used in the Model
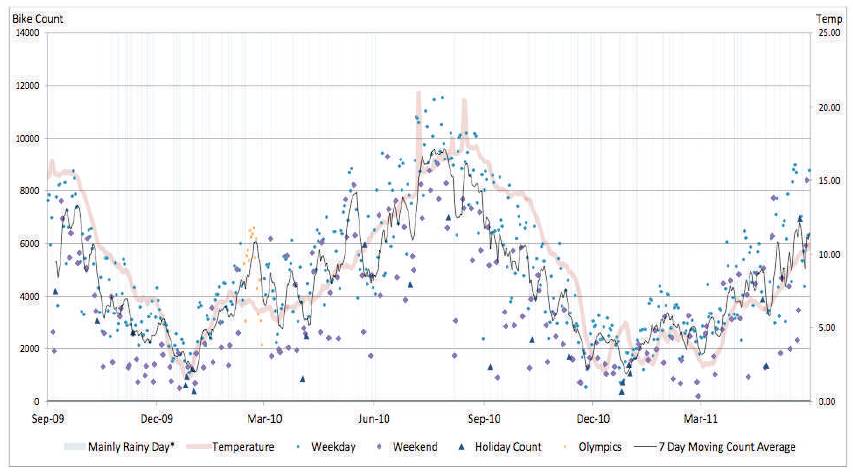
Figure 2. Daily bicycle counts, temperature and precipitation. (*mainly rainy day defined as >50% of hours between 6am and 9pm have precipitation)

Table 3. Statistics for Bicycle Counts by Weekday, Weekend, Holiday and Olympics
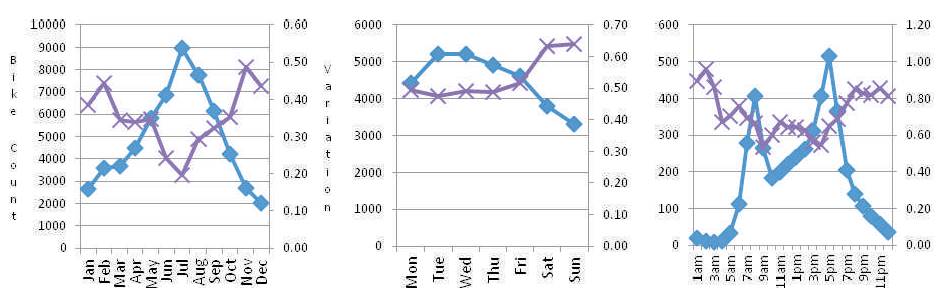
Figure 3. Mean and variation for bike count data by month, day of week and time of day
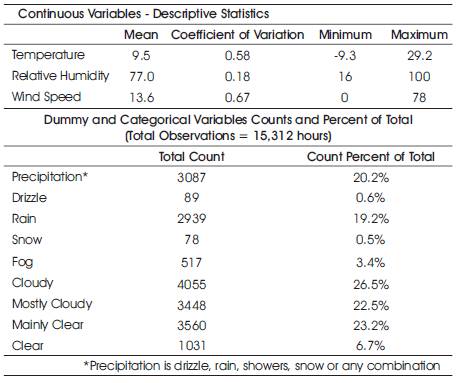
Table 4. Summary Statistics for Weather Variables
Only the first 75% of the data series was used to estimate the model and the last 25% was saved to verify the model. A forecasting model capturing the data's trend, seasonality and correlation among error terms was developed using ARIMA analysis, also known as the Box-Jenkins analysis. The unit root test was used to test for non-stationarity. ARIMA is an iterative model-building strategy consisting of three stages: identification, estimation and diagnosis. The first, identification, involved estimating the autocorrelation and partial autocorrelation functions from the raw data. The correlogram will help indicate whether a stationary series is a white noise or has a moving average or autoregressive pattern. In the estimation stage, the regression is run with ARIMA terms. In this paper, EViews version 7 is used for the model estimation. Parameter estimates of the autoregressive or moving average terms must be statistically significant and lie within the bounds of stationarity and invertibility. Finally, diagnosis examines whether the residuals were not different from 'white noise' by checking that the autocorrelation function had no statistically significant spikes, and using Ljung-Box Q-statistics and the Breusch-Godfrey Serial Correlation Test to test high-order serial correlations.
The unit root test rejects the null hypothesis that the data series is non-stationary. The correlograms of residuals, shown in Figure 4, suggests that autoregressive terms AR1, seasonal autoregressive terms SAR24 (24 hour cycle in a day) and SAR168 (168 hour cycle in a week) should be used in the ARIMA model. Then dozens of different combination of additional AR terms and lagged variables were tried. Two criteria are used to identify the final model: first the estimated residuals should not have significant serial dependence; and given the first condition being met, minimize the Akaike Info Criterion value. The final model includes additional autoregressive terms (AR2, AR6, AR9, AR10, AR72, AR192) and lagged variables for bike counts from previous hours counts (hours 1-27, 30, 31, 33, 37-39, 41, 48, 72, 96, 120, 144, 168, 192 and 216). The Durbin-Watson Statistic was not a sufficient test for this model because it contains lagged dependent variables. The Ljung-Box Q-Statistics shown in Table 6 are insignificant and the final correlograms Figure 4 shows that the autocorrelations and partial autocorrelations are nearly zero. The Breusch-Godfrey test also confirms that serial correlation has been accounted for in the ARIMA model.
Table 5 reports the estimated coefficients for both the ARIMA model and the base model (a simple linear regression model without ARIMA or lagged variables). The signs of the coefficients are generally the same in both models. But the significance and magnitude of the coefficients are systematically larger in the base model, indicating that the effects of weather variables are exaggerated when complex serial correlation patterns in the error terms are not accounted for. Rain and the one hour lag of rain were rejected in the base model but accepted in the ARIMA model, which makes more sense. Snow and fog are accepted in the base model with the wrong signs but rejected in the ARIMA model. Drizzle remains rejected in both models.
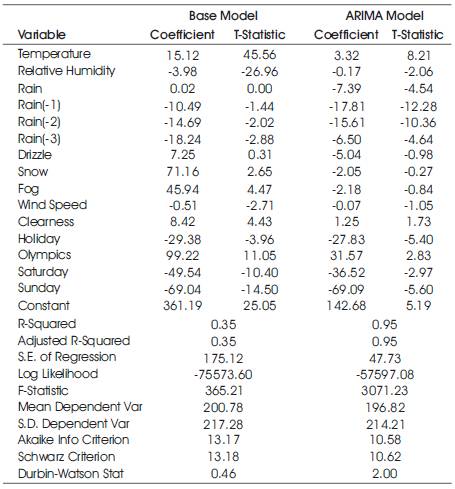
Table 5. Estimation Results of the Base and ARIMA Models
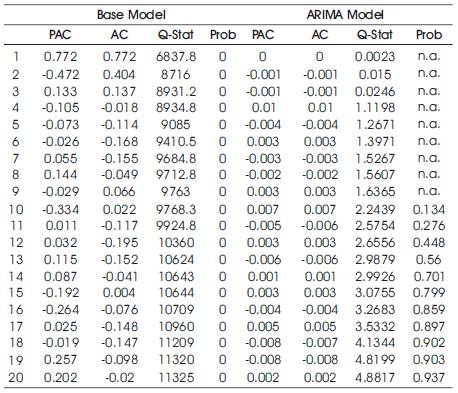
Table 6. Ljung-Box Q-Statistics
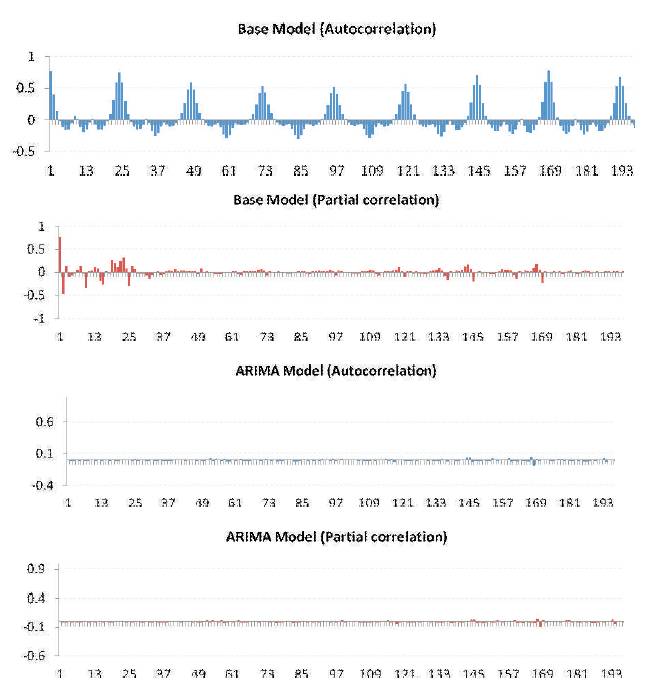
Figure 4. Correlograms for base and ARIMA Models
Temperature, as with past studies, is positive and significant in both models but the base model wildly overestimates its magnitude. In the ARIMA model, an increase of one degree Celsius from the mean is expected to increase ridership by 1.65%, so an increase of 10 degrees would increase ridership by 16.50%. It should be noted that this study could not verify the negative effect of extremely hot temperatures (i.e. temperatures >28 degrees Celsius) found in past studies because Vancouver summers are too mild. The coefficient on humidity is small, decreasing bicycle traffic only 0.08% per unit change in relative humidity from the mean, but significant. A 20% change in relative humidity brings about a 1.69% decrease in bicycle traffic. Clearness is only marginally significant at the 10% level and would increase bicycle traffic by 0.62% at each of the four transitions between cloudy and clear skies. As with past studies, rain is found to be negative and significant and, as in the Miranda-Moreno (2011) study, the coefficients on the lags of rain are significant too, up to the previous three hours. The combined effect of rain and its lags is close to 50 trips per hour, 23.54% of the average hourly bike trips, which is larger than that of holidays, the Olympics or Saturday, although Sunday's impact is still larger. It should be noted that the effect of rain in the previous hour (8.86%) is larger than rain in the current hour (3.68%). Snow is not significant, but conclusions cannot be drawn from these findings since Vancouver's sample size (i.e. hours with snow) is small.
The model was used to generate predicted values for the 25% test data. The results for May 2011, the last month in the data series, are displayed in Figure 5, overlaid with the two most important weather variables, temperature and rain. The actual and forecasted values are close and the weekly and daily cycles generally match. Table 7 reports the statistics on the forecast precision based on the bike counts between 7am and 7pm.

Table 7. Summary Statistics for Forecast
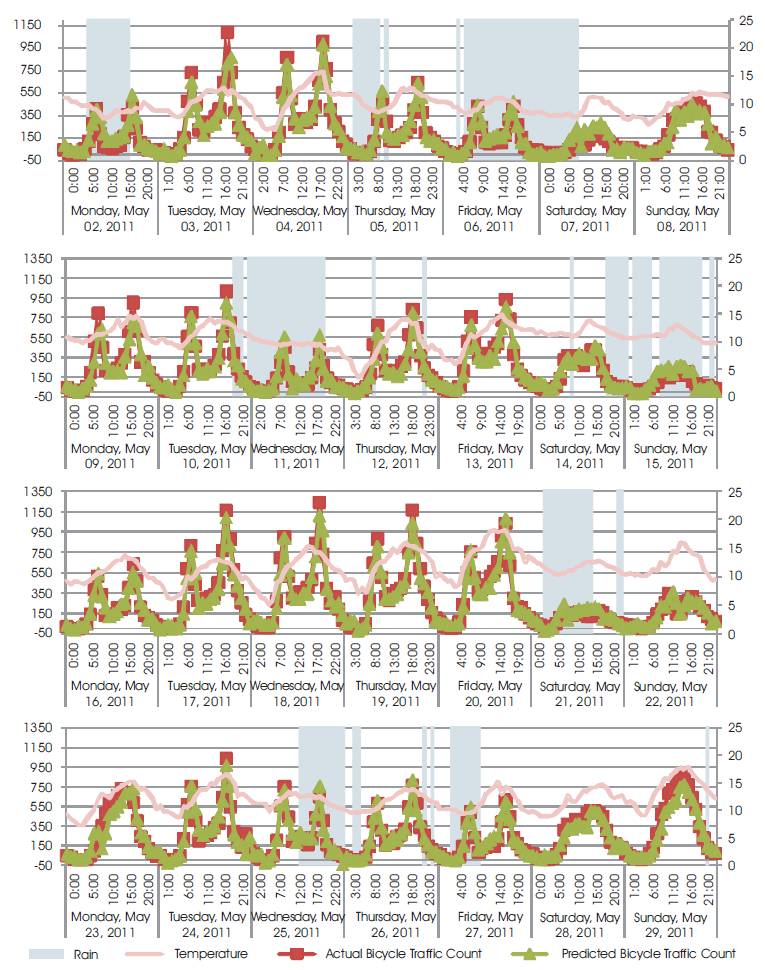
Figure 5. Plot of Actual and Predicted Counts for May 2011 Test Data
This study confirms that weather has a significant and important impact on bicycle traffic, although it suggests the effects are exaggerated in models that fail to account for complex serial correlation patterns in the error terms. The findings of the ARIMA model show that temperature, humidity, rain and rain in the previous three hours are significant, with clearness being marginally significant. Temperature and rain stand out as having a particularly important effect on bicycle traffic counts.
Results of a preliminary survey, conducted in conjunction with the formulation of this study's model, confirm weather's important influence on the decision of whether or not to bike, although many will cycle regardless of the weather. 58% of cyclists responded that they do consider weather a factor when deciding whether or not to bike. Of those who base their decision to bike on the weather, 77% base their decision on current rather than forecasted or recent weather. Thus, in modeling each group, there is some justification for using recent and forecasted weather variables, but current weather matters most. Our model uses current weather variables and recent weather variables for rain.
Of respondents who base their decision on forecasted weather, 41% check just before they leave, 24% up to 2 hours before and 29% on the evening before. Inclement weather was also found to influence mode choice. 44% of respondents claim to choose another mode in inclement weather. Transit is the most popular alternative at 22% of respondents, half of those who do switch, meaning that weather could have important service impacts on routes near heavily utilized bicycle paths. Finally, if the weather changes after arriving at a destination, 94% of respondents claim to still return by bike, despite the weather, and this was the same for males and females. This suggests that inclement weather may have a greater influence on the outgoing trip than the returning trip. This would mean that certain times of day, such as morning peak-hour, might be more prone to weather effects.
Responses to this preliminary survey were conducted through the Cycling Department of City of Vancouver, Third Wave Cycling Group Inc. (a cycling consulting firm) and Velolove, a volunteer-directed, community-based, entity focused on promoting cycling culture and events and the official City of Vancouver Cycling Facebook page. 143 cyclists (72% male) were surveyed in total. The number of respondents who bike, despite the weather, is likely higher in Vancouver than other Canadian cities as the climate is relatively mild year-round.
One potential use of the ARIMA model is to provide adjustment factors to scale manual bike count data taken under different weather conditions. This method could be used to create a more accurate historical series of counts to compare changes in bicycle traffic over time.
With respect to the fluctuations in bicycle traffic, one policy aim could be to accommodate the choices cyclists make in cases of inclement weather. For example, a system would be created whereby a decrease in bicycle traffic can be recognized when it is about to occur so that it can be absorbed by other modes. Accommodating fluctuations in areas with high levels of bicycle traffic might involve putting additional buses on the road during periods of inclement weather (i.e. not only planning for seasonal norms, but also daily and weekly fluctuations).
Another aim could be to reduce the fluctuations due to weather through affecting the comfort level of cyclists in inclement weather. Examples might include increased sheltered areas along the route (i.e. creative canopies), lane-side temporary or permanent businesses that provide hot drinks to commuters, public education campaigns on the proper clothing for cycling in inclement weather, building end-of-trip facilities such as showers in offices and other destinations and partnerships with major employers to pilot employee incentive programs such as credits towards rain gear and gym passes.
While this paper has solely focused on bicycle traffic, the scope of this analysis could be expanded to consider the impact of weather on multiple travel modes in tandem with one another. In effect, such an expanded analysis would amount to a study of weather-specific mode split in contrast to annual average mode split for a particular region or city. In other words, an expanded analysis would look at how walking, cycling, driving and transit mode share fluctuate relative to one another over time and with respect to weather.
The author would like to recognize the City of Vancouver for providing us with the data for this study. They would also like to acknowledge Lilian Yuen and Tim Magowan for assisting with surveying and research.