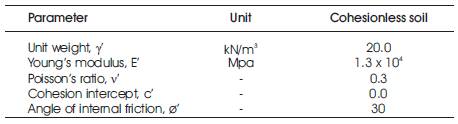
Table 1. Soil Parameters for Analysis of Pile Group
The main objective of this study is to determine the relationship between pile spacing and p-multipliers (fm - pile-to-pile modulus multiplier) for a laterally loaded pile-group. In addition, the appropriate p-multipliers for a 3-pile group configuration at 2D, 4D, 6D and 8D pile spacing is also determined. Therefore, a three-dimensional finite element approach was used to assess the lateral pile and pile group response subjected to pure lateral load. Results of the influence of load intensities, group configuration, pile spacing are discussed in terms of response of load vs. lateral displacement, load vs. soil resistance and corresponding p-y curves. The improved plots can be used for laterally loaded pile design and also to produce the group action design p-multiplier curves and equations. As a result, design curves were developed and applied on the actual case studies and similar expected cases for assessment of pile group behavior using improved p-multiplier. A design equation was derived from predicted design curves to be used in the evaluation of the lateral pile group action. It was found that the group interaction effect led to reduced lateral resistance for the pile in the group relative to that for the single pile.
As reported by Rollins et al. (2005 & 2006), one method of accounting for the shadowing or group action effects is to reduce the modulus or the soil resistance, p for the pure laterally loaded pile group. This module is named p-multiplier (fm) which is usually derived from a single isolated pile and pile within group p–y curve which was earlier proposed by Brown et al. (1988). Although this simple approach has provided relatively good estimates of measured pile group behavior ( Brown et al. 1988; Remaud et. Al 1998 and Rollins et al. 1998), p-multipliers are extremely restricted in their application.
Several methods have been developed over the years for assessing the lateral performance of pile within a closely spaced group. These methods are classified under five categories, as: (a) empirical stiffness distribution method (Dunnavant and O'Neill 1986), (b) hybrid model (Duncan et al. 1994), (c) characteristic load method (Mokwa and Duncan 2001), (d) continuum methods (Iyer and Sam 1991), and (e) finite element method (Kahyaoglu et. al. 2009). The purpose of this paper is to determine the relationship between pile spacing and p-multipliers (fm - pile-to-pile modulus multiplier) for a laterally loaded pile-group in cohesionless soil. In addition, the appropriate p-multipliers for a 3-pile group configuration at 2D, 4D, 6D and 8D pile spacing is also determined.
The analysis consists of modeling of single pile and pile cap using linear-elastic model with 15-node wedge elements. The cross-section of the pile is circular with a diameter of 1.0m and length of 15m. The baseline soil parameters used for the analysis of laterally loaded pile group are illustrated in Table 1.
Finite element analyses were performed using the software PLAXIS 3D FOUNDATION (Brinkgreve & Broere 2004). In the finite element method a continuum is divided into a number of (volume) elements. Each element consists of a number of nodes. Each node has a number of degrees of freedom that correspond to discrete values of the unknowns in the boundary value problem to be solved.
The outer boundaries of soil body of cubic shape are extended 10D on the sides and 5D to the bottom of pile group. The 3D view of the finite element mesh of the pile groups and the surrounding soil mass are shown in Figure1. The outer dimensions of pile cap depend on the pile group arrangement. The pile cap extends of 0.5 m beyond the outside face of exterior piles.
Table 1. Soil Parameters for Analysis of Pile Group
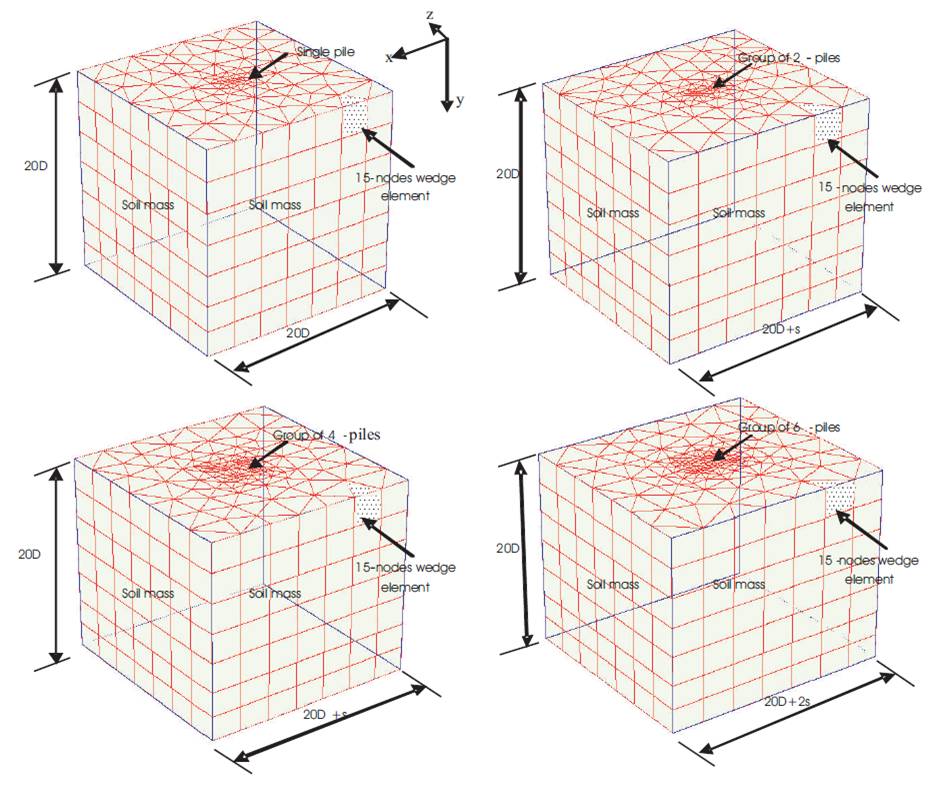
Figure 1. Three-Dimensional View of the Finite Element Mesh of the Single Pile and 2,4 and 6- Pile Groups and Surrounding Soil Mass
The influence of group interaction on the three pile groups (i.e. 2x1, 2x2 and 3x2)on predicted p-y design curves at four different pile spacing (i.e. s=2D,4D,6D and 8D) are shown in Figure 2. The predicted p-y curve was evaluated at a depth of 3m, because this is the depth with maximum ultimate lateral soil pressure. It can be observed that there are significant difference on the p-y curve of close pile group (i.e. s=2D). This is due to increase of lateral pile displacement and loss on the lateral soil pressure. The pile within leading row has significantly close values with that obtained from single isolated pile. This is due to the reduction on the group action on the leading row unlike the piles within other rows (i.e. trailing row). This is also reported by Brown et al. (1988), and Rollins et al. (1998, 2005 & 2006). Same discussion obtained from predicted p-y curve of group 2x1 can be applied for both pile group 2x2 and 3x2.
This section provides the development of the fm with respect to pile spacing for pure lateral loaded pile groups in cohesionless and cohesive soils. The improvement includes:
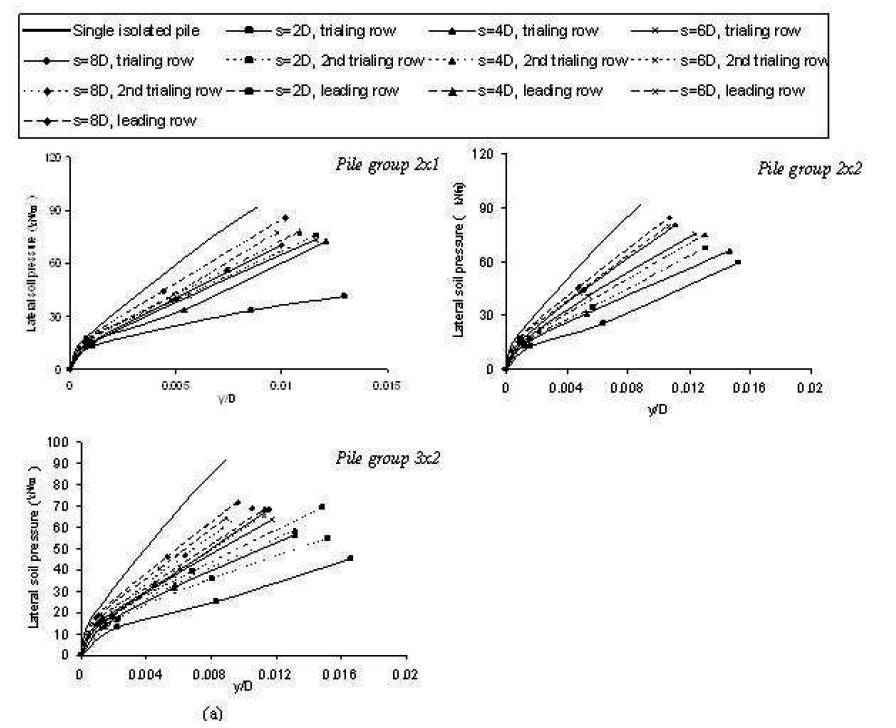
Figure 2. Influence of Pile Spacing on the Predicted of p-y curve of Group Piles (2x1, 2x2 and 3x2)
The pile-to-pile modulus multiplier (fm or p-multipliers) was evaluated by dividing the ultimate soil pressure of pile within group by the values obtained from single isolated pile at the given depth Brown et al. (1988), and Rollins et al. (2005). Predicted p-y curve for pile within group can be obtained by multiplying the values of lateral soil pressure p by the value of (fm) while keeping lateral pile displacement constant. The results of the predicted p-multipliers represents of purely lateral loaded pile groups is illustrated in Figure 3.
It can be observed that the values of the fm of leading pile is always greater that those measured for first and second trailing pile which was also observed previously by Brown et al. (1988), and Rollins et al. (2005). Therefore the piles in the leading row carry load magnitude similar to that carried by single isolated pile. This is due to the less effect of group action on the leading pile compared with other piles.
The piles in first and second trailing row also carry similar magnitudes of loads. It seems that pile spacing between (s=2D-5D) also give small values of fm. This means large effect of group action occurred in the case of small pile spacing compared with the pile group of wide pile spacing (i.e. s is more than 5D). This indicate that the pile within the group for the case of wide spacing pile group can be designed according to the results obtained from single isolated pile.
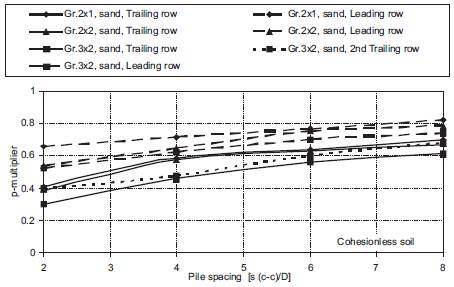
Figure 3. Predicted p-multiplier for Purely Lateral Loaded Pile Group (groups 2x1, 2x2 and 3x2)
A design equation has also been developed according to the design p-multiplier curves to compute the amount of p-multiplier (fm) as a function of both pile spacing (c-c) and pile diameter (D). The equation applied for both cohesionless and cohesive soils are:
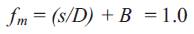
where A and B are constant which can directly obtained from Table 2.
Table 2 is limited for three pile group configuration (i.e. 2x1, 2x2 and 3x2) and four pile spacing (i.e. s=2D, 4D, 6D and 8D). The values of these constants can extrapolate to other pile group configurations.
The total lateral load resistance of a 2 x 2 pile group configuration is to be determined according to the assumed single pile response reported by Karthigeyan et al. (2007). This group has spacing of 3.53D center to center in the direction of lateral load. This value of pile spacing was also used by Rollins et al. (2006). For this example, the piles are 1.2m and 10.0m diameter and length, respectively. The predicted fm magnitudes for this specific example are calculated using equation 1 and the results are shown below.
Trailing row, spacing, fm= 0.2075 Ln(3.53) + 0.2575= 0.52
Leading row, spacing, fm= 0.1867 Ln(3.53) + 0.4018= 0.64
The computed load vs. deflection for single isolated pile with fm values in case of cohesion less soil is shown in Figure 4.
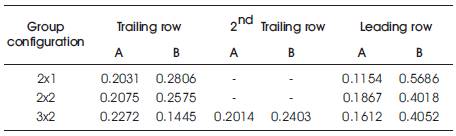
Table 2. Values of A & B Constants for both Cohesionless and Cohesive soil
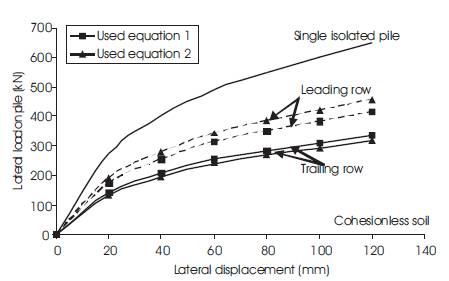
Figure 4. Load-Deflection Curves obtained from the Example of Pile Group with Predicted Computed from Improved p-multiplier equations
Significantly large difference on the p-y curve of closed spacing pile group (i.e. s=2D). The behavior of the pile group 2x2 is close but not the same as with the behavior of pile group 2x1. In the case of group 3x2, the lateral pile displacement and lateral soil resistance gave similar values for first and second trailing row. The values of the p-multiplier (fm) of leading pile are always greater that those obtained for first and second trailing pile. Pile spacing of (s=2D-5D) provides low fm which means that the large effect of group action occurred in this case and the pile within group have no similar behavior compared with behavior of single isolated pile. The calculated results which were obtained from equation 1 is more similar in case of trailing row and significantly similar in case of leading row.