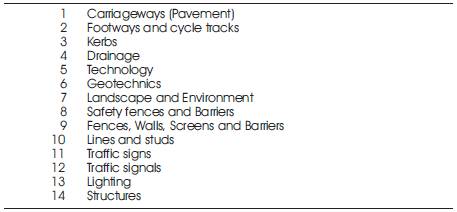
Table 1. The 14 Highway Assets Groups
The UK Highways Agency (HA) is responsible for the operating, maintaining and continual improvement of the strategic road network in England which is made up of 14 asset groups. This public asset valued at about £88 billion and handling traffic volumes of nearly 140 billion vehicle kilometres a year requires about £900 million every year (NAO, 2009) to maintain it in a safe, serviceable and sustainable condition. This paper demonstrates that effective highway asset management requires the asset owner to optimally and sustainably manage their asset and asset systems, their associated performance, risks and maintenance costs over the asset's whole life cycle to ensure that the asset demonstrates value for money over the long-term and that it fulfils its stakeholder requirements. There is a lack of good quality current and historical data that can be used to prioritise asset intervention activities and to minimise whole life cycle costs (WLCC). This research paper presents work done to date to develop four deterioration models for four highway asset groups.
The UK Highways Agency (HA) established in 1994 is an Executive Agency of the Department for Transport and is responsible for the operating, maintaining and continual improvement of the strategic road network in England (Highway Agency Strategic Plan, 2010-2015). This strategic network is divided into 14 geographical areas which are managed through managing agent contractor (MAC) contracts which includes partnering and collaborative working. In the MAC, the service provider is responsible for the design and delivery of maintenance work over four or five years with the option to extend up to seven years (NAO, 2009). The MAC contract form largely follows best practice and contains the mechanisms necessary to allow the Agency to manage risks and deliver efficiencies over time. Area 2 in the South West England operates an enhanced managing agent contractor (EMAC) contract which came into effect in 2005 and combines the roles previously undertaken by separate Managing Agents (MA) and Term Maintenance Contractors (TMC).
The HA's principal objective in value for money terms is to maintain the network in a safe and serviceable condition at minimum whole life costs. The HA currently does not pursue minimum whole life cycle costing (WLCC) as strongly as it might and the nature of the MAC contracts does not offer direct incentives for service providers to minimise whole life costs (NAO, 2009). To maintain the asset effectively and efficiently, the HA's approach to asset management is to use asset management principles and practice to achieve the right balance between WLCC, journey time reliability, safety, risk, affordability, environmental management and asset preservation to deliver a high-quality service to its customers. To accomplish this, the HA developed a WLCC model known as Software for the Whole-life Economic Evaluation of Pavement Schemes (SWEEP.S) whose outputs feed into the value management process where schemes are assessed under four categories of safety, value for money, reduction of disruption and environmental sustainability. The overall score awarded to each of these categories contributes towards the budget allocation and programming for the programme period which is currently 4 years.
The highway network is made up of 14 different asset groups as shown in Table 1 and most of these assets except for pavement, drainage and geotechnical lack prediction models to effectively and efficiently manage them. Knowledge of the current condition and prediction of the future condition of each of these assets is important if asset interventions are to be cost effective. SWEEPS can not be used to model all the assets because it is difficult to produce a generic deterioration model (Kishk 2004) due to the different variables associated with different assets. As a result, each asset group should have its own model.
The pavement, structures, drains and geotechnical assets have well established deterioration models but the Agency currently does not have models for the other assets because there are currently data gaps on the condition and/or deterioration paths of some of the assets (NAO, 2009). It is for this reason that the joint venture service providers in Area 2 (EMAC contract) embarked on this research to gather data and produce deterioration models for four asset groups to improve this process. These assets are: safety barriers, lines and studs, lighting columns and traffic signs.
With an aging asset and an ever increasing demand for the service as well as a restricted budget comes the complexity of managing the highway asset and therefore the need for a clear framework to manage such assets. Although managing a highway asset is becoming more efficient through better technology and integration, the network's increased integration with other assets is creating more complex interdependencies (e.g. active traffic management on motorways is dependent on electricity and communications networks to connect traffic sensors and displays). Another complexity in highway asset management is caused by the uncertainty of the rate at which different asset types deteriorate and the interconnections between the different elements of the assets as well as the asset's connection to soft systems. Due to the interdependency of the different assets on each other, maintenance interventions cannot be made in isolation because of the feedback loops that can create unintended consequences.
Table 1. The 14 Highway Assets Groups
The whole life cycle costing research being carried out in Area 2 will improve the asset owners knowledge about what assets they own, where the assets are, what condition they are in, what their remaining life is, what is the best intervention strategy and what is the value of the asset. With up to date asset data, decisions can be made such as when should the asset be maintained and /or replaced or should it be left to fail. It can also answer such questions as if maintenance is deferred, how much will it cost to replace the asset at a later date? With this data, the HA have the opportunity to choose how to optimise funding and maintenance systematically, component by component, and with the total cost of each alternative option available and expressed in terms of net present value, the process of decision making is improved.
In order to establish the deterioration rates of the four assets, reliable and dependable data on the historic and current condition of the asset was sought. Such data is usually kept in an inventory. The highway inventory is the asset register and is the starting point for any condition rating. In the inventory, asset data should be complete, accurate and up to date. Where any gaps in data are identified, these should be addressed immediately. Asset inventory is the foundation stone on which asset management processes are to be built. It is only when appropriate inventory and condition data are available that an overall view and consistent asset management approach can be achieved. To maintain accurate data, ensure that processes are in place to update the data regularly once it has been collected.
In Area 2 however, the inventory is not complete. There are still some gaps in the database and the National Audit Office (NAO, 2009) suggested that the quality of information available on highway assets needs to be improved. Current asset data is generally poor and uncoordinated. Having the right data on a cross-sectoral basis is crucial to making informed decisions. To improve the quality of the data, the HA is developing an Integrated Asset Management System (NAO, 2009) that will ensure accurate data is populated and that a single repository for the asset data is created. Despite data collection being tackled enthusiastically, research shows that this is done largely individual and uncoordinated and has not been directed at projecting and managing future asset liabilities (Burns et al., 1999).
Lack of accurate data makes it difficult to set long-term targets due to the uncertainty of how the asset will deteriorate. This problem is not limited to the highway asset only but to other public infrastructure asset. Until recently, few records of public infrastructure condition and value existed (Burns et al., 1999). Kishk (2004) noted that data for a typical WLCC analysis can not be provided from a single source and that such data should include initial acquisition costs, future operating and maintenance costs, renewal or disposal costs, discount and inflation rates. Each of these costs also has its own level and type of uncertainty and risk. In the case of highway asset management, the data includes works treatment costs, traffic management, user delay costs and accident costs over the design period which is usually 60 years for the pavement.
Condition grade systems are used to summarise the condition and performance of the asset. Condition grades are assessed through visual examination of an asset and with reference to specified descriptions of each grade. Grading asset condition gives a measure of the extent of physical deterioration with respect to the “as new” condition. To create prediction models for the four asset groups, the first phase of the exercise is shown in Figures 1 to 4 and comprises of the initial collection of inventory data on street lighting columns, traffic signs and safety barriers over a period of five years on the Area 2 EMAC contract, South West England. Each asset was then assigned a condition rating on a 1 to 5 scale where 5 means asset is as new and has no defects and a rating of 1 means the asset is unsafe / unfit for purpose and should be replaced. Ratings of 1- 5 are treated as assessment grades rather than precise numerical values. Data was collected using Route Mapper video technology by someone sitting in the office as well as physical data collected by inspectors. Figure 1 shows the summary spreadsheet with condition ratings, the treatment options and the resulting deterioration curves.
After each asset was surveyed, the data was subjected to a rigorous process of in-house verification. Once the data has been inputted and processed Condition Indices (Figure 2) agreed with some experts were allocated to the assets. Figure 2, shows the condition grade / index, its corresponding rating, assessment grade, and the description of each condition grade. Figure 2 also shows the descriptions against each asset condition rating. These rating also correspond with the defects categories and assessment grade description.
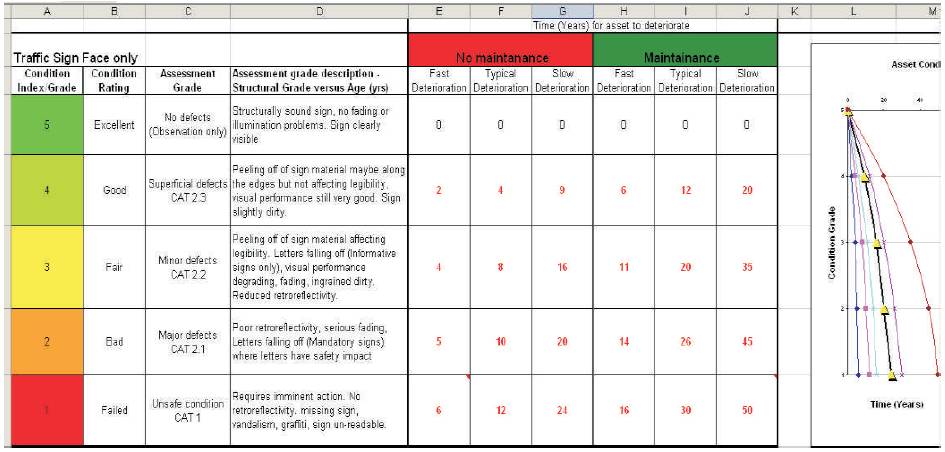
Figure 1. Spreadsheet Showing Condition Rating, Maintenance Option and Deterioration Curves for Traffic Sign Posts
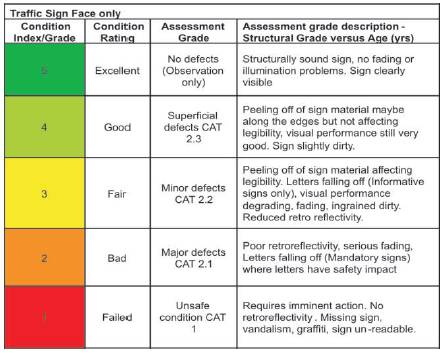
Figure 2. Description of asset condition rating and defects category
Condition Index 5 – The traffic sign face is in excellent condition. It is structurally sound, has not started fading or having illumination problems, it is still clearly visible; it is as new and is expected to last its entire design life of 25 years. In this condition, it is recommended that the sign is observed for changes only, no defects are expected.
Condition Index 4 – The sign face is in good condition, has superficial defects which are classified as Category 2.3 defects, the sign shows slight signs of peeling off of sign material maybe along the edges but not affecting sign legibility, visual performance still very good but sign could be slightly dirty.
Condition Index 3 – The sign face is in a fair condition, it has minor defects which are classified as Category 2.2 defects. The sign face material is peeling off affecting legibility and some letters have started falling off creating a safety issue especially for informative signs. The visual performance is degrading, fading, and sign has ingrained dirty causing reduced retro reflectivity.
Condition Index 2 – The sign face is in a bad condition, it has major defects which are classified as Category 2.1 defects. The sign already has poor retro reflectivity, serious fading, and letters falling off causing a serious safety issue for mandatory signs where letters have safety impact.
Condition Index 1 – The sign face has now failed; it is now unfit for purpose and should be replaced immediately. It is now a Category 1 defect. Sign has no retro reflectivity, sign is missing, been vandalised, has graffiti, or is un-readable.
The indices together with the findings from other surveys are used to produce a maintenance priority listing. The result is a priority listing specifically designed to attend to those assets with the greatest risk. The maintenance strategy adopted for a given asset depends on the assessed level of risk.
After establishing the condition indices, the next stage was to determine the number of years that it would take for each asset to be in the condition rating grade of 1-5 taking into consideration the asset material, its location on the network and under various environmental conditions ranking from the worst case scenario to the best case favourable conditions. The number of years it takes for the asset to deteriorate in different scenarios is shown in Figure 3. The number of years for the asset to reach the condition rating was considered on two options. These were agreed on by a panel of experts on asset maintenance. Option 1 is when the asset is left to deteriorate without any maintenance and option two is when the asset is maintained. Deterioration is considered in each case under three different rates i.e., fast typical and slow deterioration were analysed. For the traffic signs, it was agreed to split the face and the sign post into two assets because the face and the post have different materials and so will have different deterioration rates. It was originally agreed that another rate of deterioration will be established for the traffic sign together with the face as one asset but after serious considerations of how each material deteriorates, it was decided to leave the two as separate assets and that each will be monitored and maintained separately.
The data in Figure 3 shows that if the asset is left to deteriorate without any maintenance, the sign face which is designed to last approximately 25 years will start deteriorating in the first two years and would need total replacement in just six years. This is the worst case scenario of environmental conditions. If the conditions are moderate, the same asset would start deteriorating after four years to last 12 years before needing replacing. However, if conditions are excellent, slow deterioration will occur and without maintenance a traffic sign was established to last 24 years. However, if the asset is well maintained, it was established that its design life can be doubled from 24 years to 50 years. Maintenance efforts performed early in the asset life cycle can significantly reduce the costs of highway rehabilitation and the frequency of highway replacement (Lemer, 1996).
Using data from Figure 3 on the number of years it takes for the asset to deteriorate from one grade to another, deterioration curves where plotted and are shown in Figure 4. The curves show the deterioration for the traffic sign face and indicates that in general, if the asset is left without any maintenance, deterioration occurs just two years after the asset has been put up and in as little as six years, the asset will need replacing. On other hand, using the same data from Figure 3, if the asset is maintained, deterioration will start six years after first installation and the asset can have an extended life span of 50 years as compared to a maximum life span of 24 years if the asset is not being maintained. The curves show that the rate of deterioration increases with age and towards the end of the asset's life, deterioration is rapid. The results of this research so far show that maintaining the assets generally extend their life by keeping them within the typical deterioration state and remaining in category defect 2.2 for much longer.
According to the deterioration curves, Figure 4, it is best to maintain the assets within the typical deterioration zone. Anything to the left of the deterioration graph means asset deterioration is faster and to the right of the graph means the assets are reaching the end of their design life. It is therefore recommended that assets are maintained within the 2.2 defects category. The assets must be watched closely so that they do not deteriorate towards 2.1 defects category and into defects category 1 where the asset is considered to have failed. The same exercise was carried out for the other three asset groups and hopefully all the 14 assets on the network will each have their current condition established and the approximate rate of deterioration determined to achieve unique maintenance solutions (Van Mossel 2008).
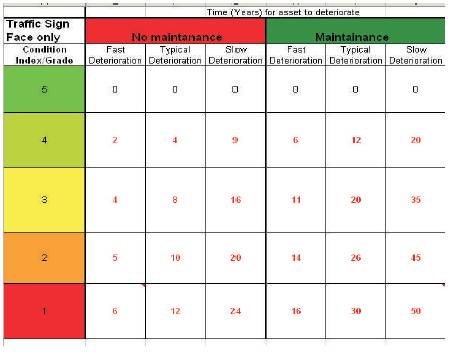
Figure 3. Time taken (years) for Sign Face to Deteriorate under Maintenance and Under No Maintenance
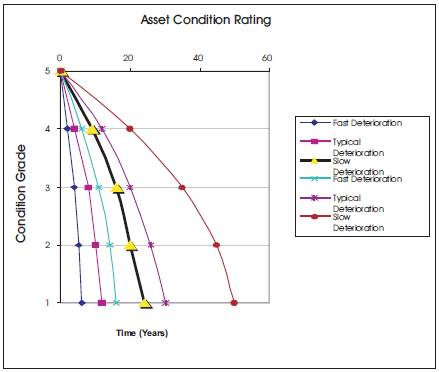
Figure 4. Deterioration Curve for Traffic Sign Asset
Collecting the asset condition data and establishing the deterioration paths of the different assets to the highway asset owner and the service providers as it gives them the general idea of where the asset condition should be and they can monitor the condition of the asset and ensure that the asset is not allowed to deteriorate rapidly. Maintenance can thus be prioritised and optimised if the deterioration path is established. After establishing the deterioration rates of the asset, various mitigation scenarios will be produced. The resulting various whole life cycle costs scenarios will provide the decision makers in this case the HA, with a wider view in the final choice between alternatives. The HA will also have to apply their own judgement which will be, inevitably, subjective to an extent Flanagan et al. (1987).
By adopting principles of whole life cycle costing for the maintenance of highway assets, maintenance costs are drastically reduced (Straub, 2009). Unfortunately, due to insufficient budget allocations, service providers often defer the maintenance and preservation of certain areas of the network Dornan (2002) which results in more expensive interventions in future. Due to the complexity of WLCC calculations, (Kishk, 2001) the usefulness of the approach of WLCC models is limited. Models that will be produced for the four asset groups will be analytical excel spreadsheets and no simulation techniques such as Monte Carlo analysis will be used. Monte Carlo analysis has been criticised for its complexity and the expense in terms of computation time and expertise required to extracting the knowledge (Byrne, 1997; Edwards and Bowen, 1998). However, (Emblemsvag, 2001; Fabrycky and Blanchard, 1991) encourages the use of Monte Carlo simulation to deal with the uncertainty.
Asset management is more than just a maintenance approach. If properly implemented, it should influence all aspects of the life cycle for highway infrastructure, including planning, design, construction, maintenance, rehabilitation, and disposal / recycling or replacement (Hudson et al., 1997). It emphasises cost-effectiveness over the full economic life of the asset. Asset management encourages infrastructure managers to consider the trade-offs between deferred maintenance and preventive maintenance, between short-term fixes and long-term solutions, between today's costs and tomorrow's benefits (Shewan and Kovacs, 1995).
Life cycle costing (LCC) was originally designed for procurement purposes in the US Department of Defence (White and Ostwald, 1976) and is still used most commonly in the military sector as well as in the construction industry (Woodward, 1997). The construction industry has largely acknowledged the benefits that whole life cycle cost (WLCC) based decision-making can bring to the design and operation of building assets (Kirkham, 2005). This definitive shift by the industry was prompted by recommendations of the Egan Commission, (1998), the Latham report, (1994) and has underlined the commitment to clients that industry stakeholders have to delivering products that demonstrate value for money over the long-term (Kirkham, 2005).
Applying the principles of whole life cycle costing leads to a decision based on best lifetime value (White and Ostwald, 1976). Whole life cycle costing is a means of comparing options and their associated cost and income streams over a period of time taking into consideration the time-value of money and inflation (Fabrycky and Blanchard, 1991).
Figure 5 indicates the various stages of the life cycle of a highway asset from inception to disposal. Unlike other assets, infrastructure assets cannot be allowed to “run down” to a salvage value before being replaced otherwise they present a safety issue. Infrastructure is hardly ever replaced. Its service life is continually renewed through maintenance and by the replacement of individual components which allows the system to continue in service indefinitely (Burns et al, 1999).
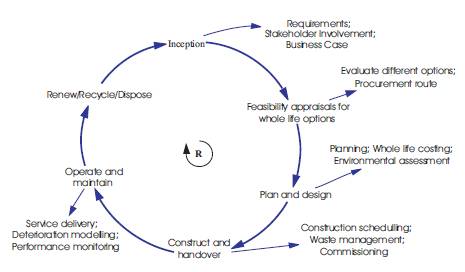
Figure 5. Life Cycle of a Highway Asset
There are relatively few articles written about the frequency of WLCC use and the literature in the field of WLCC is quite fragmented (Korpi and Ala-Ruski, 2008). Understanding the whole life cycle of an asset enables owners and managers to maximise the benefits and minimise the costs and risks of ownership over the asset's life (CIRIA, 2009). In spite of the obvious long-term benefits of whole life cycle costing WLCC, its adoption has been relatively slow (Lindholm and Suomala, 2004; Woodward, 1997). Possible reasons for the slow adoption include the lack of standard or formal guidelines and the lack of reliable historical data (Ardit and Messiha, 1999). Barriers to successful implementation of whole life cycle costing includes availability of suitable data, project finances, and short term interest of clients (Pasquire and Swaffield 2002).
BS ISO 15686-5, the International Standard that help bring consistency to the whole life cycle costing of construction projects describes whole life cycle costing as:
“The economic assessment considering all agreed projected significant and relevant cost flows over a period of analysis expressed in monetary value. The projected costs are those needed to achieve defined levels of performance, including reliability, safety and availability”.
In terms of the highway asset, the defined levels of performance also include a serviceable and sustainable asset that gives best value to its customers. Best value does not always equate to the cheapest capital cost; rather it is the specification that will provide long-term reliability, efficiency and economy (CIRIA, 2009). The lowest capital cost might seem attractive to begin with, but often leads to costly lifetime maintenance and replacement costs.
(CIRIA, 2009) identifies some of the reasons the principles of whole life cycle costing have not been fully adopted by the industry as the typical separation in businesses of capital and operational management, the inherent uncertainty about forecasting future costs, a lack of confidence about applying WLCC techniques, the intense scrutiny of project spending, leading to budget overruns and the misapprehension that WLCC has been applied by adding up the various costs of an asset over its lifetime instead of using the principles of WLCC to inform asset scope, design and procurement. The lack of long-term maintenance programs for the highways and the lack of accountability for highway assets by the asset owners contributes to the premature deterioration of the asset resulting in some decision makers perceiving highway infrastructure as merely a “sunk cost” Dornan (2002).
According to PAS 55:1-2008, an organisation shall establish, implement and maintain processes and procedures to monitor and measure the performance of the asset management system and the performance and condition of assets. The processes shall provide for the consideration of reactive monitoring to identify past or existing nonconformities in the asset management system, and any asset-related deterioration, failures or incidents or proactive monitoring to seek assurance that the asset management system and assets and/or asset systems are operating as intended.
An organisation should develop the criteria for optimisation and prioritisation from the organisation's strategic values and goals, through a “top down” determination of criticality and appropriately weighted objectives. However, the practical evaluation of “what is worth doing, when” should be developed through a “bottom up” approach, starting with the optimisation of specific tasks or interventions on discrete assets, and building up to the optimal coordination of all life cycle activities for the asset system, and finally to the optimal programming of multiple activities across multiple assets. Figure 6 shows how these areas of optimisation apply to an asset portfolio. The diagram represents optimisation of individual interventions or actions on individual assets and task combinations on the same asset, or different assets within an asset system.
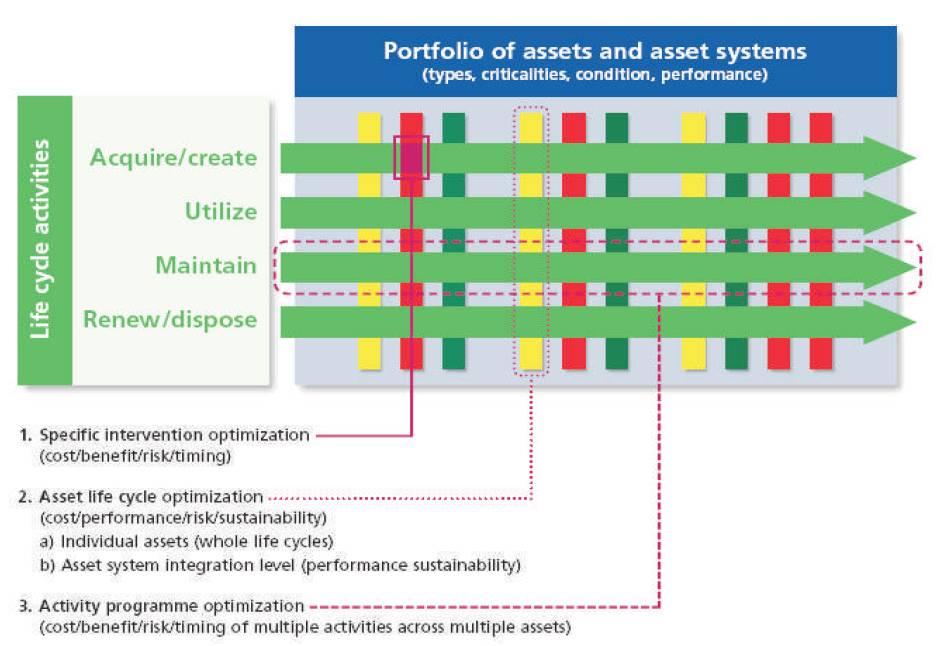
Figure 6. Optimisation applied to assets and asset systems PAS 55-1:2008
The outcome of optimisation is the selection of the best option out of a range of acceptable options. The process commences with the identification of the options available for the asset under consideration. Once each option is identified, it can be assigned estimates of costs and benefits which are both monetary and nonmonetary. The selected option is the one that shows the best return.
All of the defining articles in the field of WLCC (Asiedu and Gu, 1998; Emblemsvag, 2001; Fabrycky and Blanchard, 1991; Woodward, 1997) acknowledge the stochastic nature of WLCC calculations. These sources suggest sensitivity analyses to be done in order to cope with the uncertainty. We will try to make the analysis process more objective, straightforward, and less expensive, so that the WLCC technique can receive extensive practical application in the industry (Kishk, 2004). For the four asset groups mentioned in this paper, an age profile based on the expected design life was established for each asset group and sub-group. Using the design life appropriate to each asset, the future renewal profile of the current asset was forecast. The production of these models will not be discussed in this paper but in future papers.
Figure 7 illustrates the economic benefits of asset management as it applies to highway pavements. It shows how pavement condition changes over time when maintenance is deferred, whilst Figure 8 shows that preventive maintenance can extend the life of the asset. New assets generally remain in good-to-excellent condition for several years with little or no upkeep, the rate of deterioration rapidly increases after 7-10 years (Dornan et al, 1999). At approximately 20 years, the entire pavement must be replaced at high cost. However, periodic preventive maintenance efforts (such as crack sealing, drainage cleaning, or the application of thin overlays) can significantly extend the longevity of pavements, to up to 60 years (Dornan, 2002).
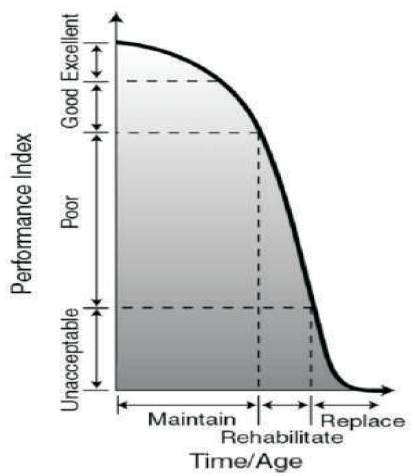
Figure 7. Typical Deterioration Curves for the Pavement (Dornan et al, 1999)
In order to handle the uncertainties in WLCC processes, Kishk (2001) proposed an integrated framework to handle these uncertainties. Figure 9, shows how data is evaluated in terms of availability, tangibility and certainty. As the levels of these measures increase, the problem of complexity decreases, from left to right. In cases where all data can be known with certainty, the WLCC problem is modelled deterministically. Where there are unknowns, this can be modelled stochastically. The lower part of Figure 8 reflects the need to integrate all forms of solutions attained through various theories before a decision can be made.
Engelhardt et al. (2003) examined the importance of developing enhanced WLCC models for improving capital investment decision-making in civil infrastructure applications, and Kirkham et al. (2002) proposed improvements in the data collection process during the design stage. Kirkham et al. (2002) considers the problems of WLCC data handling from a statistical perspective, presenting metrics for sampling operational cost data that is appropriate for WLCC modelling. Jackson (2002) presents a web-based risk simulation tool that can interact with whole life and risk data, enabling designers to minimise the cost of uncertainty and achieve designs for optimum whole life cycle cost and performance and (Kirkham, 2005) suggests that most applications of WLCC are retrospective and not iterative.
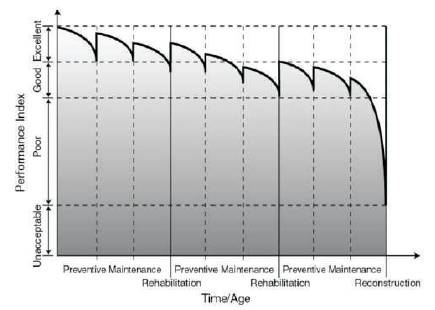
Figure 8. Preventive Maintenance Pavement Performance Curve, Dornan et al, (1999)
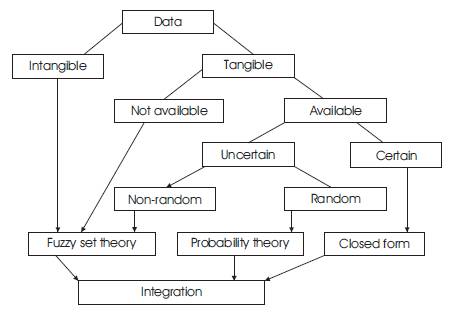
Figure 9. Handling Uncertainties in WLCC Modelling (Kishk, 2001)
Current models for predicting highway assets maintenance include the Highway Development and Management Tool (HDM-4) developed by the World Bank to combine technical and economic appraisals of road projects and to analyse road network strategies. The UK Highways Agency uses SWEEP.S and SWEEP.N software. SWEEP.S allows the user to identify and prioritise user defined options using WLCC on a scheme by scheme basis as well as providing the user with budgetary analysis tools to prioritise maintenance budget. It incorporates costs of treatment options, traffic management, delay and accident costs due to road works whilst SWEEP.N is the network wide version of the scheme version.
The UK Pavement Management System (UKPMS) is the national standard for management systems for the assessment of local road network conditions and for the planning of investment and maintenance on paved areas of roads, kerbs, footways and cycle-tracks on local roads within the UK. The Rijkswaterstaat model is used by the Netherlands Ministry of Transport, Public Works and Water Management; whilst the Frangopol model has contributed to the further development of the bridge management methodology that has been set up by the UK Highways Agency. These listed models deals with either the pavement or structures. Other assets such as lines and studs, street lighting, safety barriers and traffic signs have no models. The authors of this paper are currently working on producing models for these four asset groups.
SWEEP analysis is only applied to schemes over £100,000 (£250,000 from 2009-10). In 2009, schemes examined by the National Audit Office to verify application of WLCC showed that the option chosen by the agency for renewal purposes was often not that with the lowest whole life cost. Effective highway asset management requires the asset owner to optimally and sustainably manage their asset and asset systems, their associated performance, risks and maintenance costs over the asset's whole life cycle. By integrating risk management into proactive asset management, the asset can sustain service delivery objectives whilst protecting against loss of service. This integrated approach will sustain sound asset stewardship and reliable customer service while helping to identify, avoid, and mitigate the impact of myriad hazards (Santora and Rande, 2008). (Santora and Rande, 2008), describe asset management business practice objectives and functions as optimising asset performance, moderate capital expenditures over time, extend asset life, and protect interdependent infrastructures and maximising value to the stakeholders.
The National Audit Office (NAO), 2009 recommended that the HA should adopt a more active role in the design of the planned maintenance programme, through use of whole life cost analysis and to give a higher priority to developing and implementing the HA's Integrated Asset Management System and to take steps to extend whole life costing methods to its non-pavement network assets. An integrated asset management system is essential to coordinate and optimise the diversity and complexity of assets in line with the organisation's objectives, priorities and chosen risk profile (PAS 55-1:2008). Asset management should encompass every stage of the life cycle of the asset (CIRIA, 2009).
To manage complexity in highway asset management, an integrated asset management system is vital to any organisation that depends on the function and performance of their physical assets in the delivery of services. The key principles and attributes of asset management are shown in Figure 10. To successfully implement these principles requires an organisational structure that facilitates this through a clear direction and leadership and adequate information and knowledge of asset condition, asset performance, risks and costs, and an understanding of the interrelationships between these.
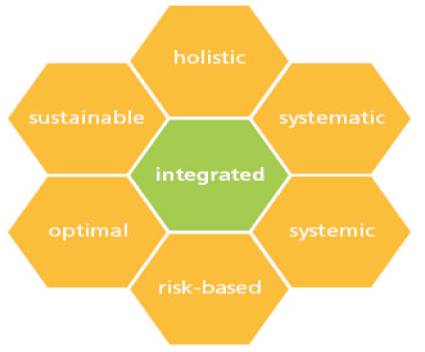
Figure 10. Key Principles and Attributes of Asset Management (PAS 55-1:2008)
Delivering best value for money in the management of physical assets is complex and involves careful consideration of the trade-offs between performance, cost and risk over all stages of the assets' life cycle together with the inherent conflicting factors to manage, such as short-term versus long-term benefits, expenditures versus performance levels, planned and unplanned availability, or capital costs versus operating expenditures. The best value compromise should be considered as the strategy or decision that results in the lowest combination of WLCC, risks, performance or service losses and other negative effects on business goals such as damage to reputation or sustainability (PAS 55-1:2008).
Infrastructure asset management is the life cycle management of physical assets to maximise the intrinsic value of taxpayers' investment (Santora and Rande, 2008). The Publicly Available Specification 55 (PAS 55) first published in 2004 sets out the construction industry standards for asset management and the requirements for consultations with stakeholders to ensure their inputs are incorporated in the development of the asset management strategy, objectives and plans.
PAS 55 describes asset management as:
“Systematic and coordinated activities and practices through which an organisation optimally and sustainably manages its assets and asset systems, their associated performance, risks and expenditures over their life cycles for the purpose of achieving its organisational strategic plan.”
The organisational strategic plan is defined as:
“The overall long-term plan for the organisation that is derived from, and embodies, its vision, mission, values, business policies, stakeholder requirements, objectives and the management of its risks.”
The importance of asset performance and condition monitoring and continual improvements within the asset management system is vital to an organisation achieving its organisational strategic plan as highlighted in Figure 11. The diagram further demonstrates the importance of continual improvement externally through direct influence upon the organisational strategic plan and stakeholder expectations. The organisational strategic plan is the starting point for development of the asset management policy, strategy, objectives and plans which in turn, direct the optimal combination of whole life cycle activities to be applied across the diverse portfolio of asset systems and assets in accordance with their criticalities, condition, and performance and chosen risk profile of the organisation.
Effective implementation of asset management requires a disciplined approach which enables an organisation to maximise value and deliver its strategic objectives through managing its assets over their whole life cycles. This includes determination of appropriate assets to acquire or create in the first place, (Figure 12) and how best to operate and maintain them and the adoption of optimal renewal, decommissioning and/or disposal options. Asset management is a proven and essential process for helping the maintenance and expansion of highway infrastructure (Dornan, 2002). It is a promising new approach to infrastructure management (McNeil et al., 2000) and represents a cost-effective way to demonstrate prudent stewardship of highway infrastructure and represents a holistic and systematic approach to asset development and preservation that ensures maximum service performance at minimum life cycle costs (Lemer, 1999).
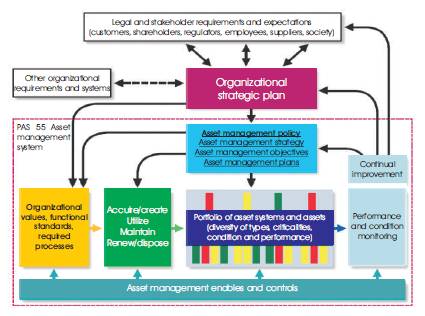
Figure 11. Overview of the Asset Management System, its relationship to the Organisational Strategic Plan and Stakeholder Expectations PAS 55-1:2008
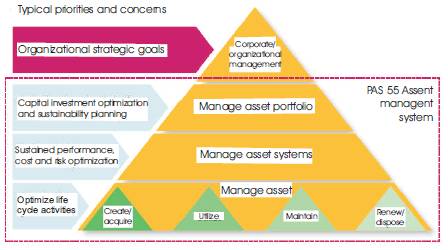
Figure 12. Levels of Assets and their Management PAS 55-1:2008
In December 2010, New Civil Engineer (NCE, December 2010) reported that the HA will be replacing the current MAC contracts with the asset support contracts that are outcome based so as to prevent sub-optimisation and promote continuous improvement through innovation and efficiencies that will be incentivised. Currently, there are no direct incentives for contractors to minimise whole life cycle costs (NAO, 2009). These performance-based maintenance contracts ensure thinking and working in terms of ends rather than means (Straub, 2009; Meacham et al., 2005) give service providers incentives to improve their way of working. However, performance criteria are explicitly stated by the client (Straub, 2007) and innovative, cost-effective solutions that meet the performance criteria can be achieved through the adoption of whole life cycle costing approaches. Just like the current MAC contracts, maintenance activities are assigned to the contractor over a long period encouraging continuity which will result in lower indirect project costs throughout the contract and helps the service providers to reduce overhead costs and to improve their internal business processes, with more efficient allocation of resources (Straub, 2009).
There is evidence from the Scottish Government's long-term road maintenance contracts, lasting up to 10 years, that indicates that significant savings can be achieved through giving contractors a pipeline of work that incentivises investment in year-on-year improvement, for example by reducing labour cost through improving productivity. The Rijkswaterstaat in the Netherlands has also generated savings like the Scottish Government of 20% in roads, by extending contract terms from one to two years to five to seven years and by bundling more maintenance activities together in the same contract.
To show the value of increased investment in infrastructure assets including the highway, there is need for a national long-term vision for infrastructure. Without a strong national vision, infrastructure will continue to deteriorate. In the USA, Infrastructure experts participated in roundtable discussion addressing the need for a long-term national vision for infrastructure management and to address whole life cycle costs and ongoing maintenance. The experts pointed out that while asset owners do plan, their plans rarely develop in an integrated manner and that these plans only meet short-term objectives due to a lack of shared goals or priorities to achieve future vision for infrastructure.
The UK government has already seen the need for an infrastructure vision. In October 2010, the UK government for the first time published a National Infrastructure Plan outlining the Government's vision for the future of UK economic infrastructure. The plan outlines the scale of the challenge facing UK infrastructure and the major investment that is needed to underpin sustainable growth in the UK. The plan gives clarity on the role of Government in specifying what infrastructure is needed and how it can remove barriers to mobilise both private and public sector resources to maintain this world class infrastructure.
The process of producing prediction models for four highway asset groups is still continuing and the outcomes will be reported in a future paper. Reliable asset condition data is required to enable prioritisation of funding for maintenance. Four prediction models for street lighting columns, safety barriers, lines and studs as well as traffic signs are currently being developed to assist in evaluating how much funding is required to maintain the asset safely, and to determine how long it will take before the next intervention is required and how long it will take to clear any maintenance backlog. If the level of funding is not adequate then the maintenance backlog will increase, the asset will continue to deteriorate and more funding will be required to bring the asset back to a serviceable state. Development of the models is in its infancy and is based on five years data. We hope that as the data is collected over several years, on a consistent basis, the prediction models over time will be refined and more accurately reflect true conditions.
Understanding the asset's condition and being able to determine its remaining life enables the optimum timing of asset replacement. Knowing the value of the asset allows more accurate budgeting for maintenance and prediction of future expenditure more accurately and encourages better justification of spending to stakeholders. Constraints in managing the highway asset efficiently include inadequate funding, unreliable asset condition data, an aging asset, increased accountability to customers and increased public expectations.
For the economy to flourish, people, goods and information must move freely. This requires a safe, serviceable, sustainable and reliable highway network. Availability of the highway asset enhances the quality of life because it provides the opportunity for other things to happen. The effective, economic and efficient management of a nation's infrastructure is an underlying component of the nation's successful economy. Without appropriate management and development of this infrastructure, the nation's economy will suffer. Deferring asset maintenance investment, risks not only grow but the UK's international competitiveness. Insufficient maintenance can dramatically reduce the life of the highway asset whilst good maintenance can ensure that the service life potential is extended as far as possible before renewal is eventually needed (Burns et al, 1999). Research has shown that preventive maintenance can reduce the whole life cycle costs for pavements by 75–90% (Martin and Roper, 1997a). Good asset management provides asset owners the opportunity to demonstrate stewardship of their asset (Dornan, 2002) and to demonstrate best value over the long term. Whole life cycle cost analyses and proper maintenance over the life of highway assets ensures the HA benefits in terms of much higher value for their money and receive a better level of service over the life of the asset.
While a lot of organisations use WLCC technique, many businesses still focus on minimising the up-front capital costs of their assets, rather than considering all the other costs such as designing, operating, maintaining, upgrading and decommissioning costs (CIRIA, 2009). Many decision makers are reluctant to embrace asset management and whole life cycle costing approaches because of the long timeframe needed to demonstrate the benefits of asset management. Instead, many do not view highway assets as tangible assets whose inherent value can be used to stimulate further economic activity, but view highway investment as sunk costs. It is therefore essential that some way be found to realise the long-term benefits of highway asset management in the short term (Dornan, 2002).