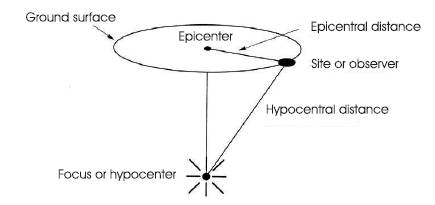
Figure 1. Schematic Representation of Earthquake Location
For estimation of seismic forces on buildings IS: 1893-2002 specified response spectra are used. Code specified zone factor and response spectra are applicable for the general soil conditions. But the peak ground acceleration and seismic effects on buildings depend on sub soil condition, as evident from damages occurred to buildings of Ahmedabad during Bhuj Earthquake. In the present paper response of soil to seismic event is evaluated in terms of site specific response spectra and acceleration time history at ground surface using software ProSHAKE. The site specific response spectrum obtained at various sites of Ahmedabad are compared with the standard response spectrum given in IS 1893:2002 for medium soil condition. The dynamic response spectrum and time history analysis of 3-D shear wall framed buildings, with different shear wall positions, is carried out using ETABS software. Comparisons of analysis results obtained in terms of time period, base shear and design forces in ground floor shear wall considering site specific response spectrum, acceleration time history and IS 1893:2002 standard response spectrum are carried out.
Earthquakes are one of the most devastating of all natural hazards and are considered to be the most powerful natural disasters which are unavoidable. The hazards associated with earthquakes are referred to as seismic hazards. Structural design plays an important role in mitigation of seismic hazards in case of strong earthquakes, which in turn depends on estimation of earthquake forces on buildings. Codal provisions usually specify standard normalized response spectra for different soil conditions. Code specified response spectra are developed from statistical analysis of record of ground acceleration at different sites during various seismic events. These response spectra are applicable for the general soil conditions and give reasonable estimate of seismic forces acting on building.
Local soil conditions play an important role on behaviour of buildings during an earthquake. The devastating earthquake, with magnitude of 7.6, that struck the Kutch area of Gujarat state on January 26, 2001, was the most severe natural disaster to affect India. The city of Ahmedabad, in Gujarat state, situated on the banks of river Sabarmati, suffered severe damages despite being in seismic zone III, and at 250 km from the epicenter. This indicates that intensity of ground shaking or peak ground acceleration at different sites can be different during particular seismic event. During an earthquake there is release of energy, which reaches to the ground surface and to the structures by means of seismic waves. These seismic waves originate from the point of occurrence of the earthquake and travel through bedrock and soil strata, the structure is shown as in Figure 1 [1]. When these waves travel through the soil profile, their properties such as amplitude, velocity, acceleration, frequency etc. get altered due to various soil parameters. Thus local soil conditions play an important role in generation of response spectra. Response spectra developed for a particular site considering layered soil of different properties and seismic ground motion are very important for realistic estimate of earthquake forces on buildings.
Figure 1. Schematic Representation of Earthquake Location
In the present paper response of soil to seismic event is evaluated in terms of site specific response spectra at ground surface using ProSHAKE software [4]. The data required for development of site specific ground response analysis like soil profile, shear wave velocity etc are collected from geotechnical and geophysical investigations. Time history recorded at Passport office building of Ahmedabad on 26th January 2001, Bhuj earthquake is taken as an input motion. The site specific response spectrum obtained at various sites of Ahmedabad are also compared with the standard response spectrum given in IS 1893:2002 for medium soil condition. The site specific acceleration time history is also developed for various sites of Ahmedabad.
In order to study the effects of site specific response spectrum and acceleration time history, shear wall framed buildings have been chosen because of its wide application in high rise building as a lateral load resisting element. Shear wall frame building having three bays in each direction with different shear wall positions are considered. ETABS software is used for three dimensional structural analysis of shear wall framed building considering site specific response spectrum and time history. The results are obtained in terms of time period, base shear and design forces in ground floor shear wall. Comparisons of these analysis with results as obtained from site specific response spectrum and time history with analysis results obtained considering IS 1893:2002 standard response spectrum are carried out.
As shown in Figure 2 following are the steps undertaken to determine site specific response of soil [2].
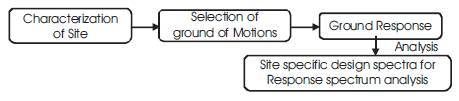
Figure 2. Steps for Site Specific Ground Response Analysis
Based on geotechnical and geophysical investigations properties of various layers of sub-soil are found up to bed rock or hard strata. The local characteristics of the site such as shear wave velocity, shear modulus of the soil deposits, unit weight of soil, thickness of soil layers are obtained from the available borehole data.
Appropriate rock motions i.e. natural acceleration time histories or synthetic acceleration time histories are selected to represent the design rock motion for the site. When the base of a soil deposit is subjected to a specific ground motion caused due to earthquake then at each increment of time there is dynamic response of the ground measured in terms of acceleration, velocity and displacement.
With the application of ground response analysis to a particular site, response of the soil to the earthquake is obtained. In ground response analysis, the bedrock motions developed due to earthquake are considered as the input motions to calculate acceleration time history and site specific response spectra of various sites.
The calculated ground surface motion is analyzed to develop the design spectrum for a site. The ratio of spectral acceleration calculated from response spectra and peak ground acceleration of the ground surface motion gives a site specific design spectrum.
The behavior of a soil deposit under the effect of seismic event is studied through ground response analysis. Usually the response of layered soil profile of particular site is obtained by applying an acceleration time history at bed rock level or at hard soil level. From ground response analysis, response spectrum and acceleration time history at ground level are obtained and further used for structural analysis of buildings. There are various methods to carry out Site Specific Ground Response Analysis such as: one-dimensional, Two-dimensional and Three-dimensional ground response analysis.
Complete ground response analysis must take into account various factors such as rupture mechanism at the origin of earthquake, propagation of seismic waves through the crust to the top of the bedrock, variation of soil profile in vertical and horizontal direction etc. It is difficult to quantify all these parameters and thus complete ground response analysis becomes highly complicated and time consuming. Therefore, one dimensional ground response analysis is preferred over other analysis methods due to its simplicity [3]. Further it provides conservative results and many projects in past had been designed using this methodology. A large number of commercial programs based on one dimensional ground response analysis are available for use on personal computers.
One-dimensional ground response analysis is based on the assumption that the ground surface and all material boundaries below the ground surface are horizontal and response of a soil deposit is caused by seismic waves propagating in the vertical direction below the bedrock. The method is based on the lumped mass model of sand deposits resting on rigid base to which seismic motions are applied.
One-dimensional ground response analysis is performed using ProSHAKE software [4]. In ProSHAKE software one dimensional equivalent linear ground response analysis of horizontally layered soil deposits is carried out. With the help of ProSHAKE software, site specific ground response analysis of various sites of Ahmedabad city is performed. ProSHAKE provides the results of acceleration time history, ground response spectra and depth plots of various sites. The obtained results of various sites are further compared with each other. Site specific ground response analysis of following sites is performed:
For the above mentioned site locations, the geotechnical borehole data is collected from the Geotechnical Laboratory, Department of Civil Engineering, Institute of Technology, Nirma University. The data consists of information about properties of soil up to bedrock or up to hard strata. The properties include thickness of soil layers, unit weight and standard penetration test (N) values. The geotechnical data required for ground response analysis are thickness of material, shear wave velocity, modulus curve and damping curve. The important soil profile data given as input in ProSHAKE are presented in Table 1 to 4. Screenshots of ProSHAKE software for ground response analysis are shown in Figure 3. It shows various stages of input of ProSHAKE software like defining material properties of each layer, profile of particular site with location of input motion and location where response spectra, acceleration time history are required with relevant data.
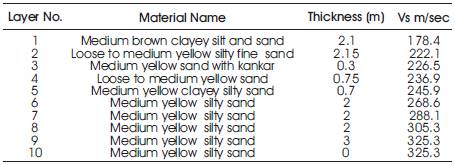
Table 1. Soil Profile- Motera Site
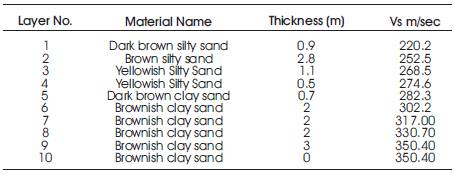
Table 2. Soil Profile- Paldi Site
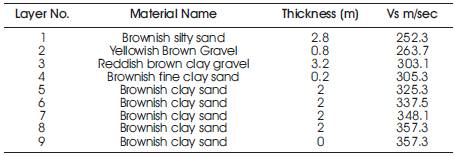
Table 3. Soil Profile- Chandkheda Site
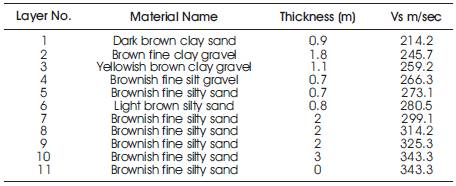
Table 4. Soil Profile- Sola Site
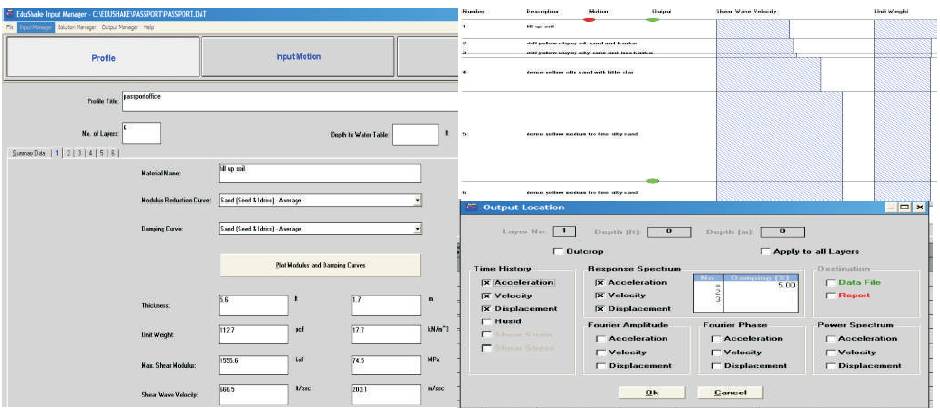
Figure 3. Ground Response Analysis using ProSHAKE Software
The actual recorded ground motions during Bhuj earthquake on January 26th 2001 at ground floor of Passport Office building are modified to generate artificial ground motions using ProSHAKE. The artificial acceleration time history thus computed at 15m depth of Passport Office site is considered as input motion for all sites. Subsequently acceleration time histories and spectral accelerations are computed at ground surface for all sites of Ahmedabad using ProSHAKE. Further site specific response spectra are compared with the standard response spectra of IS: 1893 (Part I)-2002 [5] as shown in Figure 4. From comparisons it is observed that site specific response spectra gives higher values of (Sa/g) as compared to IS 1893 specified response spectra for buildings having lower time period. The peak values of Sa/g are 6.43, 3.89, 3.89, 379 for Motera, Paldi, Chandkeda, Sola site respectively as compared to 2.5 specified in IS:1893. This indicates that low rise buildings having time period in range of 0.2 to 0.4 sec experience higher seismic forces as compared to IS:1893 specified seismic forces.
Site specific acceleration time histories for four sites of Ahmedabad are presented in Figure 5. Acceleration time history gives acceleration of ground at different time interval. This time history is applied to building to understand actual response of building to earthquake ground motion. From Figure 5, it is observed that peak ground acceleration of ground is different at different sites. So response of same buildings on different sites will be different. Dynamic parameters at the ground surface like peak displacement, peak velocity and peak acceleration are presented in Table 5. Peak ground acceleration is similar to zone factor as specified in IS:1893. From Table 5 it is observed that of peak ground acceleration in terms of 'g' (gravitational acceleration) is 0.220, 0.116, 0.110, 0.108 for Motera, Paldi, Chandkheda, Sola sites respectively compared to 0.160 as specified in IS 1893.
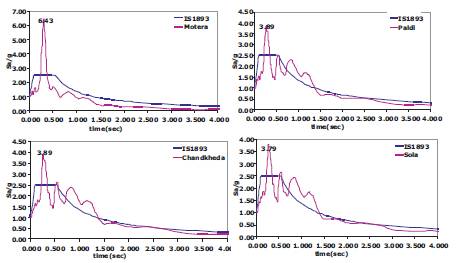
Figure 4. Comparison of Response Spectrum of Various Sites and IS 1893
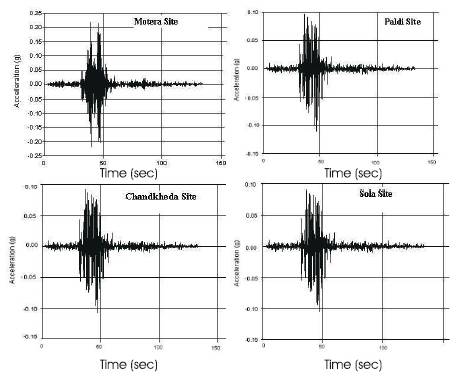
Figure 5. Site Specific Time histories at various sites of Ahmedabad
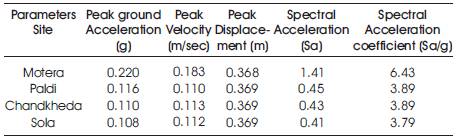
Table 5. Comparisons of Dynamic Parameters of Sites
To understand the effect of site specific response spectrum on analysis of multistoried building a shear wall building is considered in this study. When walls are situated in advantageous position in a building, they can form an efficient lateral load resisting system, while simultaneously fulfilling other functional requirement. Four geometric positions of shear walls i.e., central, middle sided, outer sided and corner sided are considered. Further the number of storey is considered as 10, 20, and 30 storey. Plan of building is shown in Figure 6. Height of each story is considered as 4 m. The dimensions of various structural elements are given in Table 6. Live load of 4 kN/m2 is considered in all the buildings.
The dynamic analysis of the multi-storey buildings is carried out using ETABS software [6]. ETABS, Extended three dimensional Analysis of Building Structures, is user friendly, special purpose analysis and design software developed specifically for building systems. ETABS Version 9 features an intuitive and powerful graphical interface with modeling, analytical, and design procedures. Although use of ETABS is quick and easy for simple structures, ETABS can also handle large and complicated building models, including a wide range of nonlinear behaviors. The results of dynamic analysis of shear walled buildings are obtained in terms of time period, base shear and design forces in shear wall considering IS 1893 response spectrum and site specific response spectrum.
The time period based on dynamic analysis and IS 1893:2002 specification are compared as shown in Figure 7. It is observed that dynamic analysis gives higher time period compared to code specified time period given by 0.09h/d. For low rise building the difference is low compared to high rise building. Further code based formula gives same time period for different shear wall position with building having same number of stories. Base shear is obtained for 10, 20, and 30 storied building by site specific response spectrum analyses using ETABS software. The response spectrum function and related data are defined in ETABS as shown in screenshots of software in Figure 8. Comparisons of base shear in different shear wall position are carried out considering site specific response spectra and IS 1893 response spectrum. The same is presented in Figure 9. The base shear indicates total earthquake force acting on the building. It is observed that for different buildings site specific response spectrum analysis gives higher base shear compared to IS:1893 specified response spectrum analysis. For analysis of shear walled building various load cases and their combinations are considered as per IS 1893:2002. The design of shear wall is carried out by considering axial force, shear force and bending moment. These internal forces in wall are obtained by considering combinations of gravity loads and lateral loads with appropriate load factors as specified in IS:1893. The design forces in terms of axial force, shear force and bending moment are obtained from site specific response spectrum analysis of buildings. The results are obtained when earthquake force is acting in X-direction. The design axial force obtained by site specific response spectrum analyses and its comparison with IS:1893 specified response spectrum is shown in Figure 10. The variation in axial force is within 5% to 10% when different response spectrums are considered for analysis. Figure 11 presents comparison of design shear force in wall when analysis is carried out with different response spectrum. Except for 20 storey building site specific response spectrum gives higher design shear force. Figure 12 presents comparison of design bending moment in wall when different response spectrums are considered for analysis. For 10 storey building site specific response spectrum analysis of building yields higher design bending moment in the wall.
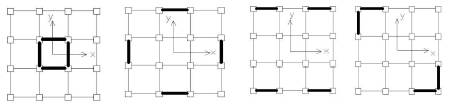
Figure 6. Geometric Positions of Shear Wall in 10, 20 and 30 storey symmetrical buildings
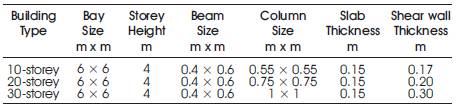
Table 6. Shear wall frame building properties
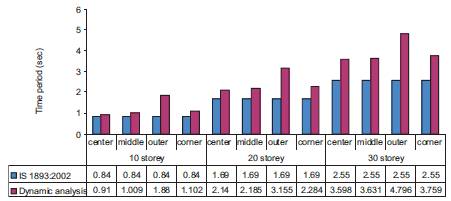
Figure 7. Comparison of Time period for various shear wall framed buildings
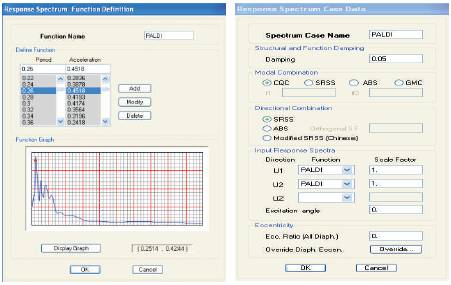
Figure 8. Response Spectra Case Data in ETABS
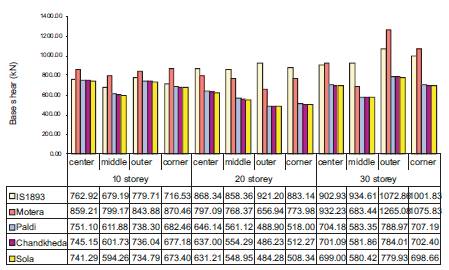
Figure 9. Comparison of Base shear for various buildings using Response Spectrum Analysis
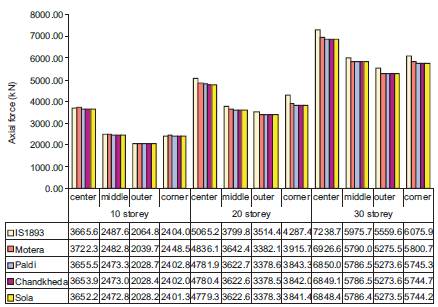
Figure 10. Comparison of Axial Force for various buildings using Response Spectrum analysis
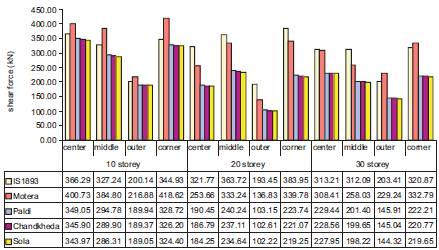
Figure 11. Comparison of Shear Force for various buildings using Response Spectrum Analysis
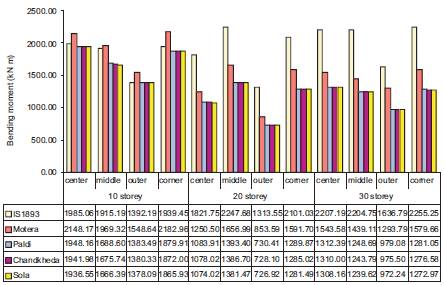
Figure 12. Comparison of Bending Moment for various buildings using Response Spectrum Analysis
For engineering purposes the variation of ground acceleration with respect to time is the most useful way of defining the shaking of ground during an earthquake. Time history analysis procedure [7] provides structural response of building as a function of time, but structural design is usually based on the peak value of forces and deformations over the duration of the earthquake induced response. For the single degree of freedom system this values can be determined directly from response spectrum. But, for the multi degree of freedom system this values determined directly from response spectrum does not give exact result. So, it is necessary to perform time history analysis for the important structure. The site specific time history analysis of the multi-storey buildings is carried out using ETABS software [6]. In the present study, site specific acceleration time history is obtained for various sites of Ahmedabad city using ProSHAKE software. The time history functions and load cases are defined in ETABS as shown in Figure 13. As the acceleration time history in longitudinal direction gives critical results, it is considered in analysis.
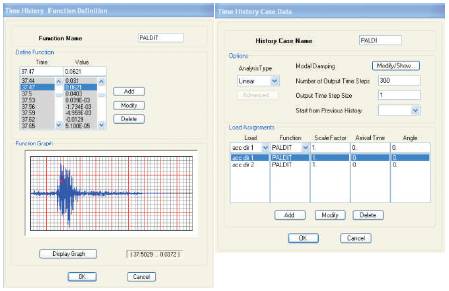
Figure 13. Time History Case Data in ETABS
In linear time history analysis, the building is first modeled in ETABS and acceleration time history is applied at the base of the building. The analysis results give displacement of building, internal forces in members at each time increment under a specific ground motion. The peak values of internal forces in members are considered for design of structure. The base shear obtained from a linear time history analysis has to be divided by response reduction factor associated with overstrength and ductility in the system and multiplied by the importance factor to arrive at the design base shear [8].
Analysis result obtained in terms of base shear is shown in Figure 14. IS:1893 response spectrum analysis gives higher base shear in comparison to site specific time history analysis of buildings. The design axial force in shear wall is presented in Figure 15. It is observed that for 20 and 30 storey buildings site specific time history analysis gives higher value of design axial force in most of the shear wall locations. Figure 16 presents design shear force in wall at different sites. In most of the cases IS 1893 response spectrum analysis gives higher value of design shear force compared to site specific time history analysis. The design bending moment for ground floor shear wall is presented in Figure 17. From comparison it is found that IS 1893 response spectrum analysis gives higher design forces.
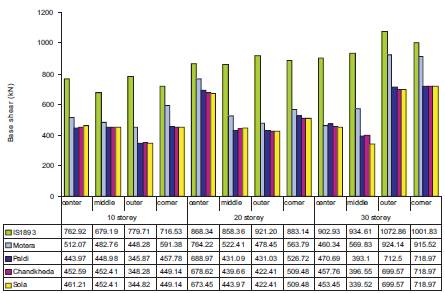
Figure 14. Comparison of Base shear for various buildings using Time history analysis
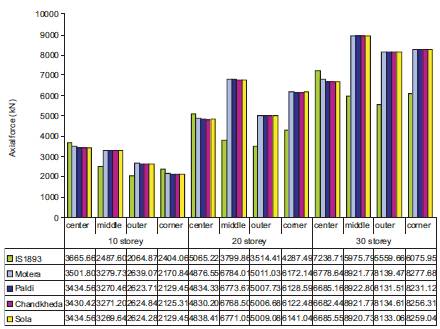
Figure 15. Comparison of Axial Force for various buildings using Time history analysis
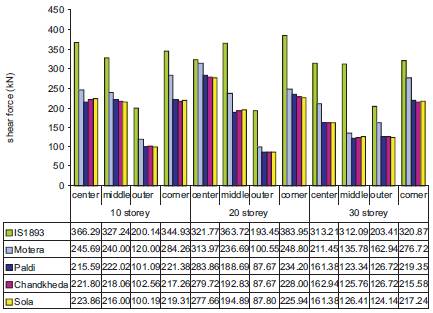
Figure 16. Comparison of Shear Force for various buildings using Time history analysis
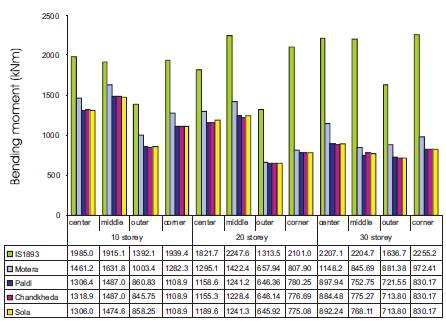
Figure 17. Comparison of Bending Moment for various buildings using Time history analysis
Site specific response analysis for four sites of Ahmedabad city is carried out using ProSHAKE software. From the available data of sub-soil strata and input motion of acceleration time history recorded during Bhuj earthquake of 26th January 2001, response spectra and acceleration time history for four sites are obtained. From comparison of response spectrum plot for longitudinal direction, it is found that IS 1893 response spectrum is having lower values of spectral acceleration (Sa/g) for structure having lower time periods. While IS 1893 response spectrum gives higher values of spectral acceleration (Sa/g) for structure having higher time periods compared to site specific response spectrum. This affects base shear of multistoried buildings and design forces in shear walled building. The buildings having time period in range of 0.2 to 0.5 seconds experience higher base shear compared to IS 1893 specified base shear.
From the comparisons of time period of buildings, it has been observed that IS 1893:2002 gives same time period for a particular building with different positioning of shear wall. It indicates that there is no effect of shear wall positioning on time period given by IS 1893:2002. While in case of dynamic analysis, it is observed that the shear wall position in center for all different high-rise buildings has the minimum time period in their first mode. Eventually it will attract more earthquake forces and it will be the critical case among the other shear wall positions. The maximum time period is observed in the case of buildings with the shear wall position at outer side.
From the comparison of base shear, it is observed that base shear considering site specific response spectrum is higher for 10 storey building with all shear wall positions. While in 20 storey building IS 1893 response spectrum gives higher value of base shear. In 30 storey building with outer and corner side shear wall, site specific response spectrum gives higher amount of base shear. So, site specific response spectrum gives realistic estimate of earthquake forces on buildings.
From results of design forces in ground floor shear wall it is observed that the design forces in shear wall are governed by site specific response spectrum in case of 10 storey building. The variation in design forces is 2% to 10%. Site specific response spectrum at Motera site gives higher design forces compared to other sites' response spectrum. Building with outer shear wall position gives lower design forces in shear wall while, center shear wall position case gives higher design forces than the other shear wall positions in building.
In case of time history analysis the building is subjected to ground acceleration and peak earthquake forces are the maximum forces acting on structure in the event of earthquake. Usually code specified seismic forces are reduced to take into account overstrength and ductility of structural system. From the result of time history analysis design earthquake forces are obtained by considering effect of 2 × R i.e., earthquake forces are divided by 2R. As per IS:1893 factor 2 is for converting maximum considered earthquake (MCE) to design basis earthquake (DBE) and factor R (=5) is response reduction factor for considering ductility of structural system. Otherwise the results of time history analysis would be very high as it is similar to maximum considered earthquake without considering ductility of structure. Base shear in all cases is governed by IS1893 response spectrum as compared to time history analysis. Shear force and bending moment in ground floor shear wall as obtained by IS:1893 response spectrum are higher compared to site specific time history analysis for all buildings. Time history analysis gives higher axial force for 10 storey shear wall building having middle and outer shear wall. For 20 and 30 storey buildings time history analysis gives higher axial force for all shear wall locations except in center. In all buildings Motera site acceleration time history gives higher base shear and design forces compared to other sites acceleration time history.
For regular buildings considered for the study site specific response spectrum analysis gives higher design forces compared to site specific acceleration time history. But for buildings having complicated and irregular geometry time history analysis may give higher design forces, which need to be investigated.
Microzonation studies of important cities are available, which specify site specific peak ground acceleration, response spectrum and acceleration time history in various part of city. If such data are available structural engineer can use the same for realistic estimation of seismic forces which lead to economical and safe structures. Structures designed by considering site specific response spectrum or acceleration time history will be neither over designed nor unsafe. With advances in computational tools it is easier to predict site specific ground response and to use it for structural design.
Based on the above study following conclusions can be made: