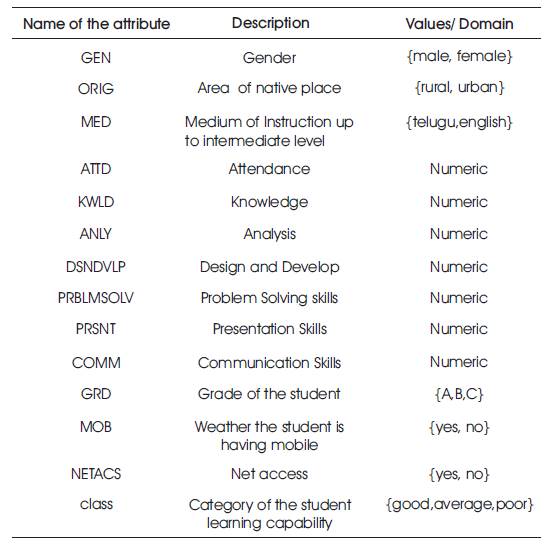
Table 1. Dataset related Attributes and their Description
Educational data mining is one of the fields where there is lot of scope for research, which helps educational institutions to analyse the learning capability of the students. And also gives scope to the educational institutions to make modifications in the curriculum and also to change the teaching methodologies based upon the learning capability of a student. Here, this paper concentrates on the learning capability of the students in higher educational institutions. For that, a dataset of 300 records was collected with various socio- economical and graduate attribute factors. Various classification algorithms was performed on the dataset using Weka, an open source tool. Random forest classification algorithm was found as the best performing algorithm on the dataset. This algorithm was used to design an user interface which is used to predict the future state of a student.
Data mining is the field where continuous research is happening. Lot of algorithms were proposed for increasing the accuracy. The main goal behind the data mining is to transform huge amount of data into a better understandable structure-Data mining is also considered as a knowledge discovery in databases-KDD. Pre processing is the major and primary step in data mining. Pre-processing is nothing but clearing of noisy data. As the data mining involves a multivariate dataset, preprocessing is essential. The data pre-processing also involves pre-processing of missing data.
Use of Data mining in the field of educational sector gives a scope for improving the teaching and learning practices. Here, the data may be collected from various socio and economical factors of a student. The main advantage of the educational data mining is that, the future can either be predicted or changed.
Educational data mining is the field that concentrates on the future prediction that helps to update the curriculum[1]. Research in the educational data mining leads to generate new methods for analyzing the data that is generated from educational sectors[2]. Enhancement of web based technology leads to provide various tools for browsing of resources on the web that leads to increase the scope of distance education [3]. E-learning is also a revolution in educational sector. Lot of learning resources are available on the web. Implementing of recommendation systems in the e-learning, benefits the user to get the best available resources [4]. The intelligent system can find the students who misuse the online resources. Misusing of the resource leads to reduce the learning capability of the students. The intelligent system can also find the resources that are frequently used by the students [5-8].
Outcome based education is the recent teaching and learning practice in higher educational institutions such as engineering institutions. Here in this practice we have 12 graduate attributes including knowledge, analysis, design and developing skills, problem solving skills, presentations skills, communication skills, etc.
In this work, 6 graduate attributes were taken into consideration and also various socio-economical factors around the students such as, Gender of the student, native place of the student, Medium of the student in which the student completes his education up to HSC, Does the student is having Mobile phone, Whether the student has an internet facility or not and also attendance of the student which shows lot of impact on the student learning perspective was taken into the consideration to collect the dataset.
Here in this paper, a dataset of 300 records was taken and various classification techniques were performed such as J48, Decision stump, FT and Random forest. The attributes are as represented in Table 1.
Table 1. Dataset related Attributes and their Description
The students are classified into three categories according their learning capability such as good, average and poor learners. Here various graduate attributes such as knowledge, analysis, communication, problem solving, design and develop, presentation skills was taken into the consideration for collecting the data. The performance analysis of various algorithms was as represented in Table 2.
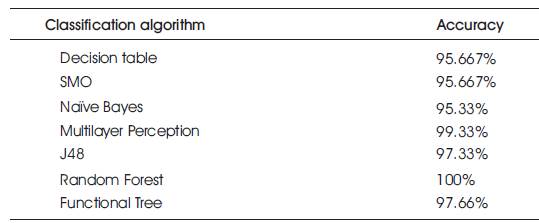
Table 2. Classification accuracy of different classification algorithms
Random Forest classification algorithm show a 100% accuracy. Hence in this paper, the Random forest classification algorithm was used to design the user interface that predict the future state of the student. The graph in Figure 1 represents the accuracy rates of various classification algorithms.
Table 3 represents the detailed accuracy by a class of various classification algorithms.
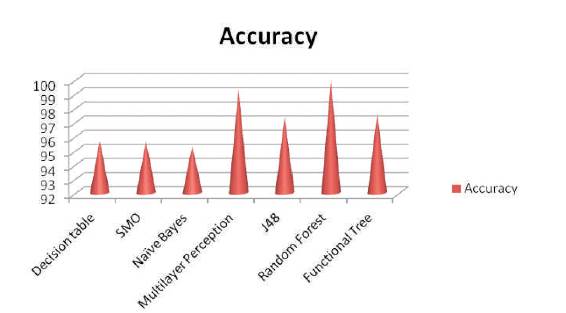
Figure 1. Accuracy Comparison of various Classification Algorithms
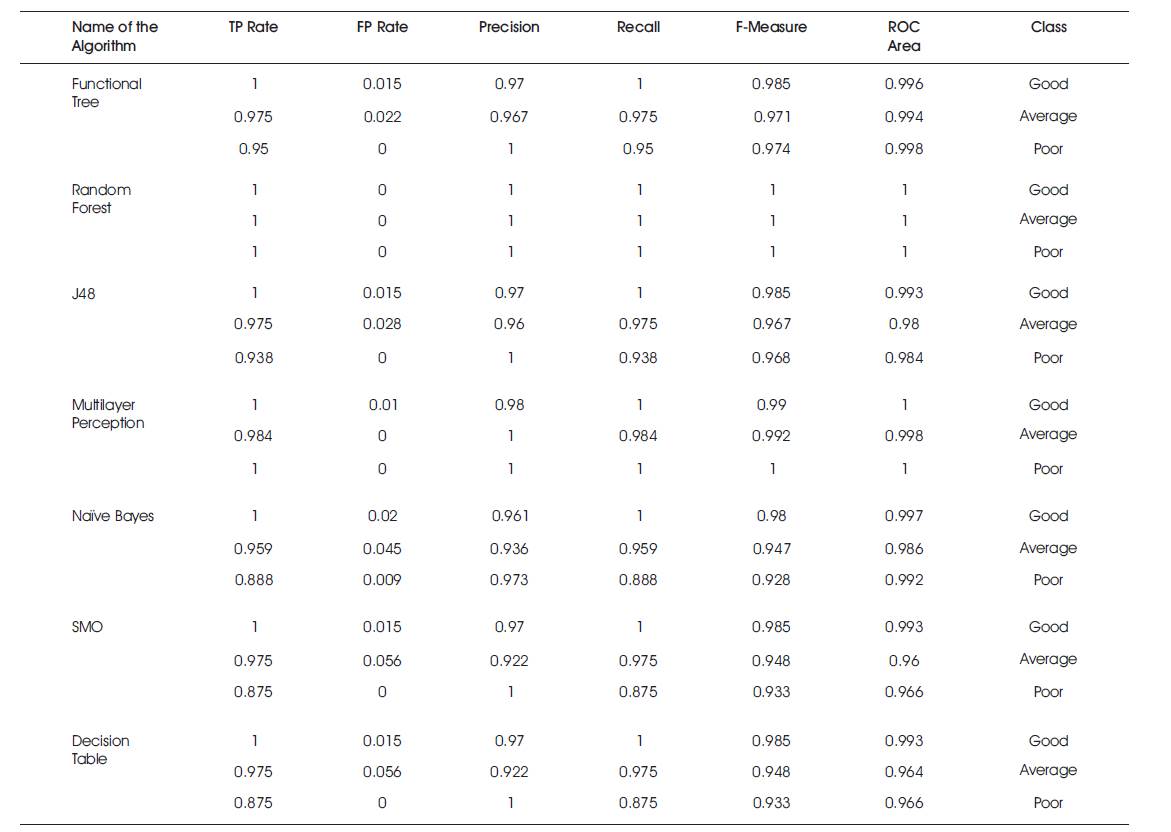
Table 3. Analysis of Statistics of Different Classification Algorithms with Cross Validation
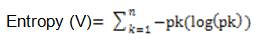
Entropy is calculated based on the uncertainty related with the random variable. As the randomness increases Entropy will also increase.
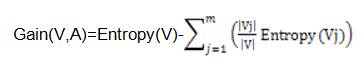
So as represented above, the gain of individual attributes will be calculated and the attribute which is having the highest gain will be placed in the root node position.
A sample case study was taken with 15 records and individual gains of the attributes were as represented in Table 4.
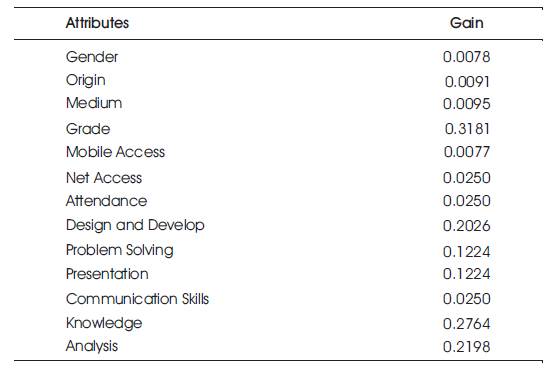
Table 4. Gain Values of Different Attribute in the Dataset
The main idea behind Random forest classification algorithm is that, the combination of learning models increases the accuracy. Random forest classification algorithm will work as a huge collection of cross correlated decision trees.
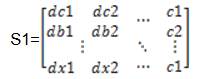
For example, if we are having a dataset of n records as represented below.
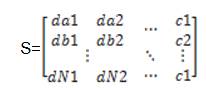
Then, the Random forest classification algorithm will construct separate m sample datasets as represented below.
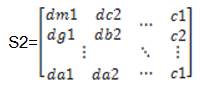
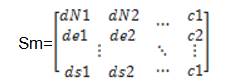
By using sample dataset S , decision tree1 will be 1 constructed. And by using sample dataset S , decision 2 tree2 will constructed. Likewise, we can construct m decision trees using m sample data sets.
The class which is shown by maximum number of decision trees will be considered as the final class of random forest classification algorithm.
Figure 2 is a part of random tree generated by the Random forest classification algorithm.
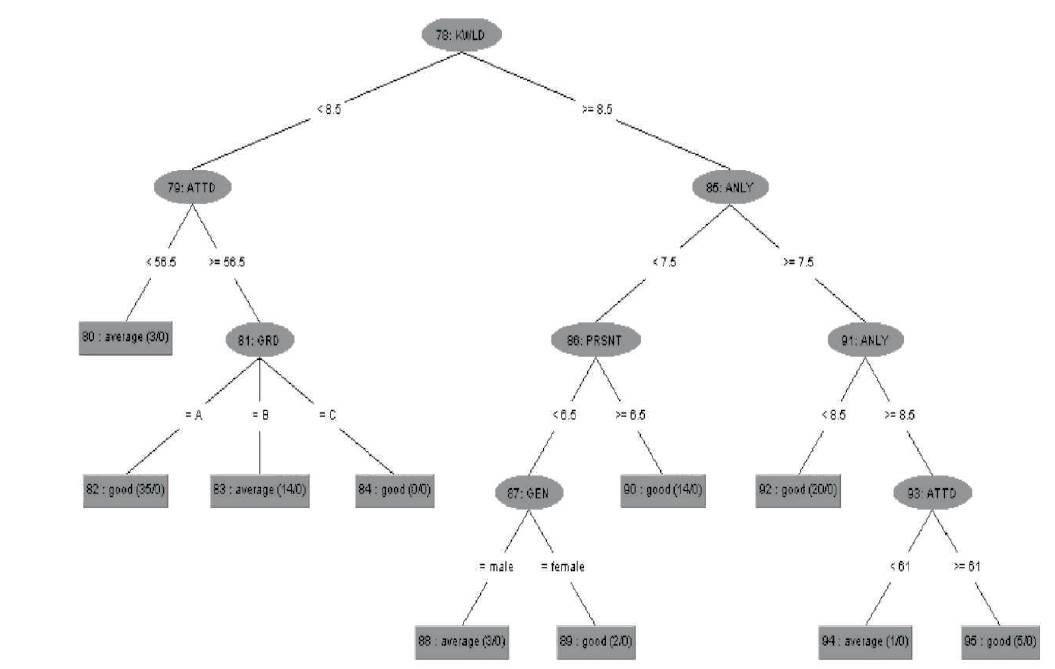
Figure 2. Sample Tree generated by Random Forest Classification Algorithm
Figure 3 represents the system architecture of an user interface. It is designed mainly with two modules.
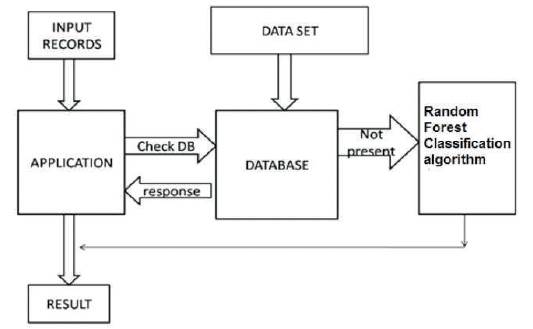
Figure 3. System Architecture
In the application module, the user interface considers the three year data of a student in ARFF file, which is the prescribed format for Weka tool and the given input will be taken as the test set.
In this module, the Random Forest classification algorithm was implemented, which takes the given three files as te test set and the predefined file as the training set. The Random forest classification algorithm will work on these training and the test sets and the future state will be predicted based on these results.
Figure 4 is the Knowledge flow diagram drawn in the Weka, an open source tool. The above diagram will generate the performance evaluation chart. By using performance evaluation chart, we can compare the performance of various algorithms on the given dataset.
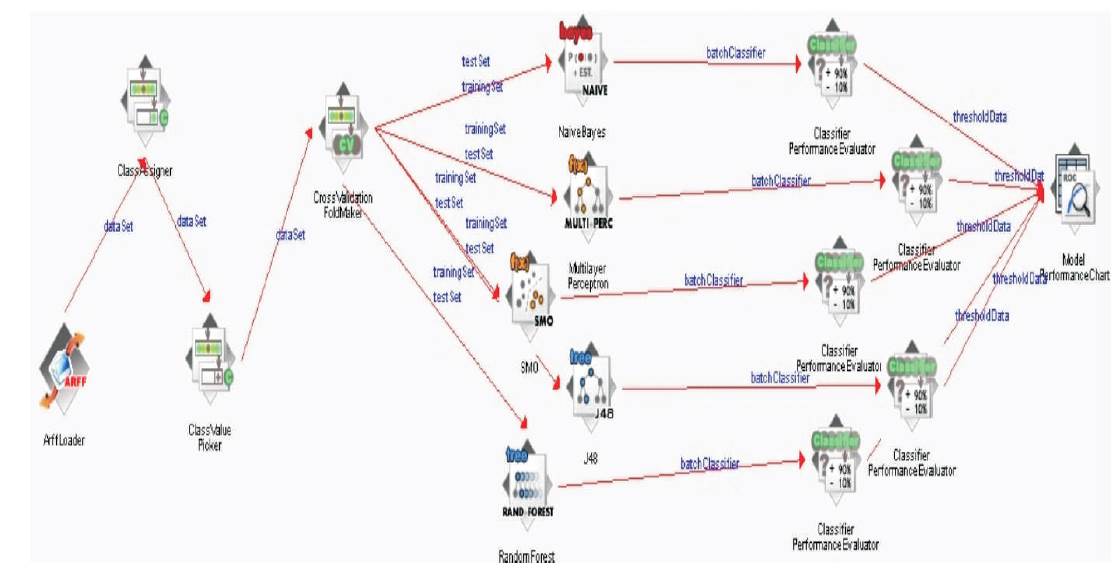
Figure 4. Knowledge Flow Diagram
Here, the knowledge flow diagram was drawn with the help of five classification algorithms such as Naïve Bayes, Multilayer Perception, SMO, J48 and Random Forest. The The generated Performance evaluation chart is as represented below.
Figure 5 is representing the model performance chart which is drawn against the false positive rate and true positive rate. Here, the graph was drawn for all classes such as good, average and poor.
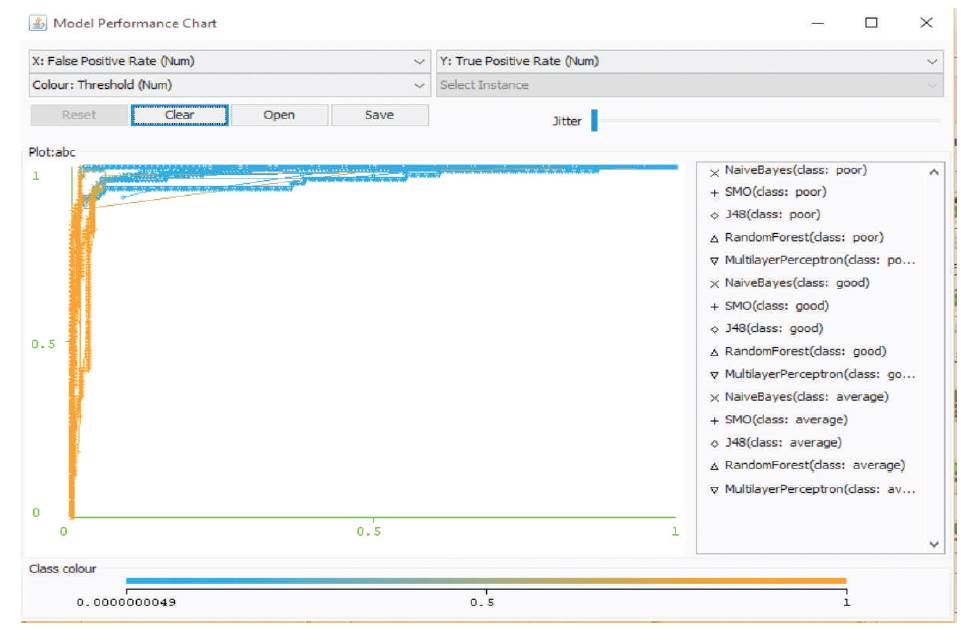
Figure 5. Model Performance Chart between FP Rate and TP Rate
In this paper, several classification algorithms were applied on the dataset of 300 records, which belongs to a higher educational institution. Among those algorithms, Random Forest classification algorithm was best performed. The user interface which takes three records was designed. A module that implements Random Forest classification algorithm which classifies the input record based on the training set was also designed.