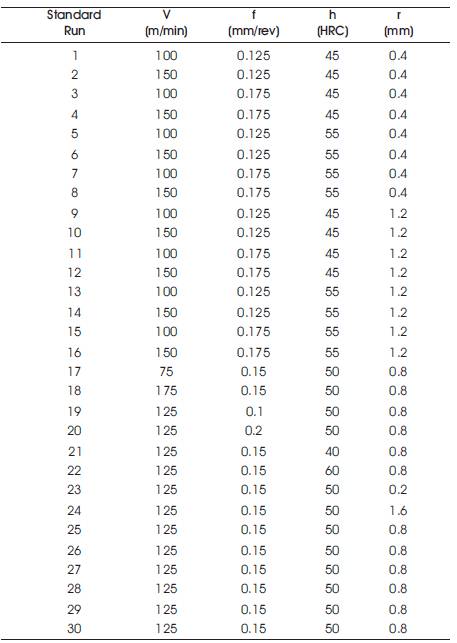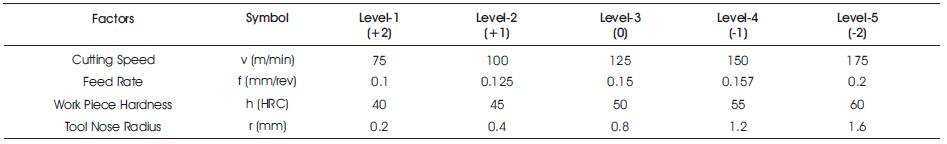
Table 1. Process Variables with Ranges (Kumar et al., 2017)
The selection of process parameters during hard turning is critical deciding the performance of hard turning. In this research work, an attempt has been made to analyze the influence of tool nose radius and workpiece hardness on cutting force and chip-tool interface temperature during hard turning of AISI 4340 steel. The experiments were performed as per layout design with the central composite design. The mathematical models of cutting force and chiptool interface temperature were developed using second order regression analysis. The adequacies of the developed models are analyzed by performing confirmation runs. The significance of the models and influence of the process parameters have been carried out based on Analysis of Variance (ANOVA) technique. The optimal values of the process parameters which provide maximum machining performance are predicted. The results show that workpiece hardness is the significant parameter which affects the performance of hard turning.
Hard turning finds a broad range of applications in manufacturing industries, such as automotive, bearing, tool and die, and aircraft. Superior surface quality along with high dimensional accuracy and high wear resistance are the prime features of hard turning. Traditionally the finishing of hardened steel is usually made by grinding process. With the advent of new superhard cutting tool materials like CBN (Cubic Boron Nitride) and PCBN (Polycrystalline Cubic Boron Nitride), the hard turning has adequately replaced grinding and other finishing operations. There are many advantages of hard turning over grinding. It reduces some needless steps involved with the grinding and hence results in the growth of productivity rate. The hard turning is different from traditional turning regarding the number of process parameters involved. The performance of hard turning is analyzed by surface roughness, cutting force, cutting temperature, and tool wear. The cutting force is the significant parameters to analyze the performance of hard turning. The cutting forces during the machining process affect the power requirement, selection of tool materials, and cutting tool geometry (Mandal et al., 2012). The high cutting forces are generated during the machining of high hardened materials. The high cutting forces lead to earlier tool wear rate as a result, the machining performance is reduced. The performance hard turning depends on number of process parameters, such as cutting parameters, tool geometry, cutting tool materials, workpiece materials, and environmental conditions. The machining performance during hard turning can be enhanced by selecting the appropriate combinations of the process parameters.
Numerous studies have been carried out to analyze the effects of the different combination of the process parameters on hard turning. Liu et al. 2004 reported that with an increase in tool nose radius, the thrust force is increased which causes the residual stresses to be formed in the machined surface during the hard turning of AISI 52100 with CBN tools. Dureja et al. 2009 studied the performance of CBN-TiN tools regarding tool wear and surface roughness during hard turning of hot work die steel. The outcomes indicate that cutting speed and feed rate are the significant parameters which influence the flank wear. Bouacha et al. 2010 investigated that feed rate and cutting speed have maximum effect on surface quality during hard turning. The depth of cut was seen to have maximum influence on cutting forces. Rao and Rao (2012) studied the comparison between central composite and orthogonal array designs for predicting the cutting force and surface roughness during hard turning of AISI 1050 steel with HSS tool. Choudhary and Chauhan (2013) reported the performance of polycrystalline diamond and carbide tools during machining of aluminium 7075 alloys. The results indicate that the long tool life of polycrystalline diamond inserts is at high cutting speed tool when compared to carbide tool. Bouzid et al. (2014) reported the influence of process parameters on surface quality during turning of AISI 420 steel. The results revealed that the feed rate has maximum influence on surface roughness when compared to cutting speed and depth of cut. Tang et al. (2015) studied the effects of workpiecehardness on cutting forces during hard turning of AISI D2 steel with PCBN inserts. The outcomes specify that cutting forces are observed to be higher than radial forces between workpiece hardness 51 to 58 HRC and lesser in the range of hardness 62–65 HRC. Nayak and Sehgal (2015) reported that feed rate has maximum influence on cutting force and surface roughness during hard turning of AISI D-6 steel (54 HRC). Kumar et al. (2017) studied the effects of workpiece hardness on surface roughness, cutting forces, and cutting edge temperature during machining of hardened AISI H13 steel (45-55HRC) with CBN inserts. Kumar and Chauhan (2015) studied the effects of workpiece hardness on surface roughness, cutting forces, and cutting edge temperature during machining of hardened AISI H13 steel (45-55HRC) with CBN inserts. Kalidasan et al (2016) reported the study of two single point cutting tools during machining of grey cast iron. The results show that cutting temperature was unaffected by the distance between front and rear tools. Whereas the rear cutting tool experiences smaller force compared to the front tool, which may be due to reduced friction. Salimiasl and Özdemir (2016) formulated the neural network model of cutting forces using cutting speeds, feed rates, and cutting depths process parameters during machining of AISI 4140steel. Das et al. (2016) studied the effect of cutting parameters (cutting speed, feed rate, depth of cut) on cutting force and surface roughness during hard turning of AISI 52100 steel using CBN tool. The results indicate that feed and cutting speed have maximum influence on surface roughness, whereas the depth of cut on cutting force followed by feed. Sharma and Sehgal (2016) formulated the mathematical models of cutting force, surface roughness, and stress using RSM (Response Surface Methodology) during hard turning with CBN inserts. The results indicate that primary cutting force is highly influenced by cutting speed and depth of cut. Suresh et al. (2017) optimized the cutting parameters using Taguchi approach during turning of EN-19 steel with tungsten carbide inserts. Zhao et al. (2017) investigated the effect of edge radius on surface roughness and flank wear during hard turning of AISI 52100 steel with CBN inserts. This study showed that tool edge radius has maximum effects on surface quality and flank wear.
Although, optimization study and predictive models were available in hard turning of steel alloys using CBN cutting tools. However, the workpiece hardness, tool nose radius, and cutting tool materials are the relevant parameters during hard turning, and very few studies are available with this combination of process parameters. Hence, in the present work, the effect of tool nose radius and workpiece hardness on cutting forces and chip-tool interface temperature is investigated during hard turning of AISI 4340 steel. Further, analysis of variances for cutting force and chip-tool interface temperature is carried out to analyze the significance of the process parameters. The optimal values of the process parameters which provide low values of cutting force and chip-tool interface temperature are recommended.
AISI 4340 steel is chosen as workpiece material for experimentations. It is being used in manufacturing industries where high tensile and yield strength are required. Components made of AISI 4340 steel are widely used in aircrafts, automotives, and general engineering industries, e.g., rotor shaft, propeller shafts, connecting rods, gear shafts) and other automobile parts. 65 mm diameter and 350 mm length of workpiece material was taken during the experimentations to keep L/D (length to diameter) ratio not more than 10 as per ISO 3685 standards (1993) (Standard, I.S.O. 1993). The percentage of alloying elements in AISI 4340 steel are 0.42% C; 0.58% Mn; 0.27% Si; 0.024% S; 0.026% P; 1.06% Cr; 1.47% Ni; 0.22% Mo; and the rest is Fe. AISI 4340 steel is heat-treated by using standard procedure to get the hardness of 40±2, 45±2, 50±2, 55±2, and 60±2 HRC. The cutting inserts of grade K5625 with ISO geometry SNGA 431S0425MT of Kennametal were selected during the experimentations. The inserts were mounted on tool-holder designation ISO MSSNR2525M12 Kumar et al., 2017.
Table 1. Process Variables with Ranges (Kumar et al., 2017)
The Central Composite Design (CCD) from Response Surface Methodology (RSM) was used to design the experimental layout Montgomery, 2017. A total of 30 experiments were carried out as per CCD as shown in Table 2. The depth of cut is a less significant parameter, was kept constant at 0.2 mm.
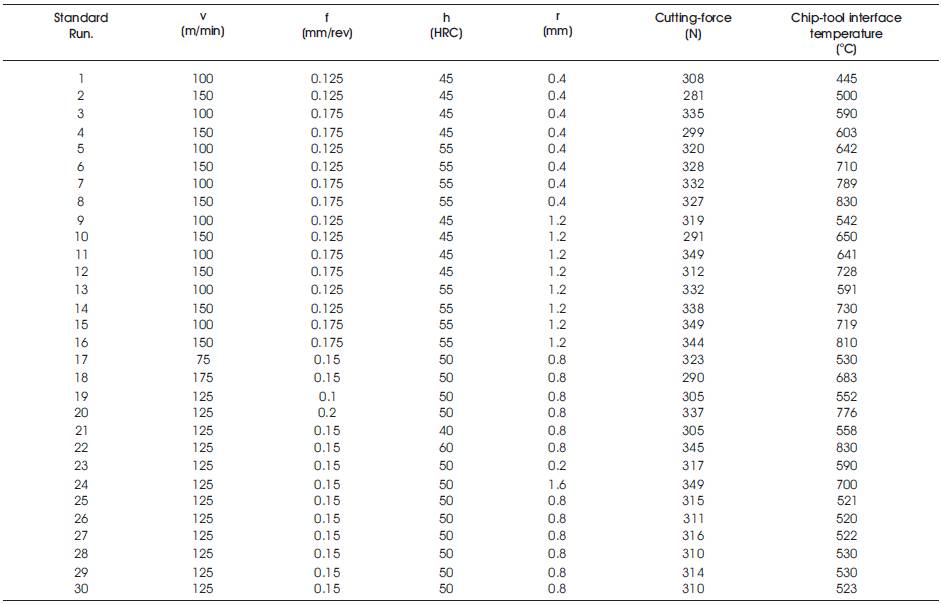
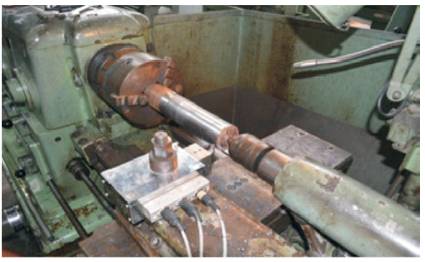
Table 3. Experimental Results with Dry Condition of Machining Figure1. Experimental Setup (Kumar et al., 2017) i-
The ANOVA is helping to analyze the significance of the process parameters. In the ANOVA, the model is formulated using process parameters (cutting speed, feed rate, nose radius, and workpiece hardness) as input and performance parameters as output (cutting force and chip-tool interface temperature). The first order model was not suitable and therefore, the second order model was developed. Some non-significant terms in the models were removed by using backward elimination process. The results of the ANOVA for cutting force and chip-tool interface temperature for the reduced quadratic model are shown in Tables 4 and 5, respectively.

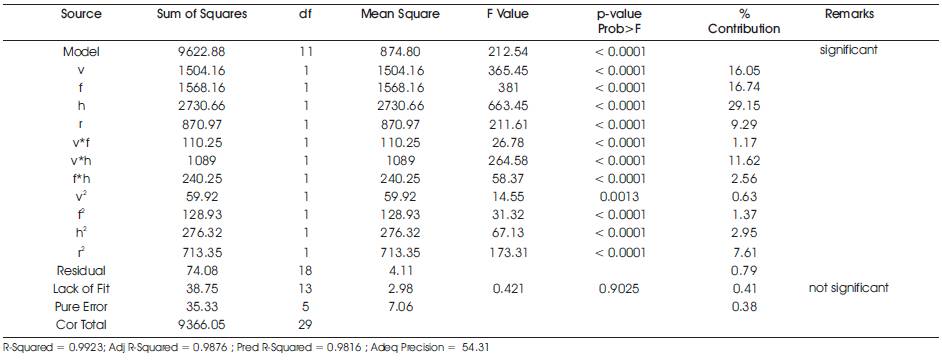 Table 4. ANOVA for Response Surface Reduced Quadratic Model for Cutting Force
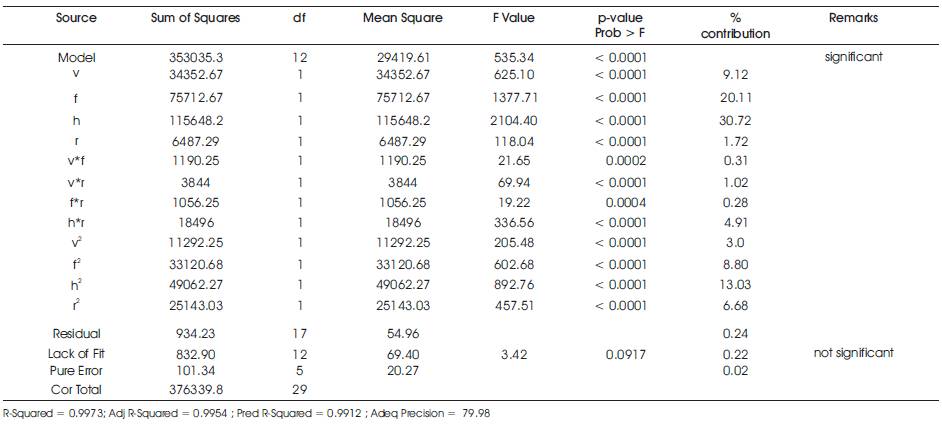
Table 5. ANOVA for Response Surface Reduced Quadratic Model for Chip-Tool Interface Temperature
The ANOVA tables indicate the percentage contributions of each parameter and their interactions. The F-values of the models in Tables 4 and 5 are 212.54 (p-value < 0.0001) and 535.34 (p- value < 0.0001), respectively, which represented that both these models are significant. Residual error represents the inconsistencies between calculated and predicted values. In both the models, the contribution of the residual is 0.79% and 0.24%, respectively, which is very less and is acceptable. The residual error in the regression model is the sum of lack of fit and pure error. The RSM model shows a lack of fit, only when it failed to depict the correlation between experimental and the response variable. The Fvalues of lack of fit in Tables 4 and 5 are 0.421 and 3.42, respectively and are non-significant. Non-significant lack of fit is good for a model to fit.
The R-squared represents the percent of variance explained by the model. The R-squared value is 0.9923 in Table 4 which indicates that the model describes 99.23% of the total variation in the data. The R-squared value in Table 5 is 0.9973, which shows that the model describes 99.73% of the total variation in the data. Therefore, the modes are acceptable. The Adeq Precision measures the signal to noise ratio. A ratio higher than 4 is desirable. In Tables 4 and 5, the values of Adeq Precision are 54.31 and 79.98, respectively, which indicates an adequate signal. Therefore both the models can be used to navigate the design space.
The experimental results are used to formulate the mathematical models. The developed models showed the relationship between response input and output variables. The second order mathematical models for cutting force and chip-tool interface temperature are represented by equations (1) and (2) which are as follows:
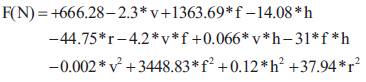
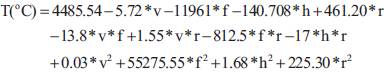
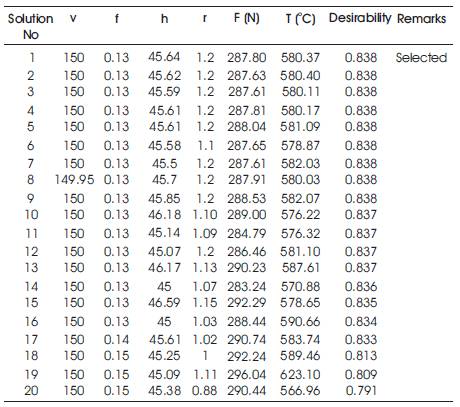
To confirm the adequacies of the developed models, fiveconfirmation experiments were performed. The results of confirmation runs are depicted in Table 6. The predicted value of cutting force and chip-tool interface temperature was calculated from equations (1) and (2). It is observed from Table 6 that the experimental values are very-close to the predicted values. Therefore the formulated models are highly precise to derive the results at various values of input parameters.
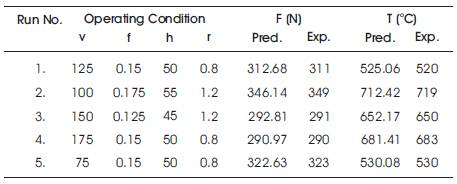
Table 6. Confirmation Experiments
The mathematical models as represented by equations (1) and (2), are used to estimate the functional relation between process and performance variables. The variation of response variables with different values of independent variables are as follows.
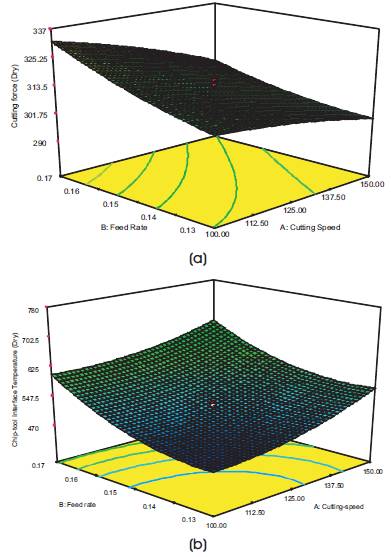
The effect of tool nose radius on cutting force and chip-tool interface temperature at variable cutting speed, feed rate, and workpiece hardness is represented in Figure 2.
Figure 2. Variation of Cutting Force (F) and Chip-tool Interface Temperature (T) at Different Nose Radius
It has been observed from Figures 2 (a-b) that with an increase in cutting speed the cutting force is decreased and the chip-tool interface temperature is increased. For tool nose radius of 1.2 mm, the cutting force is reduced, whereas for nose radius of 0.4, 0.8, and 1.6 mm, the cutting force is decreased to a certain level of cutting speed and then it starts increasing. The reason might be that for small tool nose radius, small contact area is available for cutting tool to conduct the heat. It leads to increase in temperature along the cutting edge, which causes earlier tool wear rate, as a result cutting force is also increased. The cutting force is also increased for tool nose radius of 1.6 mm after 125 m/min. The reason might be that a large nose radius contributes to a reduction in damping, which leads to increase in ploughing effect in the cutting area. The increase in ploughing effect leads to excess material flow by the side of the machined surface. It causes the growth in flank wear, which increases by cutting force Thamma, 2008. The low value of cutting force and chiptool interface temperature was seen at tool nose radius of 1.2 mm.
Figures 2 (c-d) represent the variation of cutting force and chip tool interface temperature with feed rate, respectively. The plots indicate that cutting force and chip-tool interface temperature increased with increase in feed rate. The reason might be that at a low feed rate, the small contact area between tool and workpiece is available. It offers low resistance to the cutting tool in the direction of feed rate and causes low cutting force Toh, 2004. Whereas with an increase in feed rate, the area of contact between tool and workpiece is increased, which causes increase in the extra energy required per revolution with an increase in feed rate which is increased by cutting force. Also, with an increase in feed rate, the friction between work material and flank of the tool is increased, which causes the increase in temperature. The low value of rising in cutting force and chip-tool interface temperature was seen with tool nose radius 1.2 mm.
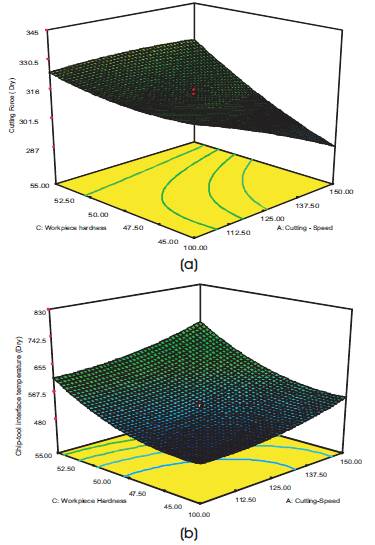
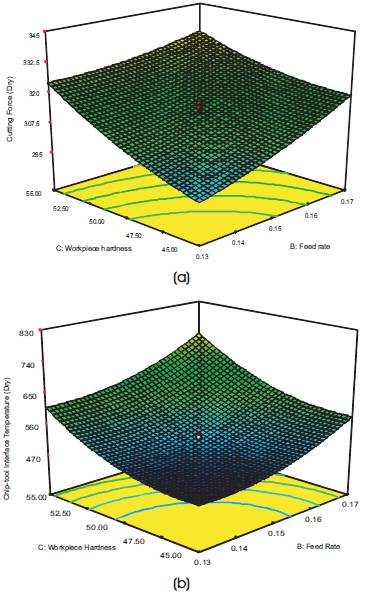
Figure 2 (e-f) shows the change of cutting force and chip tool interface temperature with workpiece hardness, respectively at different tool nose radius. The plots indicate that with an increase in workpiece hardness, the cutting force and chiptool interface temperature are increased. The reason might be that during hard turning, the high frictional heat is generated, which caused the increase in the temperature of the cutting zone. The high temperature causes the thermal softening of cutting area (between tool-workpiece interfaces) that made the plastic deformation of chips easier. However, the hard martensite particle of the upper layers of the workpiece materials affect the flank surface cutting tools Tamizharasan et al., 2006. This leads to an increase in cutting force and chip-tool interface temperature.
The effect of workpiece hardness on cutting force and chip-tool interface temperature at variable cutting speed, feed rate, and tool nose radius is represented in Figures 3 (a-f). Figures 3 (a-b) indicate the variation of cutting force and chip-tool interface temperature with cutting speed at variable workpiece hardness. It has been observed that with an increase in cutting speed at different values of workpiece hardness the cutting force is decreased up to 150 m/min and after that it again increases. The reason might be that, with an increase in workpiece hardness the high frictional heat is generated at the cutting zone, which caused increase in the temperature of the cutting zone. The high temperature causes the thermal softening of the cutting area, which results in the decrease in cutting force. Whereas after 150 m/min, the cutting force is increased, this is because the hard martensite particle on the upper layers of the workpiece materials affects the flank surface cutting tools. It increases by cutting forces with an increase in cutting temperature Tamizharasan et al., 2006 . The chip-tool interface temperature is increased with increase in cutting speed.