Table 1. Mix Proportions of Ordinary Quaternary Blended Concrete
Use of Self-compacting concrete (SCC) in construction industry makes heavily congested reinforced area easier by avoiding vibration and reduces the time of construction, labor requirement and equipment on construction sites, noise reduction due to vibration, and better surface finishing. However, use of SCC is limited because it requires more binder content, chemical admixtures as cost is higher as compared to conventional concrete. SCC can be cost effective and eco-friendly by addition of mineral admixture as a partial replacement to cement and is the way to reduce the binder content. However, the durability of such SCC needs to be proven. In the present investigation, effect of freezing and thawing on quaternary blended SCC were found for different water binder ratio and compared with control self compacting concrete. The result shows that the effect of freezing and thawing was reduced on quaternary blended self compacting concrete with control self compacting concrete.
The most used material around the world in construction industry is concrete. Due to this, environmental impacts like, CO2 emission in cement manufacture and noise pollution occurs due to vibration while placing. CO2 emission can be minimized by reduction of cement content in concrete and vibration can be avoided by Self compacting concrete. To reduce the cement content in concrete is by incorporating mineral admixtures like Fly ash, GGBS, Ricehusk ash, Microsilica, etc. This type of concrete is known as blended concretes. In the present investigation, three mineral admixtures are incorporated and it is called as Quaternary Blended Self Compacted Concrete (QBSCC).
In the present study, dynamic properties of Quaternary Blended Self Compacting Concrete (QBSCC) have been evaluated through an experimental investigation to study the effect of rapid freeze and thaw cycles on the durability of QBSCC.
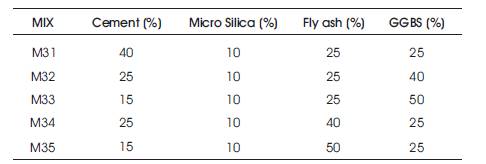
To study the Quaternary Blended Self Compacting Concrete, the optimized mix of mineral admixtures based on results of strength and durability (chemical attack) properties of Quaternary Blended Self Compacting Concrete using various percentages are replaced to cement of mineral admixtures. For this purpose 5 Quaternary Blended Self Compacting Concrete mix proportions were studied, M31 mix was the comparable to control concrete (i.e. 100 % cement). Table 1 shows the replacement of cement of Quaternary Blended Self Compacting Concrete mixes.
The combination of Micro Silica, GGBS and Fly ash is complimentary. Previous studies of various authors show that the Micro Silica improves the early age performance of concrete; GGBS reduces permeability and the Fly ash continuously refining the properties of hardened concrete as it matures [3-12].
Table 1. Mix Proportions of Ordinary Quaternary Blended Concrete
The present investigation is to study of freezing and thawing effect on Quaternary Blended Concrete and compare it with conventional SCC. This was planned to be carried out through an experimental program on concrete specimens of sizes 100 mm x 100 mm x 100 mm cubes. The materials that are used in this study are Cement, Fine Aggregate, Coarse Aggregate, Water and Fly Ash, Ground Granulated Blast furnace Slag (GGBS), Micro Silica, Super Plasticizer, and Viscosity Modifying Agent. Mix design is done according to Nan Su’s [1] mix design method. The water Binder ratios of 0.40 and 0.30 are adapted and materials required for 1 m3 of concrete for 0.4 & 0.3 w/b ratio for 100% cement -SCC & Quaternary Blended SCC are tabulated in Table 2.
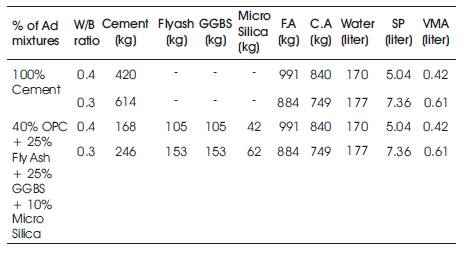
Table 2. Materials required for 1 m3 of Concrete for 0.4 & 0.3 W/B Ratio for 100% Cement -SCC & Quaternary Blended SCC
To find out the effect of freezing and thawing, firstly the specimen is subjected to freeze- thaw cycles as follows:
The testing was done according to ASTM C666 [2]. The standard procedure requires freeze-thaw concrete specimens to be cast and continuously moist-cured for a period of 14 days prior to the placement in the freeze-thaw testing machine. In this investigation, all concrete cube specimens were moist cured for 28 days to avoid young age of the concrete, (i.e) the lack of drying period.
After the curing process, the specimens were stored in a relatively constant temperature and humidity environment for a period of time. Each cycle consisting of 4.5 hours, i.e., 2.5 hours freezing and 2 hours thawing. The compressive strength, Dynamic Modulus of elasticity, and weight loss of the specimens were tested and recorded at each 5 freezethaw cycles. At least three specimens were measured for each testing item. Figure 1 shows the cubes placed in the freezer for freeze – thaw test. Graph 1 represents the variation of temperature with time in a cycle of rapid freeze - thaw cycle.
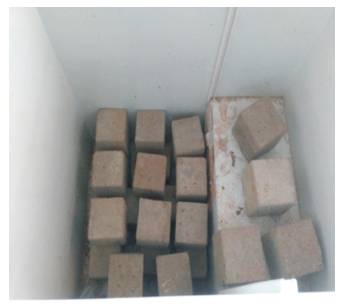
Figure 1. Cubes placed in Freezer for Freeze–Thaw Test
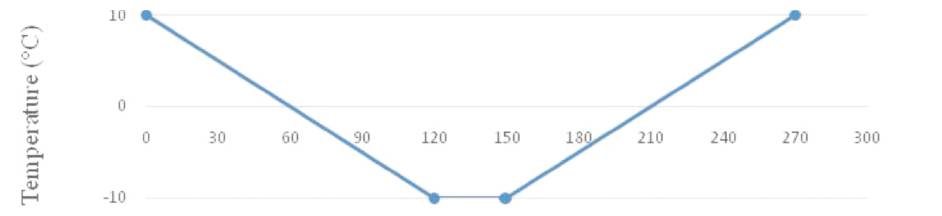
Graph 1. Variation of Temperature with Time in a Cycle of rapid Freeze - Thaw Cycle
The various tests involved in the freeze – thaw test are briefly described as follows.
For every 5 Freeze-Thaw cycles concrete specimens weight are measured using loading balance with possible accuracy and weight change is calculated. Weight gain is an indicator of concrete micro cracking, since water is drawn into the micro cracks by capillarity during the thaw phase of the freeze-thaw cycle. ASTM C666 does not use weight change as a failure criterion, but observation of weight change was beneficial during freeze-thaw testing. Weight loss was an indication of spilling of concrete off the specimen. Weight gain on the other hand resulted from the ingress of water in the concrete specimen and served as an indicator of impending failure of the concrete specimen.
Non-Destructive test procedure using electronic test system can be used to determine the Dynamic Modulus of elasticity of the concrete. In this method, pulses of compression waves are generated by an electro acoustical-transducer that is held in contact with one surface of the concrete specimen. After traversing through the concrete, the pulses are received and converted into electrical energy by a second transducer located at a distance from the transmitting transducer. Figures 2 and 3 show test setup and testing for pulse velocity respectively. If the Dynamic Modulus of elasticity is to be computed from the pulse velocity, the relationship generally recommended as per Equation (1).
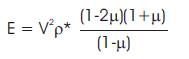
where
E = Dynamic Modulus of elasticity (N/m2 )
V = longitudinal pulse velocity (m/sec)
ρ = mass density (kg/m3)
μ = Poisson's ratio (assumed as 0.20).
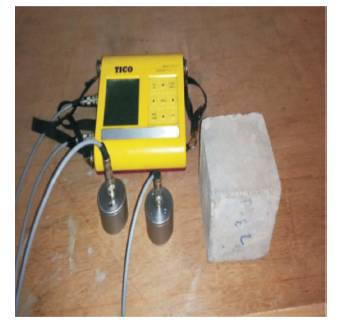
Figure 2. Pulse Velocity Test Setup
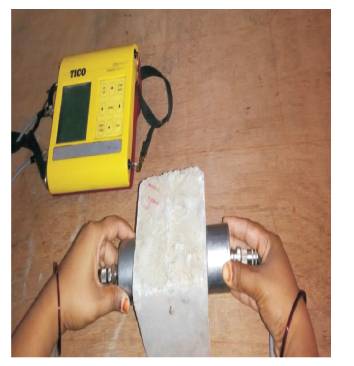
Figure 3. Pulse Velocity Testing on Concrete Sample
The Relative Dynamic Modulus of elasticity is calculated as per equation (2).

where Ec = Dynamic Modulus of elasticity at cycle 'c'
E0 = Dynamic Modulus of elasticity at 0 cycles.
According to ASTM C666, when the test is to be used to make comparisons between the Relative Dynamic Moduli of different concrete specimens, it is adequate to assume that the weight and the dimensions of the specimens remain constant throughout the test.
The freeze thaw durability of different concrete mixes may be compared by way of the Durability Factor, which was calculated in this (as given in ASTM C666) as per equation (3).
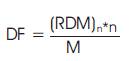
where (RDM)n = Relative Dynamic Modulus of elasticity at n cycles,
n = number of cycles when RDM > 60% or M, whichever is less,
M = specified number of cycles at which testing is to be end
In this study, the test was terminated at 50 cycles before any modulus of elasticity reaches 60% of the original value. Thus the Durability Factor was in fact the Relative Dynamic Modulus of elasticity (n=M=50).
ASTM C666 requires that the testing of each specimen continues, until it has been subjected to 300 freeze-thaw cycles or until it has reached the failure criterion, whichever occurs first.
The test can be terminated if upto 50 cycles or loss of weight is 5%, or Relative dynamic modulus elasticity is <60%
Even at very low RDM values, most specimens remained intact (i.e. little to no concrete spalled off beam) with a small amount of cracking (in most cases) i.e., the only visible sign of deterioration. Table 3 gives the durability scale factor, except for ranking in relative order of frost resistance there are no established criteria for acceptance or rejection of concrete aggregate based on ASTM C666.
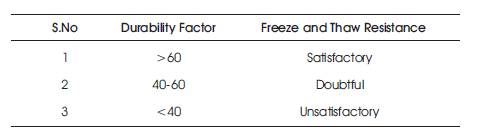
Table 3. Scale of Durability Factor
Table 4 gives the weights and percentage weight loss of specimen with increase in freeze – thaw cycles with respect to zero freeze – thaw cycle. After 50 cycles of freeze-thaw, the percentage of the weight loss is 2.52% and 2.35% for 0.40 and 0.30 W/B ratios, respectively in case of SCC without mineral admixtures, whereas in case of Quaternary Blended Self- Compacting Concrete, it is 2.14% and 1.98% for 0.40 and 0.30 W/B ratios, respectively.
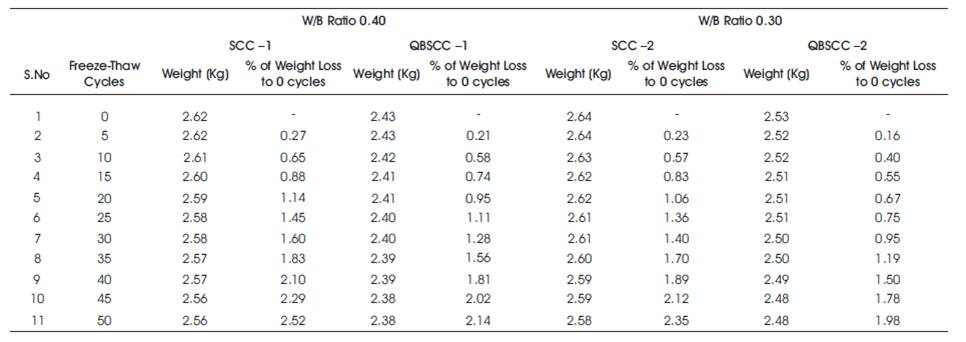
Table 4. Weights and Percentage Weight Loss of SCC and QBSCC Specimens from 0 to 50 Freeze – Thaw cycles
Table 5 gives Pulse Velocity of SCC without mineral admixtures and Quaternary Blended Self – Compacting Concrete from 0 to 50 freeze – thaw cycles. Graph 2 shows that with increase in freeze – thaw cycles pulse velocity decreases gradually.
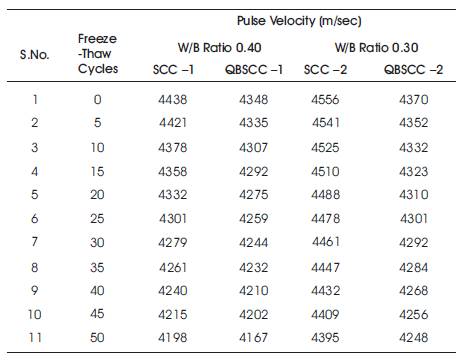
Table 5. Pulse Velocity of SCC and QBSCC from 0 to 50 Freeze – Thaw Cycles
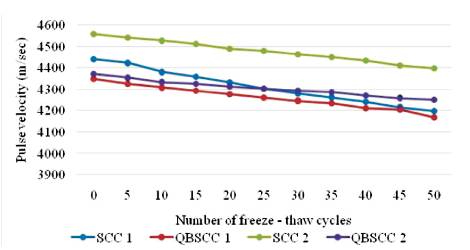
Graph 2. Comparison of Pulse Velocity of SCC and QBSCC
After 50 cycles of freeze-thaw, the percentage loss of the ultrasonic pulse velocity is 7.32%, 3.53% for 0.40 and 0.30 W/B, respectively in case of SCC without mineral admixtures, whereas in case of Quaternary Blended Self – Compacting Concrete, it is 4.16%, 2.79% for 0.40 and 0.30 W/B ratios, respectively.
Table 6 gives dynamic modulus and loss of dynamic modulus of SCC and QBSCC for water binder ratios 0.40 and 0.30. Graph 3 shows that with increase in number of freeze – thaw cycles, the dynamic modulus is decreasing gradually.
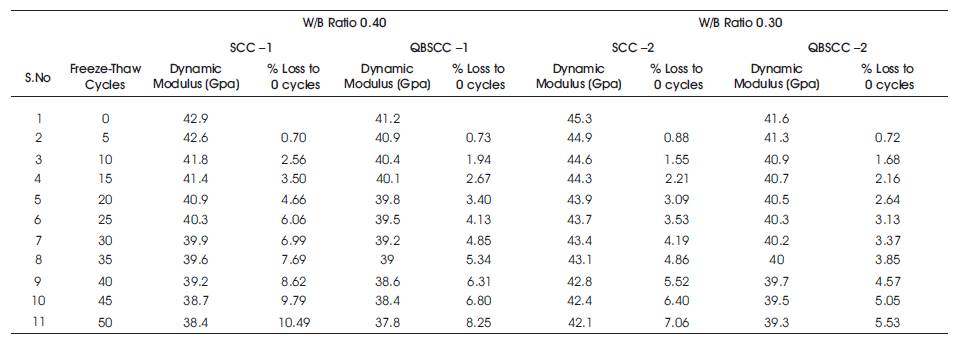
Table 6. Dynamic Modulus of SCC and QBSCC from 0 to 50 Freeze – Thaw Cycles
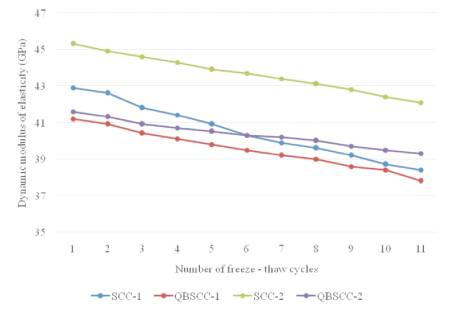
Graph 3. Comparison of Dynamic Modulus of SCC and QBSCC
After 50 cycles of freeze-thaw, the percentage loss of the Dynamic Modulus is 10.49% and 7.06 % for 0.40 and 0.30 W/B ratios, respectively in case of SCC without mineral admixtures, whereas in case of Quaternary Blended Self – Compacting Concrete, it is 8.25% and 5.53% for 0.40 and 0.30 W/B ratios, respectively. The percentage loss of dynamic modulus in Quaternary Blended Self – Compacting Concrete is less compared to SCC without mineral admixtures for both water binder ratios.
Table 7 gives the calculated Durability Factor of SCC without mineral admixtures and Quaternary Blended Self – Compacting Concrete Specimens compared to Zero Freeze-Thaw cycle, respectively for both water binder ratios 0.40 and 0.30.
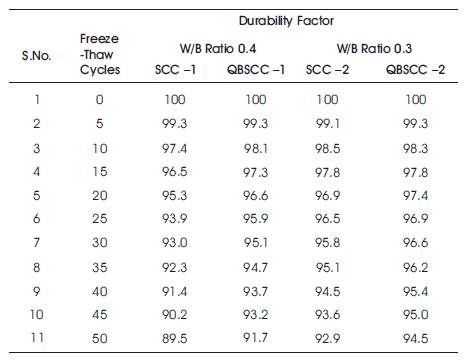
Table 7. Durability Factor of SCC and QBSCC from 0 to 50 Cycles
Graph 4 shows the comparison of durability factor of Self Compacting Concrete without mineral admixtures and Quaternary Blended Self – Compacting Concrete for both water binder ratios 0.40 and 0.30. From the graph it is observed that with increase in number of freeze – thaw cycles, the durability factor goes on decreasing gradually. In this study, Durability Factor and Relative Dynamic Modulus are equal, as total number of Freeze-Thaw cycles conducted is equal to the number of cycles when RDM>60%.
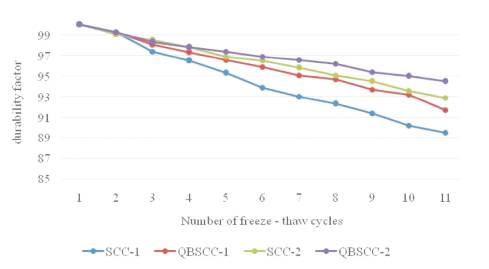
Graph 4. Comparison of Durability Factor of SCC and QBSCC
After 50 cycles of freeze-thaw, the durability factor is reduced to 89.5% and 92.9% for 0.40 and 0.30 W/B ratios, respectively in case of SCC without mineral admixtures, whereas in case of Quaternary Blended Self - Compacting Concrete, it is 91.7% and 94.5% for 0.40 and 0.30 W/B ratios, respectively. As the Durability Factor is greater than 85%, all the Specimens show good freeze-thaw resistance.
Table 8 represents the compressive strength of Self Compacting concrete without mineral admixtures and Quaternary Blended Self – Compacting Concrete specimens from 0 to 50 freeze – thaw cycles. After 50 cycles of freeze-thaw, the percentage of the compressive strength loss is 19.00%, 10.86% for 0.40 and 0.30 W/B ratios, respectively in case of SCC without mineral admixtures, whereas in case of Quaternary Blended Self – Compacting Concrete, it is 12.74% and 8.51% for 0.40 and 0.30 W/B ratios, respectively. Figure 4 shows the testing of concrete cubes for compressive strength.
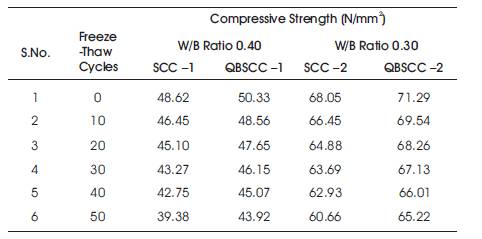
Table 8. Compressive Strength of SCC and QBSCC from 0 to 50 Cycles
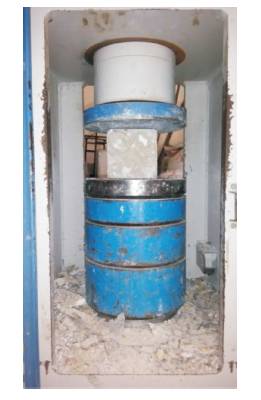
Figure 4. Compressive Strength Testing
The improved performance of Micro Silica concrete could be attributed to the improvement in bond between the hydrated cement matrix and aggregate. This in turn is due to the combined effect of secondary pozzolonic reaction and fineness of Micro Silica particles.
Graph 5 shows that with increase in number of freeze – thaw cycles, the compressive strength of specimen goes on decreasing for all the mixes. It is because the volume of water is more than volume of ice, so during freezing, the water conversion into ice forced to break the bond between the cementitious material and aggregates, which in turn increases more weak spots within the specimen and weight of specimen is also decreased.
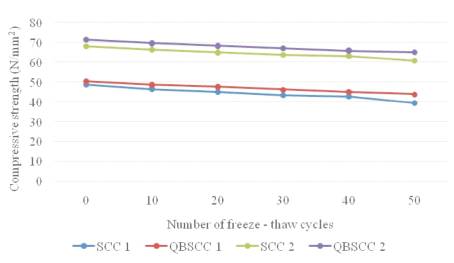
Graph 5. Compressive Strength of SCC and QBSCC from 0 to 50 Freeze – Thaw Cycles
Based on the experimental studies and test results, the following conclusions can be drawn.
Based on the above results it shows that Quaternary Blended Self – Compacting Concrete using Fly ash, GGBS and Micro Silica proved to be cost effective and ecofriendly without compromising strength and durability of concrete.