Table 1. Results of Sieve Analysis
Thickness of the pavement affects the subgrade strength in the design of flexible pavements. California Bearing Ratio (CBR) is one of the methods to determine the subgrade strength. The conventional soaked CBR testing method is expensive, laborious, and time consuming, so, here an attempt was made for correlating CBR values with the index properties of soils like LL, PL, PI, OMC, and MDD. Correlation co- efficient (R2 ) value of index properties with soaked CBR is determined. In this study, thirty (30) number of soil samples (having 44 < ll < 84) were collected from different parts of Sangareddy District (Telangana). Different laboratory tests, including Atterberg limits, Specific Gravity, Gradation Analysis, soaked CBR and compaction were performed on these samples and various linear relationships were established between index properties and soaked CBR of the samples using a statistical software (SPSS). Simple and multiple linear regression analysis was performed and eight (8) predictive equations were developed for estimating the soaked CBR value from the index properties of soil with a maximum R2 value of 0.947.
Soil is a naturally available material having unique properties which varies seasonally. Geotechnical engineers usually attempt to develop empirical equations specific to a certain region and soil type. However, these empirical equations are much preferred for the type of soil where the correlation is origin. Hence, it is important to develop empirical equations to determine the properties of soils available in the local areas, as we know that the most of Indian highways consists of flexible pavements. In the design of flexible pavements, type of subgrade material and sub grade strengthening is the most important thing because the load which was applied on surface layer is finally transferred to sub grade. So in the design of sub grade, CBR value is considered as the strength parameter. California Bearing Ratio (CBR) is one of the most empirical methods in the designing of flexible Pavements. CBR is a penetration test which was done on either field or in the laboratory and was developed in 1928 by California division of highways in USA.
For the small length of proposed roads, soil sampling and laboratory testing may be manageable because here we should collect less number of soil samples whereas in a long length of proposed roads construction, we need to collect large number of soil samples. To perform soaked CBR test, soil samples need to be soaked for about 96 hrs [10] or four days and then testing is performed in the laboratory which was expensive and all this process was taking too much time. Along the length of the proposed road, soil properties varies from one point to another point, so to overcome this situation, we need to collect large amount of soil samples to get accurate results. This may lead to increase the duration, overall cost of project and sometimes the results may be misguided due to unskilled laboratory technicians. So in order to overcome all the above-mentioned difficulties, some investigators have worked in this field.
By using some of the soil properties like MDD, OMC, and INDEX Properties, the CBR values can be determined without conducting CBR test [1]. From correlation analysis, it is observed that, in case of highly compressible clay (CH), large variations will take place between experimental and predicted CBR values [2]. The statistical parameters indicate that better performance can be obtained using Multiple Linear Regression Analysis (MLRA) showing high R values [3]. CBR correlated with liquid limit, plastic limit, fines and specific gravity have given better R2 value [4]. Predicted CBR values of different soils are similar to laboratory CBR values, with the correlation coefficient R2 = 0.836 [5]. Multiple Linear Regression Analysis (MLRA) predicted good empirical relation between CBR, OMC, and MDD compared to Simple Linear Regression Analysis (SLRA) [6]. Soaked CBR value of the soil bears a significant correlation with percent fines, LL, MDD, and OMC with an R2 value of 0.836 [7]. A direct linear relationship exists between unsoaked CBR and the initial state factor (Fi). Similarly the relationship between soaked CBR and the soaking state factor (Fs ) was verified to be linear relationship as well [8]. Regression analysis involving multiple influencing factors yields better correlation equation for coarse grained soils [9].
The main intention of this study is to investigate the feasibility of correlation between the CBR and index properties of soil like LL, PL, PI, OMC, and MDD by doing Simple Linear Regression Analysis (SLRA) as well as Multiple Linear Regression Analysis (MLRA) and to develop equations which can be used for predicting the soaked CBR value.
Thirty (30) number of disturbed soil samples were collected from different parts of Sangareddy district of Telangana, India. Those were tested in VNR VJIET Laboratory, Bachupally, Hyderabad. The collected samples were Black Cotton soils. All samples were collected one meter below the ground by using hand operated sampler.
In this study, the soaked CBR test is performed as per [10]. As per mentioned IS code procedure, heavily compacted soil sample should get immersed (along with weights to produce a surcharge equal to the weight of base material and pavement to the nearest 2.5 kg) in a tank of water allowing free access of water to the top and bottom of the specimen. At the end of soaking period, a mould was taken out of the water and allowed to drain or 15 minutes and then penetration test was conducted.
As per [14], the standard proctor test was conducted to determine the Optimum Moisture Content (OMC) and Maximum Dry density (MDD) of the soils. It's values are shown in Table 3.
Soil Specific Gravity (G) was determined as per guidelines of IS 2720-part 3 [13]. The average value of three samples has been taken as the specific gravity of soil. The specific gravity of fine grained soils are determined by density bottle method and are reported at 27 ºC in 100 m volume.
Grain size distribution was done by using wet sieve analysis and hydrometer analysis as per guidelines of IS2720 part 4.
As per [12], liquid limit test was conducted and it's values are shown in Table 2.
As per [12], plastic limit test was conducted on the soil mixed with distilled water by rolling on a glass plate until it is about 3 mm diameter and it's values are shown in Table 2.
Plastic Index is the difference between the liquid limit and plastic limit.
PI=liquid limit(LL)-plastic limit(PL)
As per [11], the oven dried sample has been made through 75 μm sieve and 50 g of soil was taken for testing procedure.
The regression analysis is done based on the results obtained from each soil. The results of thirty soils are utilized to fit a best curve with the help of regression analysis. Here soaked CBR value will be considered as dependent, whereas LL, PL, PI, OMC, MDD are independent.
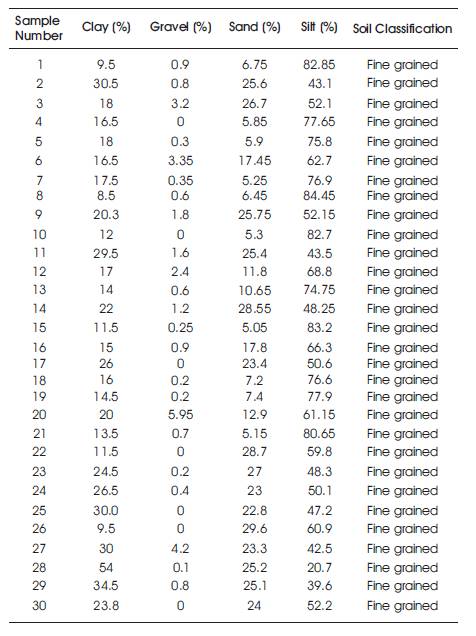
Table 1 gives percentages of Gravel, sand, silt and clay in each soil and also gives soil classification
Table 1. Results of Sieve Analysis
Table 2 gives Atterberg limits and soil classification using A-line chart.
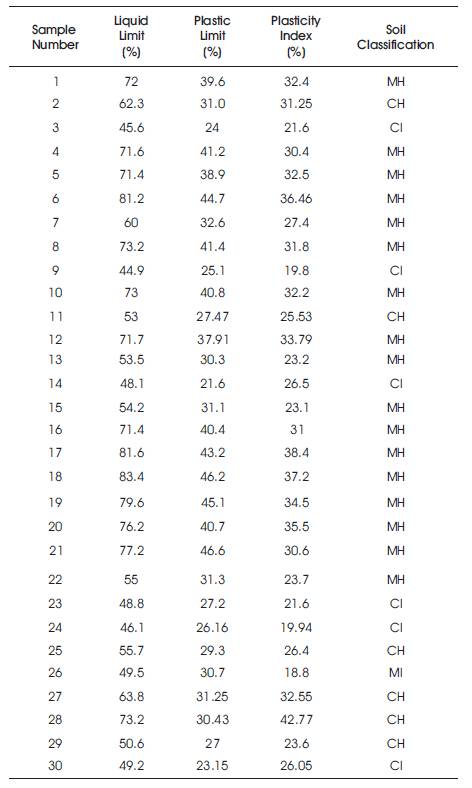
Table 2. Results of Consistency Limits
Table 3 gives Maximum dry density and optimum moisture content of different soil samples.
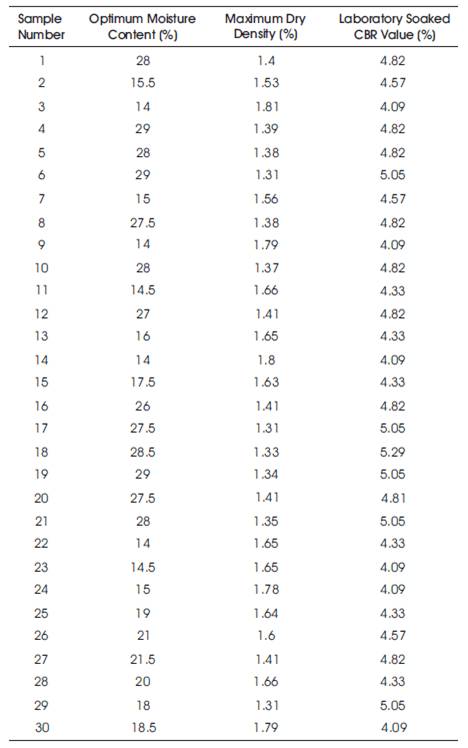
Table 3. Results of Compaction Characteristics
Table 4 gives laboratory soaked CBR values and Predicted CBR values using SPSS.
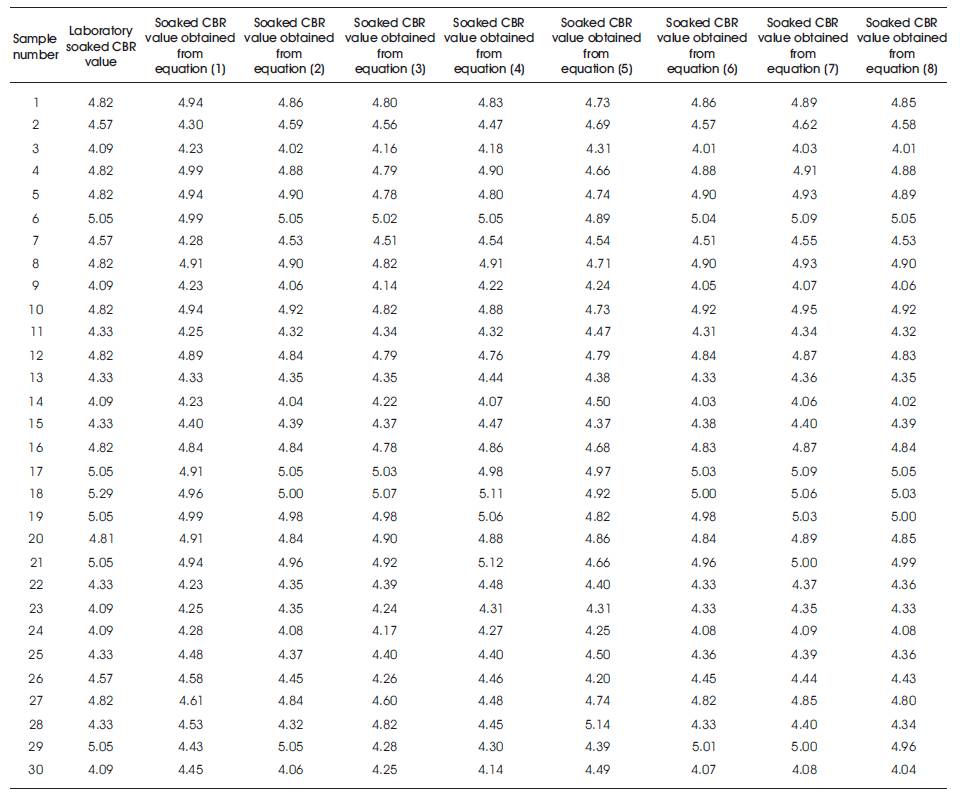
Table 4. Experimental and Predicted CBR Values
Figure 1 shows the effect of moisture content on soaked CBR values using SPSS.
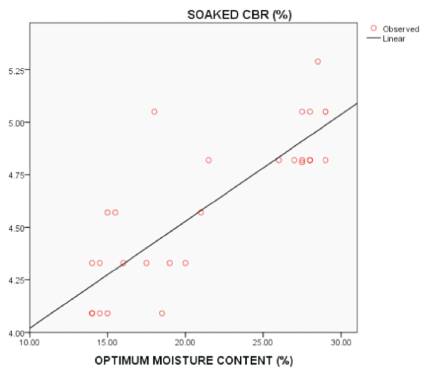
Figure 1. Effect of OMC (%) on Soaked CBR
Figure 2 shows the effect of liquid limit on soaked CBR values SPSS.
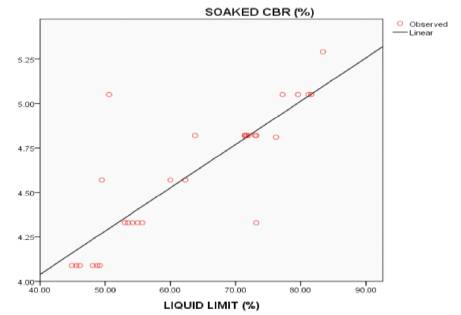
Figure 2. Effect of Liquid Limit (%) on soaked CBR
Figure 3 shows the effect of maximum dry density on soaked CBR values using SPSS.
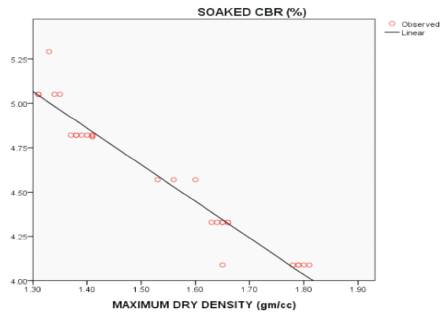
Figure 3. Effect of Maximum Dry Density (%) on soaked CBR
Figure 4 shows the effect of plastic limit on soaked CBR values using SPSS.
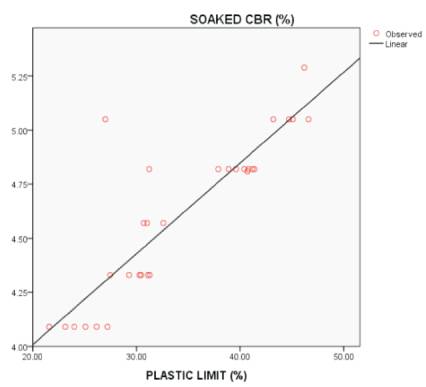
Figure 4. Effect of Plastic Limit (%) on soaked CBR
Figure 5 shows the effect of plasticity index on soaked CBR values using SPSS.
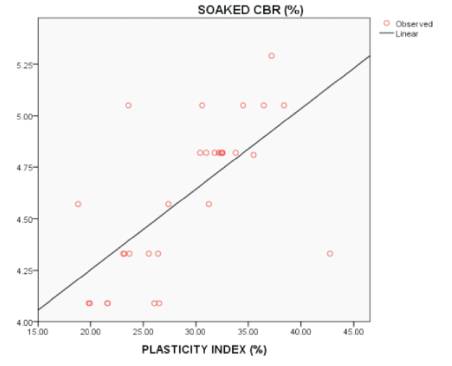
Figure 5. Effect of Plasticity Index (%) on soaked CBR
Graph 1-8 show comparison between Laboratories soaked CBR values and Soaked CBR values of equations (1)-(8), respectively.
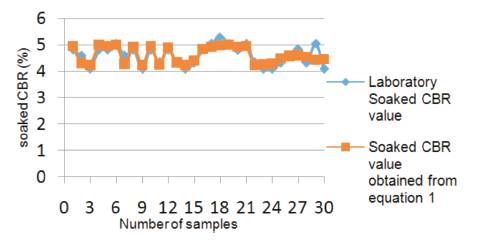
Graph 1. Comparison between experimental soaked CBR and soaked CBR values of equation (1)
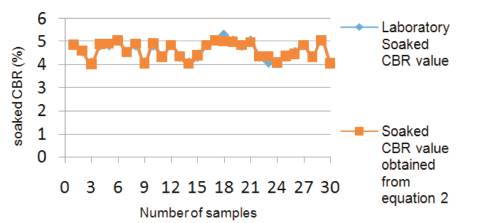
Graph 2. Comparison between experimental soaked CBR and soaked CBR values of equation (2)
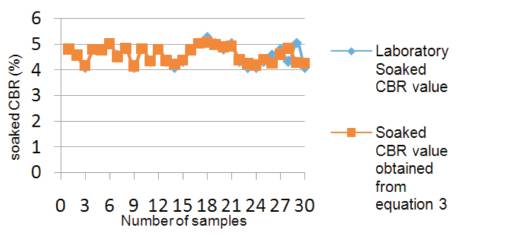
Graph 3. Comparison between experimental soaked CBR and soaked CBR values of equation (3)
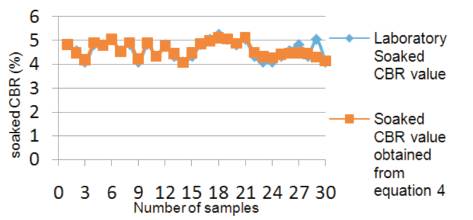
Graph 4. Comparison between experimental soaked CBR and soaked CBR values of equation (4)
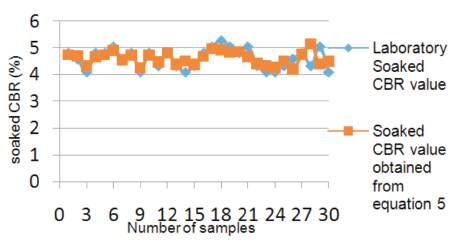
Graph 5. Comparison between experimental soaked CBR and soaked CBR values of equation (5)
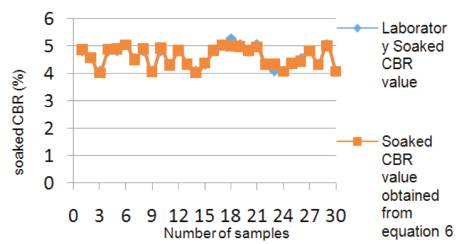
Graph 6. Comparison between experimental soaked CBR and soaked CBR values of equation (6)
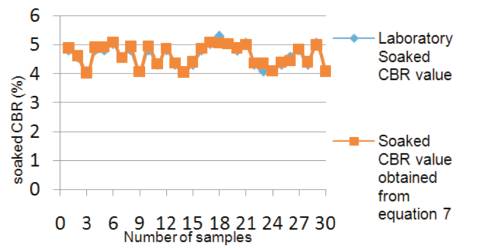
Graph 7. Comparison between experimental soaked CBR and soaked CBR values of equation (7)
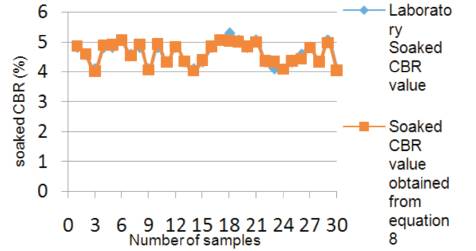
Graph 8. Comparison between experimental soaked CBR and soaked CBR values of equation (8)
It is observed that all the 30 samples were classified as fine grained soils (Table 1), in those fine grained soils, maximum number of soil samples were classified as highly compressible silts [MH], remaining are high and intermediate compressible clayey soils [CH&CI] (Table 2), and from Table 3, it was also observed that all 30 samples optimum moisture content varies as 14 < OMC < 28.5 and their respective maximum dry density varies as 1.31 < MDD < 1.79.
Table 1 shows classification of soil and percentages Gravel, Sand, Silt and Clay. This soil classification and percentages are done by conducting Wet sieve analysis and hydrometer analysis.
Soil compressibility done by using LL, PL, PI, and A-line chart. By using A-line equation, one PI value was calculated. These calculated values are compared with obtained PI (PI=LL-PL). There are 5 conditions to classify the soil.
Based on all these conditions, the soil classification is done.
(1) CBR(soaked) =0.051*OMC+3.511 with an R2 value of 0.703 as shown in Figure 1 & Table 4.
(2) CBR(soaked) = -2.060*MDD+7.744 with an R2 value of 0.943 as shown in Figure 3 & Table 4.
(3) CBR(soaked) = 0.024*LL+3.067 with an R2 value of 0.706 as shown in Figure 2 & Table 4.
(4) CBR(soaked) = 0.042*PL+3.167 with an R2 value of 0.757 as shown in Figure 4 & Table 4.
(5) CBR(soaked) = 0.039*PI+3.471 with an R2 value of 0.431 as shown in Figure 5 & Table 4.
(6) CBR(soaked) = 0.003*OMC-1.961*MDD+7.521 with an R2 value of 0.944 as shown in Table 4.
(7) CBR(soaked) = 0.000*OMC-1.905*MDD+0.003*LL+ 7.344 with an R2 value of 0.946 as shown in Table 4.
(8) CBR(soaked) = -0.002*OMC-1.865*MDD+0.001*LL+0.005*PL +7.251 with an R2 value of 0.947 as shown in Table 4.
By analysing all composed equations, it is clearly observed that equation (8) and graph 8 show more accuracy with the rest of the equations with an R² value of 0.947.
From Figures 1, 2, 4, & 5, the OMC, LL, PL & PI values are directly proportional to soaked CBR value, because the resultant or slope of graph showing increasing of Y-axis ordinates with increase in X-axis ordinates.
From Figure 3, MDD values are indirectly proportional to soaked CBR values, because the resultant or slope of graph showing decreasing of Y-axis ordinates with increase in X-axis co ordinates.
By observing all 5 figures, Points (Red bubbles in Figure 3)) value, and in the graph, maximum number of MDD values are closer and on the resultant line. By observing all 5 figures, in Figures 1, 2, 3, 4 at least 2 or 3 points (Red bubbles) are on resultant line, but in Figure 5 which is drawn in between PI and Soaked CBR values, there is no point (red bubble) on the resultant line, and gives less R2 of 0.431, with this we can say that the PI values does not have effect on soaked CBR value.
By observing all the above five figures, the authors conclude that maximum dry density shows more effect on soaked CBR values of soils compared to other four parameters (Liquid limit, Plastic limit, Plasticity index, Optimum moisture content).
The below graphs 1,2,3,4,5,6,7 & 8 show the comparison of soaked CBR values of the laboratory CBR test with the obtained CBR values of equations from the statistical software (SPSS).
Step 1: Inputting the laboratory data into SPSS software.
Step 2: Correlation analysis (3 sub steps are also present).
2.1: Final output of correlation table.
Step 3: Regression analysis
3.1: Output of regression analysis.
Step 4 (a): Cross checking of regression analysis by forward method.
Step 4(b): Cross checking of regression analysis by backward method.
In this study, 30 number of soil samples were tested for soaked CBR value and equations were developed using IBM SPSS STASTASTICS 21 software. From the obtained results, it is concluded that,
The author expressed gratitude towards his internal guide and co-author Dr. B. Naga Malleswara Rao, Professor, CE, VNR Vignana Jyothi Institute of Engineering and Technology for the encouragement and guidance provided. He would like to thank Dr. A. Ramesh, Associate Professor, CE, VNR VJIET who helped them a lot in guiding the SPSS software. Also, the author would like to thank Head of the Department of VNR VJIET and all the faculty members of Geotechnical Department for their valuable support.