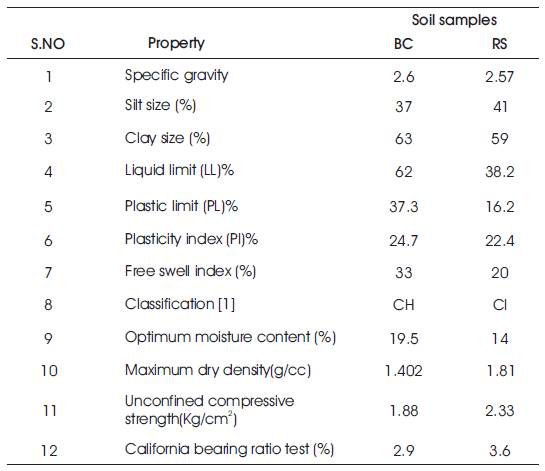
Table 1. Properties of BC and Red Soil
In general, the clayey soils reduces the enactment and lifetime of Civil Engineering structures, causing problems due to their low load carrying capacity. The Rapid growth of industries produces hazardous waste materials which act as a pollutant that affect the ecological system of the environment. Several researchers have used many additives to stabilize the soil as economical. Here, the stone dust has been used in the present study which possesses high calcium content. In this research, the effect of various sizes (5mm, 3mm, <75μ) of Stone dust with different proportions (5%, 7.5%, 10%, 12.5% and 15%) for untreated and treated soils were studied using direct shear, permeability, UCS (qu) and CBR tests. Also the modulus of elasticity of various soil mixes for sub-grade and sub-base have been determined. From the test results it has been concluded that the strength of the soil has been improved and there is a decrease in the permeability with the increase in the addition of stone dust.
In India expansive soil covers most of the area which consists of minerals such as smectite clays. These soils absorb water which significantly increases the volume of soil which undergoes swelling characteristics and these soils shrink when they dry out. These types of soils swell and shrink, because of the change in moisture content. This produces stresses on structures due to their repetitive swelling and shrinkage cyclic processes. So it is challenging task for civil engineers to build up any structures on these types of soils. As transportation plays an important role for proper functioning and economic activities in every country, design of pavement mainly depends on the sub grade soil, which is made up of locally available natural soils. The soil can be replaced or can be stabilized with some additives to improve the strength of sub grade and also improves the load bearing capacity of pavements and its performance. In the present study, stabilization of clayey soil is done with different sizes of stone dust (5mm, 3mm, <75μ) which a waste material from quarry and marble industries which improves the strength of sub-base and sub-grade. As disposal of waste in developed countries is not adequate, this waste causes problems not only to the humans but also to the environment. The Stone dust possesses pozzolanic reactions and exhibits high shear strength which can be used as geo technical material. Various investigations have been done by using stone dust which shows that the liquid limit and plastic limit got decreased with the increase in the percentage of quarry Dust as mentioned in[20]. From literatures[16, 17 and 19] it have been concluded that the MDD got increased and OMC got decreased with the increase in the percentage of stone dust. The unconfined compressive strength and California bearing ratio values have been increased with the addition of stone dust and fibres as mentioned in [15]. The literature[12] shows that the permeability decreases with the increase in the percentage of lime and stone dust. Based on[14] the increase in the percentages of quarry dust decreases the value of cohesion.
The aim of the study is to find out the strength characteristics and modulus of elasticity of sub-grade and sub-base of soils with the addition of various sizes of stone dust.
The BC soil which is used in the research has been brought from Medchal village, Ranga Reddy District of Telangana state, India. The soil was extracted from 30cm below the ground level.
The Red soil used in the study was brought from Bahadurpally village, Ranga Reddy District of Telangana state, India. The soil was extracted from 30cm below the ground level. Table 1 shows the properties of BC and Red Soil.
Table 1. Properties of BC and Red Soil
The stone dust in various sizes (5mm, 3mm and <75μ) were obtained from Bethamcherla, Kurnool District of Andhra pradesh. The properties of stone dust have been tested in laboratory. Table 2 shows the properties of stone dust.
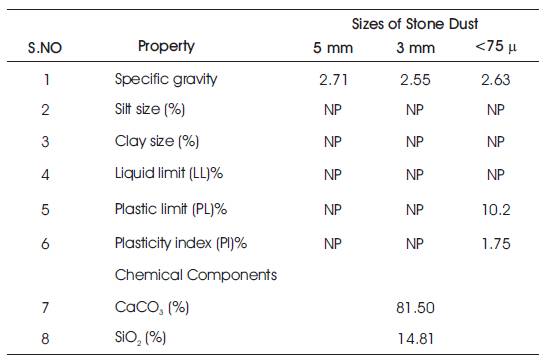
Table 2. Properties of Stone Dust
In order to determine the variations in behaviour and strength characteristics of BC and Red soil, the stone dust of various sizes (5mm, 3mm and <75m) were mixed with soil to obtain a design mix. Later on Index properties such as Atterberg limits, specific gravity, sieve analysis and engineering properties such as standard proctor test, direct shear test, unconfined compressive strength, California bearing ratio test and permeability test were performed on these design mix according to relevant IS codes.
Liquid limit test was conducted using casagrande's liquid limit apparatus and Plastic limit test was determined using rolling thread method as[2]. The gradation of the soil was dogged by piloting sieve analysis as per the guidelines given in[4].
Specific gravity test has been determined according to[3] using density bottle for stone dust of size (<75μ) and pycnometer method has been used for stone dust of sizes (3mm and 5mm) (Figure 1).
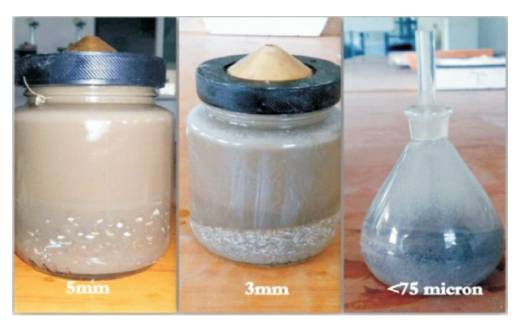
Figure 1. Determination of Specific Gravity Using Pycnometer and Density Bottle Method for Various Sizes of Stone Dust
The maximum dry density and optimum moisture content was determined by mixing the soil sample with stone dust of different sizes. The soil-stone dust mixes were compacted in three equal layers from a hammer of 2.5 kg falling through a height of 310mm by receiving 25 blows for each layer as per[5].
The cohesion and angle of internal friction values have been determined using direct shear test with various sizes (5mm, 3mm and <75μ) of stone dust according to[6] (Figure 2).
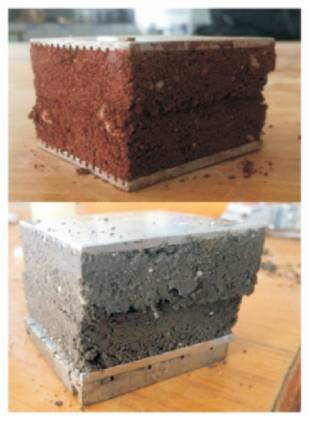
Figure 2. Soil Specimens After Performing of Direct Shear Test
The soil sample and the stone dust were mixed together to obtain a design mix. All the samples are prepared by compacting the consequent mixture in compacted mould at required optimum moisture content. Later, the specimens were made for dimensions (38mm diameter and 76mm length) after extracting the samples from the mould. For each size of stone dust 5 set of specimens with different percentages (5%, 7.5%, 10%, 12.5% and 15%) of stone dust have been equipped.
The unconfined compressive strength was conducted for soil-stone dust mixes as per[7] under constant strain rate of 1.5 mm/min by setting the proving ring and dial gauge ring readings to zero. Later, the proving ring readings at regular intervals of dial gauge can be noted. The loadings were continued until there is a decrement of 2 or more readings. (Figures 3 and 4).
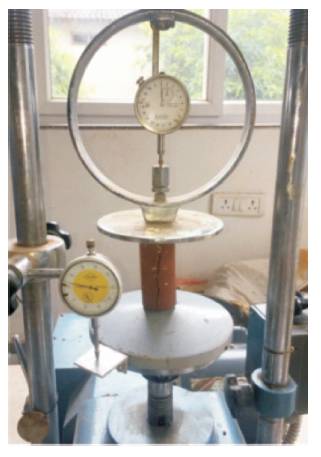
Figure 3. UCS Specimen Under Testing
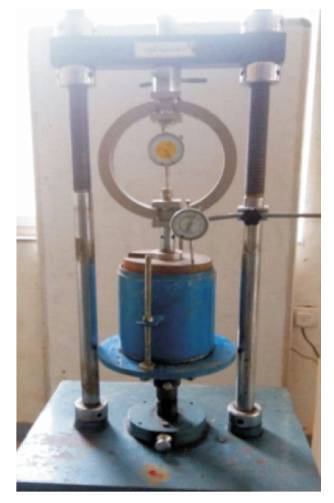
Figure 4. CBR specimen under testing
The soil has been compacted in 5 layers, each layer given 56 blows by a hammer of 4.5kg with a falling height of 450mm. Later, the excess soil is trimmed off and the displacer disc has been removed. The surcharge loads of 5kg are kept on soil mould. For soaked CBR the samples were immersed in water for 4 days after addition of surcharge loads by placing the filter paper and porous plate below the surcharge loads and then the samples can be carried out for testing.
The California bearing ratio test was conducted on soilstone dust mixes under constant strain rate of 1.25 mm/min by setting the proving ring and dial gauge readings to zero. Later, the CBR test had been performed according to [8].
The variable head permeability tests were conducted by varying the sizes (5mm, 3mm, <75μ) of stone dust with different percentages (5%, 7.5%, 10%, 12.5% and 15%) as per[9]. (Figure 5).
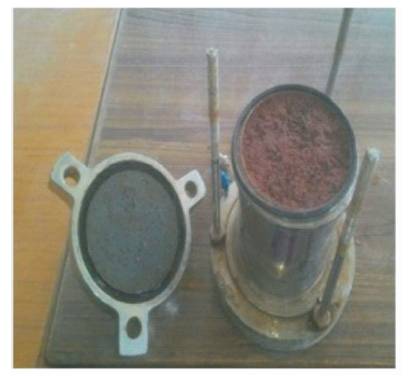
Figure 5. Preparation of specimen for conducting variable permeability test
The Atterberg limits (LL, PL and PI) have been determined for black cotton and red soil separately when treated with stone dust of size <75μ. The liquid limit and plastic limit was found to be decreased with the increase in the percentages of stone dust (<75μ) and with the decrease in the liquid and plastic limits, corresponding plasticity index was also found to be decreased with the increase in the percentages of stone dust (<75μ).
The variations in LL, PL and PI with the addition of various sizes of stone dust are as shown in Figure 6.
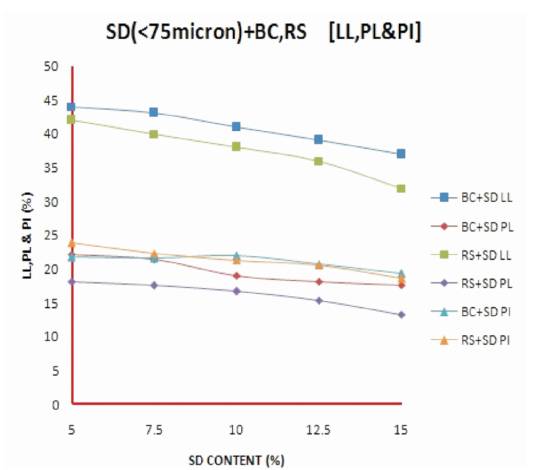
Figure 6. Variation of LL,PL and PI of BC and Red soil with different percentages of stone dust
The specific gravity of the BC and Red soil when treated with various sizes (5mm, 3mm and <75μ) of stone dust separately with increase in percentages (5%, 7.5%, 10%,12.5% and 15%) of stone dust, increased.
Variation of specific gravity for black cotton soil treated with various sizes of stone dust is shown in Figure 7.
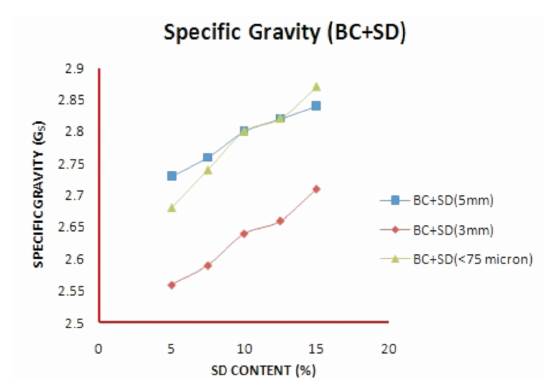
Figure 7. Variation of specific gravity for black cotton soil treated with various sizes of stone dust
Variation of specific gravity for red soil treated with various sizes of stone dust is shown in Figure 8.
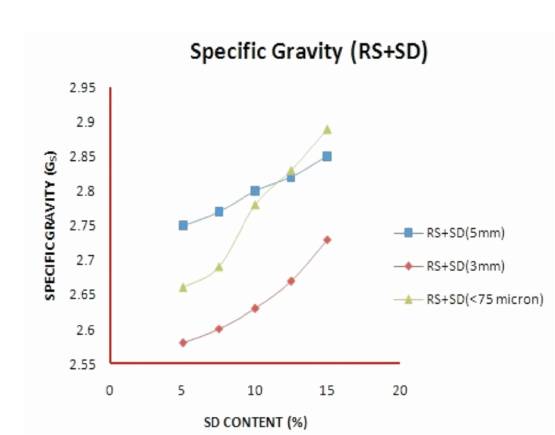
Figure 8. Variation of specific gravity for red soil treated with various sizes of stone dust
The maximum dry density increases and the optimum moisture content decreases with increase in the various percentages (5%, 7.5%, 10%,12.5% and 15%) of stone dust for 5mm and 3mm, Coming to <75μ the optimum moisture content was going to be increased with increase in the percentages of stone dust.
The variation in OMC for Black cotton soil is shown in Figure 9.
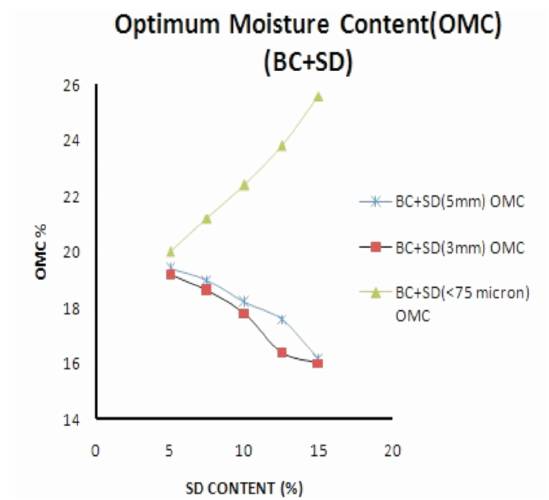
Figure 9. Variation of OMC for black cotton soil stabilized with various sizes of stone dust
The variation in MDD for Black cotton soil is shown in Figure 10.

Figure 10. Variation of MDD for Black Cotton Soil Stabilized with Various Sizes of Stone Dust
The variation in OMC for Red soil is shown in Figure 11.
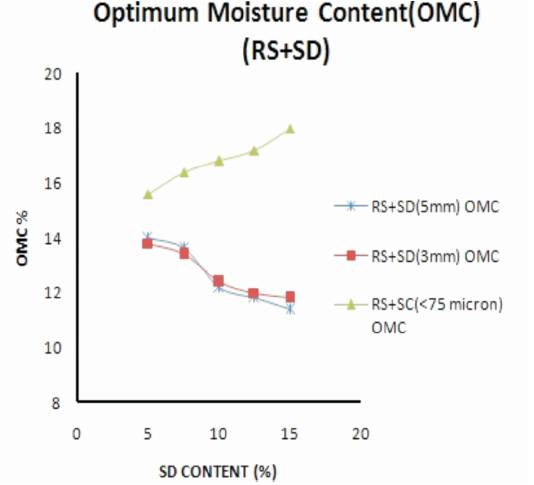
Figure 11. Variation of OMC for Red soil stabilized with various sizes of stone dust
The variation in MDD for Red soil is shown in Figure 12.
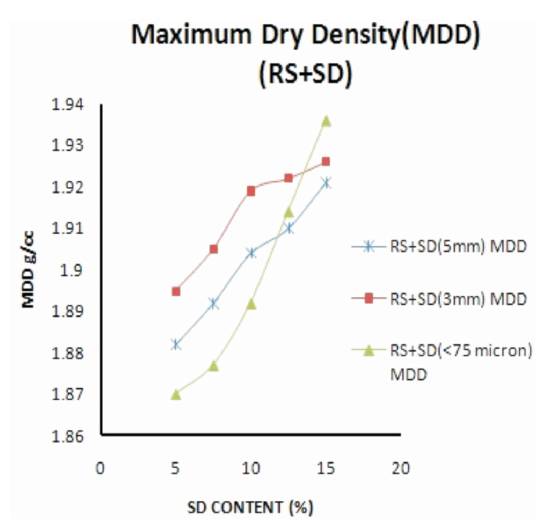
Figure 12. Variation of MDD for Red Soil Stabilized with Various Sizes of Stone Dust.
The cohesion of the soil decreases with the increase in various sizes (5mm, 3mm and <75μ) of stone dust. With different percentages (5%, 7.5%, 10%, 12.5% and 15%), the angle of internal friction goes on increasing with the increase in the percentage of stone dust of various sizes. Table 3 shows the variations in cohesion and angle of internal friction with variation in the percentages of stone dust.
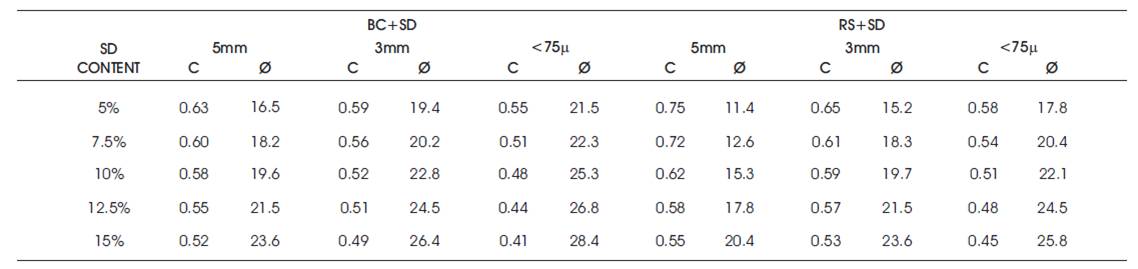
Table 3. Variation of cohesion (c = Kg/cm2) and angle of internal friction (ø = Degrees) for black cotton and red soil
The unconfined compressive strength for black cotton and red soil got increased when treated with different sizes of stone dust. The strength has been increased with the increase in the percentages of stone dust.
The UCS strength for various percentages of stone dust for black cotton soil is shown in Figure 13.
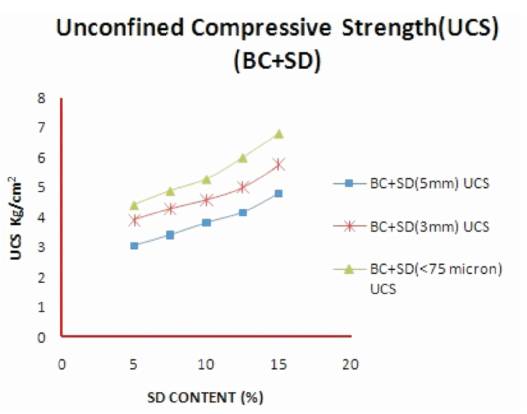
Figure 13. Variation of UCS for Black cotton soil stabilized with various sizes of stone dust.
The UCS strength for various percentages of stone dust for red soil is shown in Figure 14.
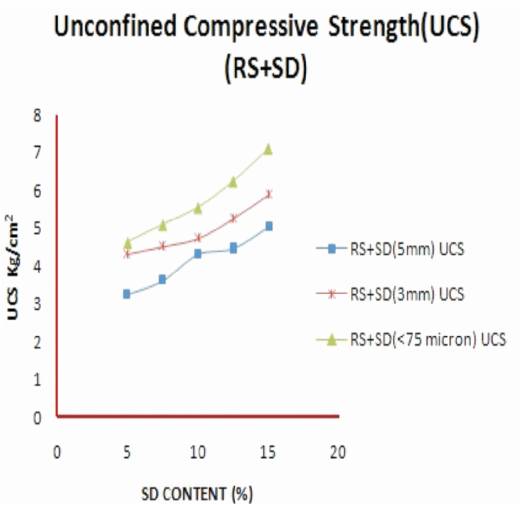
Figure 14. Variation of UCS for Red soil stabilized with various sizes of stone dust
The California bearing ratio for black cotton and red soil got increased when treated with different sizes of stone dust. The strength have been increased with the increase in the percentages of stone dust.
The Unsoaked CBR strength for Black cotton is shown in Figure 15.
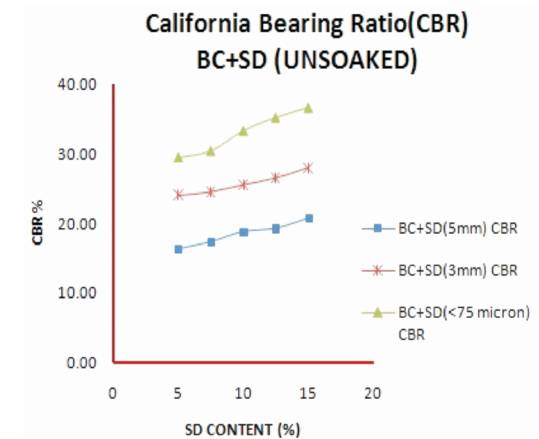
Figure 15. Variation of Unsoaked CBR Strength for Black Cotton Stabilized with Various Sizes of Stone Dust
The Unsoaked CBR strength for Red soil is shown in Figure 16.
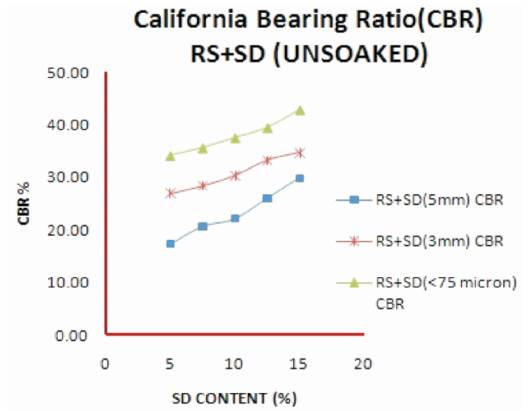
Figure 16. Variation of Unsoaked CBR Strength for Red Soil Stabilized with Various Sizes of Stone Dust
The soaked CBR strength for Black cotton is shown in Figure 17.
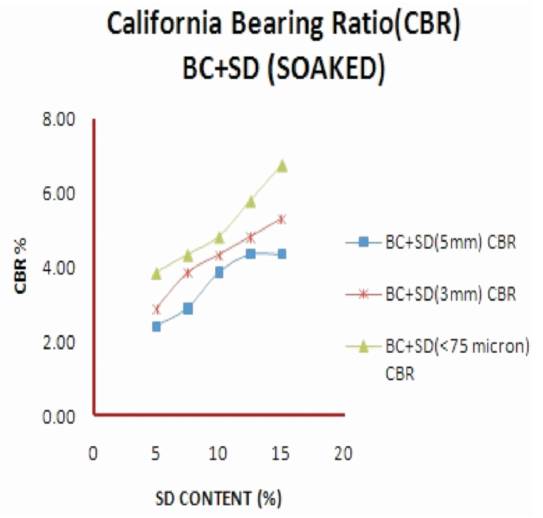
Figure 17. Variation of Soaked CBR Strength for Black Cotton Stabilized with Various Sizes of Stone Dust
The soaked CBR strength for Red soil is shown in Figure 18.
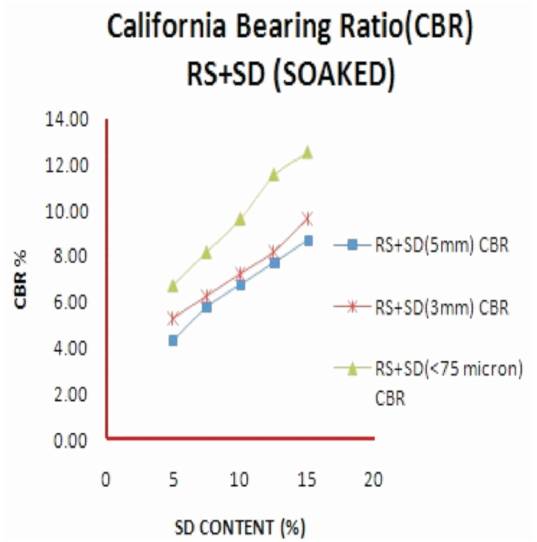
Figure 18. Variation of Soaked CBR Strength for Red Soil Stabilized with Various Sizes of Stone Dust
The permeability (cm/sec) values decreases with increase in the percentage of stone dust. From the graph, it has been concluded that the stone dust of 75 microns possesses low permeability values when compared to 3mm and 5mm size of stone dust because of void spaces present between them with the increase in the size of stone dust. Table 4 shows the variation in permeability values with the addition of various sizes of stone dust.
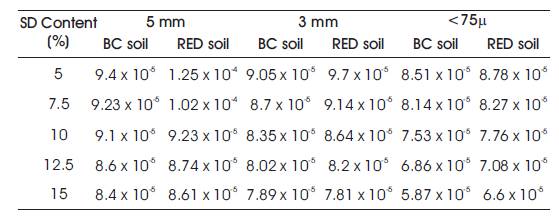
Table 4. Variation of permeability (k=cm/sec) values with the addition of various sizes of stone dust for BC and RED soil.
The strength of sub-base and sub-grade can be decided by elastic modulus which plays an important role for the design and performance of pavements. The elastic modulus can also be termed as resilient modulus which can be estimated from empirical relationships.
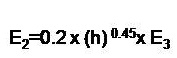
Elasticity modulus Es (MPa) of sub base is given by
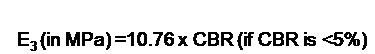
Following is the relationship between elastic modulus of sub-grade and its CBR

Where h2=thickness of sub-base layer in mm (considered as 200mm) and E3=modulus of underlying layer, i.e., subgrade in MPa. As per IRC 37-2012.
Table 5 shows the results of modulus of elasticity for black cotton with the increase in percentages of variation in sizes of stone dust.
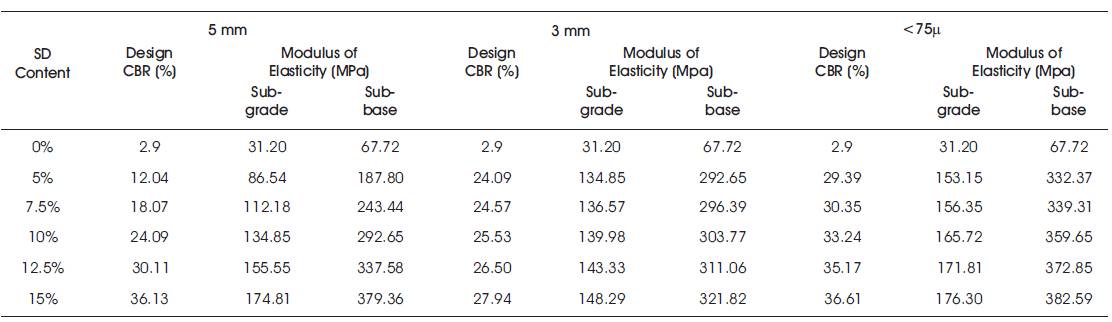
Table 5. Variation of Elastic modulus (Es=MPa) of Black cotton soil stabilized with various sizes of stone dust
Table 6 shows the results of modulus of elasticity for red soil with the increase in percentage of variation in sizes of stone dust.
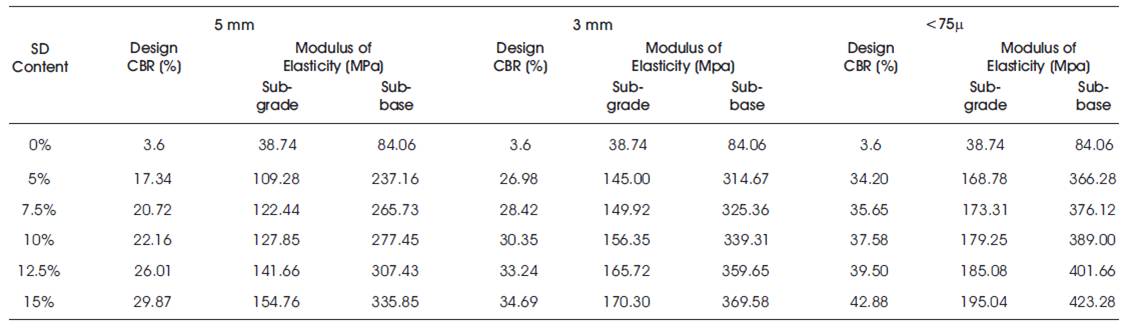
Table 6. Variation of Elastic modulus (Es=MPa) of Red soil stabilized with various sizes of stone dust
The authors would like to thank the Principal of VNR VJIET and the management authorities for giving encouragement for the research and our sincere thanks to Dr. B. Naga Malleswara Rao, Professor and Dean of Academics and A. Mallika, Professor and Head of Civil Engineering Department for providing all facilities for the completion of this research successfully.