(1)
Phosphate glasses having composition 50P2O5 -10Al2O3 -20ZnO-(20-x)Na2 O-xCeO2 with x varying from 0- 5 mol% have been prepared using the conventional melt quench technique. The amorphous nature of prepared glasses is confirmed from the XRD spectra. The density of prepared glasses has been evaluated using the Archimedes' principle. The density of the prepared glasses is found to increase with the concentration of CeO2 while molar volume just follows the reverse trend. The density and molar volume values are then used to calculate rare earth ion concentration, polaron radius, inter-nuclear distance, and field strength. UV-Visible absorption spectroscopy has been carried out in the range 300-1000 nm. The onset value of absorption edge is shifted from 370 nm to higher wavelengths with cerium doping and the absorption coefficient is enhanced. The indirect optical band gap energies have been found to be attenuated with CeO doping due to formation of more Non-bridging Oxygen (NBOs) atom. Fourier Transform-Infrared Spectroscopy (FTIR) spectra have been obtained for the prepared glass samples and it is found that some new peaks are formed with doping of CeO2 in prepared glasses.
In recent years, enormous work has been done on rare earth doped phosphate glasses due to their wide range of applications, such as solid state laser hosts, glass to metal seals, optical glasses, and optical waveguides ( Dousti and Amjad, 2015; Pisarski et al., 2014; Babu et al., 2012). Phosphate glasses are gaining importance due to their properties like low melting temperature (as compared to silicate glasses), low glass transition temperature, and high thermal expansion coefficient ( Tiwari et al., 2011; Bingham et al., 2009; Shelby, 2000). These glasses are widely used as they have low phonon energy, better transparency in Ultraviolet (UV) and near Infrared (IR) region and low nonlinear refractive index (Liang et al., 2014). These glasses are vital as they possess weak upconversion luminescence and have less probability for energy back transfer which makes them suitable as laser host materials.
Among rare earths, cerium belongs to the lighter group of lanthanides and can exist in either trivalent (Ce3+ ) or tetravalent (Ce4+ ) state in the oxide glasses. In the radiation resistance mechanism, Ce3+ act as electron traps while Ce3+ act as hole traps and thus avoid the formation of colour centres on irradiation ( Li et al., 2014; Laopaiboon et al., 2016; Xinjie et al., 2014). For tetravalent cerium ions, absorption is due to charge transfer and hence no luminescence spectra is observed whereas for trivalent cerium ions there exist 4f-5d electronic transitions due to wide energy gap and hence luminescence spectra is observed (Efimov et al., 2013).
Cerium doped oxide glasses are extensively studied due to their strong optical absorption in UV region. These glasses are significant due to their fluorescence in visible and infrared region which makes them suitable for lasers (Wang et al., 2015). In addition, these glasses also offer their application as scintillator for the detection of X-rays, g-rays, and neutrons ( Shinozaki et al., 2013; Zu et al., 2009; Caldiño et al., 2015). However, the major setback of cerium doped glasses as luminescence materials is the concentration quenching effect of cerium ions due to clustering of these ions in the glass matrix ( Wang et al., 2016; Malchukova and Boizot, 2014).
Although a lot of work has been done on rare earth doped phosphate glasses, but only a few have worked on cerium doped zinc phosphate glasses. Thus keeping this in mind, the glasses with composition 50P2O5 -10Al2O -20ZnO3-(20- x)Na2 O-xCeO2 were synthesised with x varying from 0 to 5 mol% using melt quench technique. The aim of the present study is to determine that cerium modifies the optical properties of phosphate glasses and they can be used in optical devices. These glasses are then characterised for their detailed physical, optical, and structural properties using X-ray powder diffraction (XRD), UV-Visible, and FTIR spectroscopy.
The glasses having composition 50P2O5 -10Al2 O -20ZnO3- (20-x)Na2 O-xCeO3 with x varying from 0-5 mol% were prepared using the conventional melt quench technique. The chemicals were weighed and mixed to obtain the homogeneous mixture. This mixture was then placed in the alumina crucible which was kept in furnace and the temperature was raised to 12000C. The melt was kept at this temperature for 2 hours to obtain homogeneity. After the complete melting, the melt was poured onto a preheated steel plate which was maintained at a suitable temperature. All the glasses were annealed at 3800C for 24 hours to remove internal stress present.
XRD studies of the prepared glass samples were carried out using CuKa radiation with XRD -7000 Shimadzu X Ray Diffractometer on powdered glass samples at scanning o o o rate of 2 per minute in the range of 20 -80 .
Density of prepared glass samples was calculated using Archimedes' Principle with xylene as the immersion liquid. The density of the samples was calculated using the formula:
where Wa is the weight of glass in air, Wl is the weight of glass in liquid, and rl is the density of immersion liquid. The molar volume of the glasses was evaluated from density value as,
The optical absorption spectra of polished glass samples having thickness in range of 1-2 mm were recorded using double beam spectrophotometer Shimadzu 1601 in the range from 300-1000 nm.
FTIR spectra of prepared glass samples were recorded at room temperature in the wave number range from 400- 1300-1 cm by Fourier transform computerised infrared spectrometer.
Figure 1 shows the XRD spectra of powdered glass samples. Absence of any sharp peak in the spectra confirms the amorphous nature of prepared glasses.
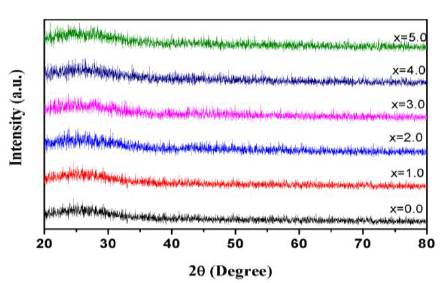
Figure 1. XRD Spectra of 50P O -10Al O -(20-x) 2 5 2 3 Na O-20ZnO-xCeO Glasses
The density of oxide glasses is largely affected by the packing fraction of structural units present. Figure 2 shows the variation of density and molar volume as a function of concentration of cerium oxide. The density of prepared 3 glass samples is found in the range of 2.34-2.43 g/cm . The density of phosphate glasses is found to increase with CeO2 concentration as the molecular weight of CeO2 is more than that of Na2O. This also shows that with addition of CeO2 in the host glass, the cross linkages between NBOs increases which makes the glass structure more dense. Also, the molar volume is found to decrease with increase in concentration of CeO2 which shows that the glass is becoming more compact with CeO2 .
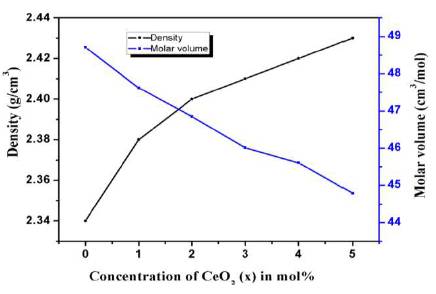
Figure 2. Variation of Density and Molar Volume of Prepared Glasses as Function of CeO Content
Figure 3 shows the UV-Visible optical absorption spectra of prepared glasses in 300-1000 nm range. Due to the amorphous nature of prepared glasses, the optical absorption edge is not sharply defined in prepared glasses. The characteristic curve for all glasses exhibit the same behavior except the onset value of absorption edge. The absorption edge has been found to be red shifted with CeO2 doping. This is attributed to the enhancement of NBOs with CeO2 doping (Bahadur et al., 2013). As the concentration of CeO2 is enhanced above 3 mol%, the resultant glass attains a pale yellow colour. This is also obvious from a broad band observed at 588 nm in UV visible absorption spectra. Absence of any sharp absorption band in the spectra depicts that cerium is present as Ce4+ ions in the prepared glasses. The absorption coefficient a for oxide glasses is related to Eoptical by Davis and Mottpower law (Mott and Davis, 1979) given as:
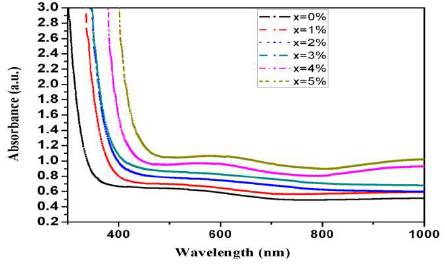
Figure 3. UV Visible Optical Absorption Spectra of Prepared Glasses
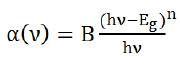
where n is a parameter that depends upon the type of transition present.
Figure 4 shows the indirect optical band gap for prepared glass samples. Indirect optical band gap energies are found to decrease with CeO2 concentration. Table 1 lists the composition, density, molar volume, and indirect band gap energy of prepared glasses. This is attributed to the conversion of bridging oxygen atoms to non-bridging oxygen atoms. The non-bridging oxygen atoms facilitate the excitation of electrons to higher energy states and thus lower the band gap ( Tauc, 1974; Mallur et al., 2015). It can also be due to the fact that CeO2 acts as a glass modifier and it depolymerises the phosphate glass network by converting Q2 structural units into Q1 and Q0 structural units which is also confirmed from FTIR spectra.
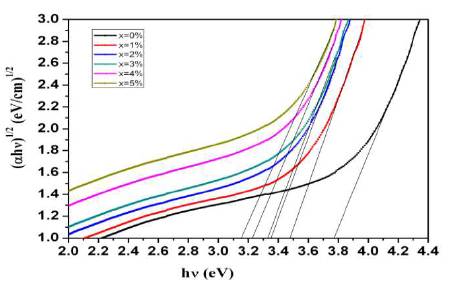
Figure 4. Tauc Plot for Indirect Band Gap Energy of Prepared Glasses
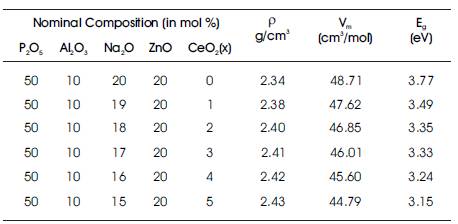
Table 1. Nominal Composition, Density, Molar Volume, and Band Gap Energy of Prepared Glass Series
FTIR spectra reveal useful information regarding various molecular vibrations and rotations associated with the covalent bonds present in the network. It also helps in understanding the changes induced in the glass network with doping of various modifiers and intermediators. Figure 5 shows the IR spectra of all the prepared glass samples in 400-1300-1 cm frequency range. The spectral broadening in FTIR and Raman spectra is related to the presence of many different groups and bonds. It is well established that the structure of phosphate glasses is highly influenced by the Oxygen/Phosphate (O/P) ratio in the glass composition (Martin, 1991). With change in this ratio due to addition of various modifiers, the phosphate network gets depolymerised and shifts from cross-linked Q3 tetrahedral units (O/P= 2.5) into linear Q2 units (O/P= 3.0), Q1 units (O/P= 3.5), and isolated Q0 units (O/P= 4.0).

Figure 5. Fourier Transform Infrared Spectra of Prepared Glasses
For cerium free phosphate glass, seven bands have been observed at 533, 628, 673, 769, 896, 1115, and1311 cm-1 in the FTIR spectra (Brow et al., 2000). The band at 533 cm-1 is assigned to bending mode of O-P-O bonds in the Q1 structural units. This band also represents the deformation of basic tetrahedral units. A weak shoulder observed at 628 cm-1 is attributed to the presence of asymmetric vibrations of P-O-P linkages. A weak but sharp peak at 673 cm-1 is assigned to the presence of AlO4 groups. The band at 769 cm-1 is due to the presence of asymmetric stretching of P- O-P linkages in Q1 structural units. The peak at 896 cm-1 is assigned to the symmetric stretching of P-O-P linkages in Q1 structural units. The band at 1115 cm-1 is attributed to the presence of terminal PO -groups in Q2 structural units. The intensity of this band is found to decrease with CeO2 concentration which shows that with CeO2 , Q2 structural units are fading. The band at 1311 cm-1 is assigned to asymmetric stretching vibrations of P=O bonds.
With the addition of CeO2 in phosphate glass, intensity and wave number of all the bands is found to vary slightly, with the formation of some new bonds ( Lai et al., 2011; Farrow and Vogel, 1992). The band at 533 cm-1 is shifted towards lower frequency range to 522 cm-1 and this band is found to be more profound. The wave numbers corresponding to shoulder at 628 cm-1 , band at 673 cm-1 , and 769 cm-1 are not affected with the presence of CeO2 , while the intensity of all these bands is enhanced. The peak at 896 cm-1 is shifted to higher frequency and is observed at 902 cm-1 for glass with 5 mol% CeO2 . One weak band is developed at 1006 cm-1 with doping of 2 mol% CeO2 and this band gets shifted towards higher frequencies and is observed at 1026 cm-1 for 5 mol% of CeO2 . This band is assigned to the P-O- stretching modes of non-bridging oxygen atoms in Q0 structural groups. The peak at 1115 cm also remains unaffected with CeO2 doping while the peak at 1311 cm-1 is shifted the most, and with CeO2 , it appears at 1280 cm-1 and is then shifted towards still lower frequency at 1254 cm for 5 mol% CeO2 doping. Thus FTIR spectra reveal that both Q1 and Q2 structural units along with a few Q0 structural units are present in phosphate glasses doped with CeO2 . Also, with CeO2 doping the probability of getting Q2 structural units diminishes at the expense of Q1 and Q0 structural units. This affirms that the aluminophosphate glass network is depolymerised with CeO2 doping.
Transparent, bubble free amorphous sodium alumino phosphate glasses doped with CeO2 have been synthesized and it has been observed that glasses with more than 2 mol% of CeO2 are pale yellow in colour. The density of prepared glass samples is found to be elevated while the molar volume is found to be attenuated with cerium doping which confirms that the glass structure becomes more compact and dense with CeO2 . Both indirect and direct optical band gap energies are found to be attenuated with CeO2 due to the formation of more non-bridging oxygen atoms, which is also supported by FTIR spectra. The refractive index as calculated from Lorentz- Lorentz equations is found to be increasing which shows that these glasses can be used as optical devices. Q1 structural units dominate the glass network with the presence of a few Q0 and Q2 structural units. Also, CeO2 is not able to break P-O-P linkages to form Ce-O-P linkages. Thus, presence of cerium only modifies various physical, thermal, and optical properties of prepared glasses.