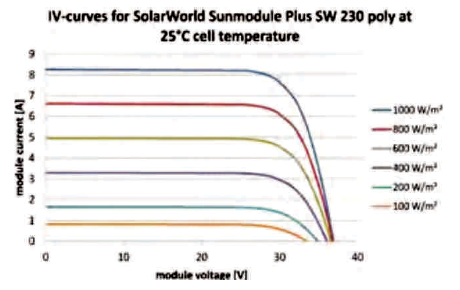
Figure 1. Characteristic Curve of a 230 W PV Module from Sun Module SW 230 Poly/Version 2.0 and 2.5 Frame
This paper provides a brief idea about modeling of Solar Photovoltaic systems. This paper presents simulation model of PV array which is used to evaluate the electrical performance of PV array with respect to changes in temperature and irradiation. The proposed paper includes design and simulation of a 10 kW Stand-alone solar photovoltaic system. The equivalent circuit model of a cell is simulated using Matlab/Simulink to examine a typical 235 W solar module and 10 kW solar PV array. In this paper, an MPPT tracker using modified Adaptive P & O algorithm is proposed to improve the efficiency of solar photovoltaic system. The algorithm identifies a particular duty ratio at which the DC-DC converter should operate to maximize the power output. The proposed model is designed with the help of Matlab/Simulink. The data provided by the manufacturer are used to calculate the non-linear parameters. The characteristic of the proposed model is compared with reference PV module. The 230 W PV modules manufactured by Sun module SW 230 poly/Version 2.0 and 2.5 Frame are used as a reference. The large solar PV array system is modeled and simulated using the data provided in this module. The proposed model results in improved performance of solar photovoltaic systems.
Tthe demand for energy is increasing with increase in population. The fossil fuels are limited in supply and causes environmental hazards such as global warming. Hence to meet the energy demand, the renewable energy sources play an essential role in power generation. Renewable energy is environment friendly so it can be a good alternative to fossil fuels. The available renewable sources, are wind energy, solar energy, biomass energy, etc., but solar energy is the most popular among them. The Solar PV technology is the fast growing technology in the global market [1]. The Solar PV technology is becoming popular as a renewable source as it is free, non-polluting and requires little maintenance. Solar energy is collected with the help of PV cells to produce electricity and these PV cells have unique characteristics which produce DC output. The PV cells are made up of semiconductor materials that convert light energy from sun directly into electricity. Solar cell is basically a PN junction fabricated in layer of semiconductors [14]. When solar cell is exposed to light, the electrical energy is produced by the photoelectric effect. The energy produced by solar cell is proportional to the intensity of sunlight. The voltage produced by a PV cell may vary from 0.6 to 0.8 V depending on semiconductor material and technology used. The PV cells are interconnected in series/parallel configuration to obtain the required power output. The PV cells are connected in series to form a PV module to obtain the higher output voltage and are connected in parallel to form a PV array and obtain the required output current. The output of a solar cell is non-linear, i.e. PV cell has non-linear current-voltage characteristic [15]. The power output of solar PV modules varies with solar irradiation and solar cell temperature. For better utilization of available solar energy, it is important to operate the system at its MPP only, i.e. the output of the PV module should approach the MPP. The technique used for obtaining the maximum power from the PV array is known as Maximum Power Point Tracking (MPPT). The boost converter, i.e. the DC-DC converter is employed in the PV array model to step up the voltage of the PV array to the required level of voltage. The proposed MPPT algorithm operates with the boost converter and changes the duty cycle of the converter according to variations in irradiance and temperature. The modeling and simulation is performed using MATLAB/Simulink software [12]. The proposed model is based on the PV module manufactured by the Sun module SW 230 poly/ Version 2.0 and 2.5 Frame at Standard temperature conditions, such 2 o as irradiation=1000 W/m2, reference temperature = 20ºC. The information available from the datasheet of Sun module SW 230 poly/ Version 2.0 and 2.5 Frame PV modules were used in the simulation of the Solar PV array. The electrical specifications and characteristic curve for various values of irradiance and temperature for 235 W PV modules are shown in Table 1 and Figure 1, respectively.
Figure 1. Characteristic Curve of a 230 W PV Module from Sun Module SW 230 Poly/Version 2.0 and 2.5 Frame

Table 1. Specification of a 230 W PV Module from Sun Module SW 230 Poly/Version 2.0 and 2.5 Frame [16]
The simulation results were compared with characteristic curve of a 235 W PV module manufactured by Sun module SW 230 poly/Version 2.0 and 2.5 Frame. Further the PV modules were connected to form a solar PV array to obtain the 10 kW power output [16].
Solar cell is the main constituent of photovoltaic panels. A solar cell converts the sunlight falling on it directly into electricity by photovoltaic effect. The electrical characteristics of a solar cell differs under varying solar irradiation.
The solar cell is generally represented by an electrical equivalent one diode model as shown in Figure 2 [6], [9], [16]. Nomenclature is given as in reference paper [13].
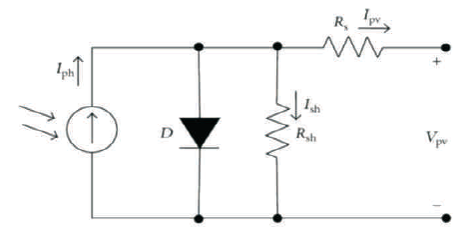
Figure 2. Equivalent Circuit of Solar Cell
The photovoltaic cell can be modeled using following equations,
Module photo current:


It converts the module operating temperature from degree Celsius to Kelvin. Different sub systems are shown in Figures 3 to 8.
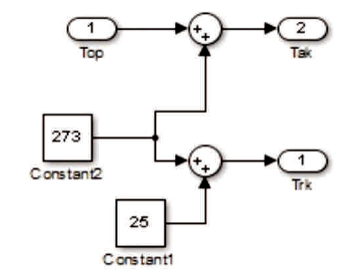
Figure 3. Circuit under Subsystem 1
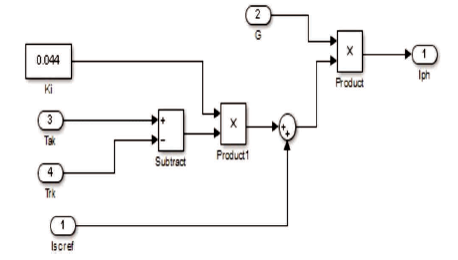
Figure 4. Circuit under Subsystem 2
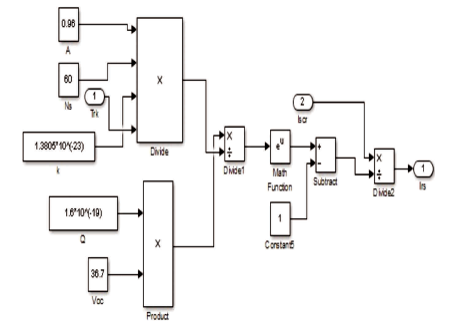
Figure 5. Circuit under Subsystem 3
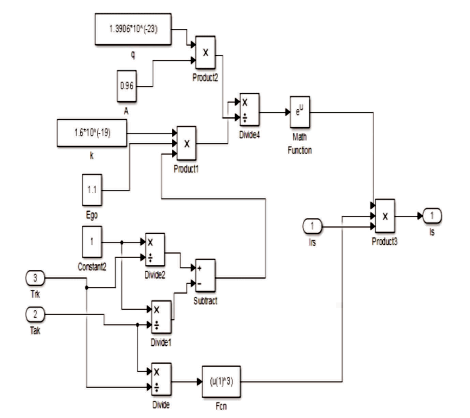
Figure 6. Circuit under Subsystem 4
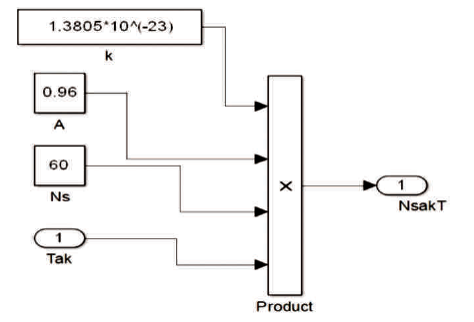
Figure 7. Circuit under Subsystem 5

Figure 8. Circuit under Subsystem 6
This module calculates photocurrent (Iph) using equation (1).
This module calculates reverse saturation current (Iph) using rs equation (2). This model takes Iscr= 8.7 A at reference temperature = 25 C.
It takes reverse saturation current Irs as input which was calculated in equation (2) and module reference temperature, module operating temperature (Tak) as input and then calculates module saturation current (Is) using equation (3) [9].
This model takes operating temperature as input, i.e. Tak and calculates the product NsKAT.
This module calculates the PV cell current (Ipv) where Vpv = Voc , Np =1, and Ns = 60.
All the above six subsystems are interconnected to form a PV cell which is shown in Figure 9.
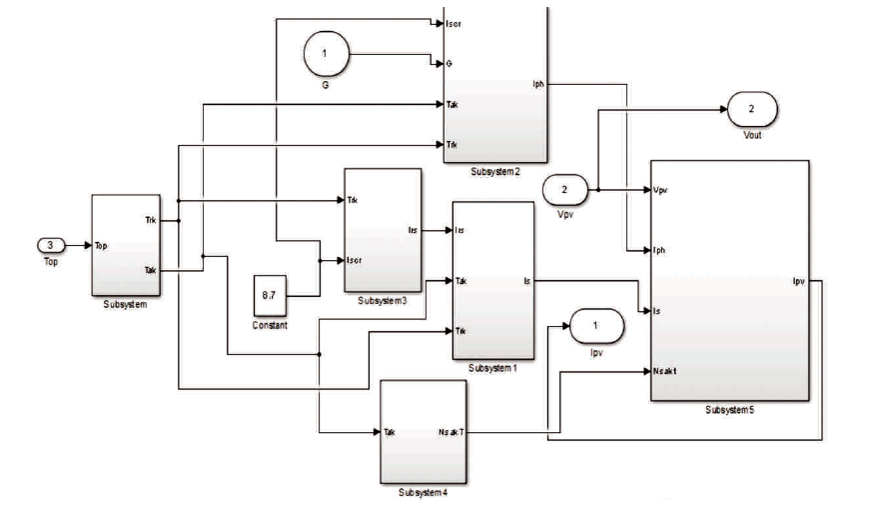
Figure 9. Simulation of a PV Module [13]
The PV modules are connected in series/parallel configuration to form a PV array as shown in Figure 10. The solar irradiation and temperature are given as input to this array model, where Ns = 660, Np = 4.
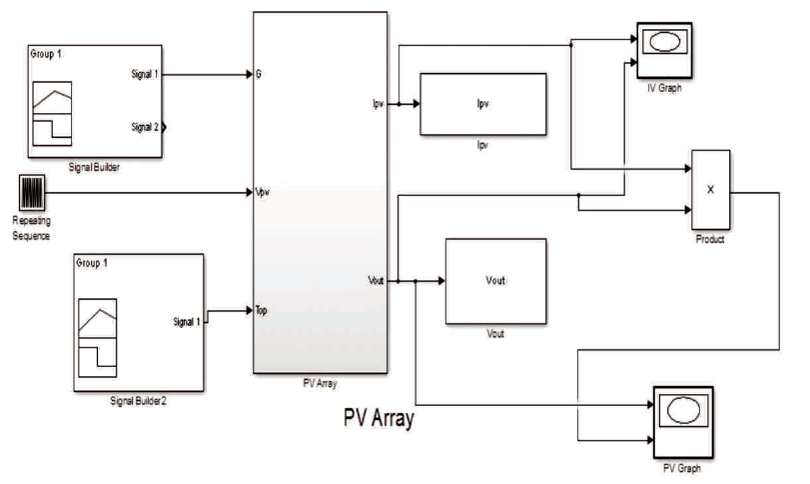
Figure 10. Simulation of a PV Array
The Photovoltaic array generally exhibits non-linear I-V characteristics [5] as the solar irradiation keeps on fluctuating with respect to change in environmental conditions, but MPPT control algorithms can detect this change and are able to track maximum power available at the MPP. The solar irradiation is directly proportional to solar cell input, if irradiation is high then it results into high value of the current, therefore magnitude of power increases for the same voltage as the PV voltage remains same under varying irradiation [2]. Irradiation considered is shown in Figure 11 and temperature throughout irradiation is taken 25oC. The effect of varying irradiation on constant temperature is shown in Figures 12 and 13.
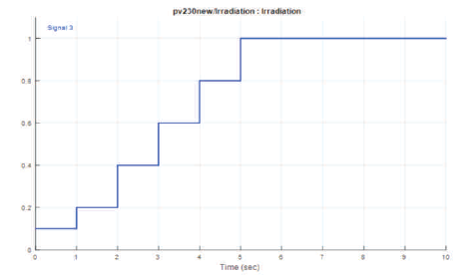
Figure 11. Varying Irradiation
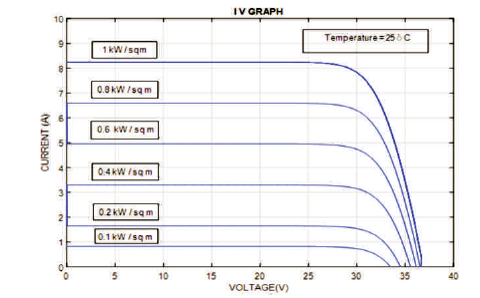
Figure 12. I-V Graph

Figure 13. P-V Graph
The current generated by the solar cell increases slightly while the voltage decreases with increasing temperature.
Thus power output decreases with increase in voltage. The effect of the temperature increases and decreases the voltage and power. Low temperature is recommended for better results [2]. The effect of varying temperatures at constant irradiation is shown in Figures14 and 15.

Figure 14. I-V Graph

Figure 15. P-V Graph
The I-V curve and P-V curve for the data given in Table 2 are shown in Figures 16 and 17, respectively.

Table 2. 10 kW PV Array Parameters
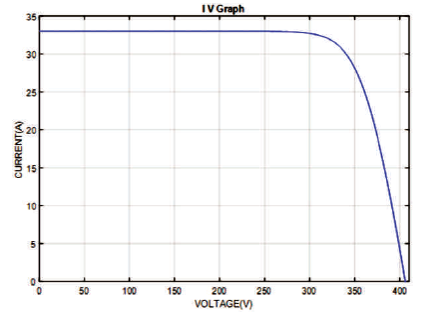
Figure 16. I-V Graph

Figure 17. P-V Graph
Stand-alone PV systems are the off-grid systems. These systems are remote area power supply system. In such circumstances, it is most economic to setup a Stand -alone PV system as shown in Figure 18 [4, 7, 17].
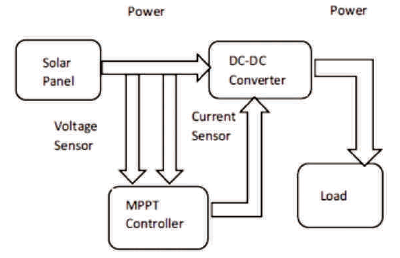
Figure 18. Block Diagram representation of a Standalone Solar PV System
The power output of the Solar PV module varies with solar irradiation and solar cell temperature. Every photovoltaic module has an optimal operating point known as maximum power point in the P-V curve of the photovoltaic module. The PV module should operate around this point to obtain maximum power, i.e. output of the PV module should operate close to the MPP (Figure 19). The mechanism of operating PV module at this specific point is known as Maximum Power Point Tracking [7]. It is connected in middle of the array and load to detect the maximum power output from the array. The algorithm proposed in this paper is Modified Adaptive P and O method. Modified Adaptive P and O as shown in the flow chart (Figure 20) is taken from the reference paper [11].
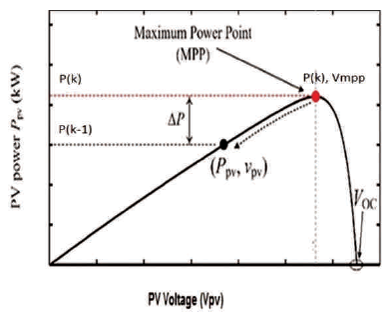
Figure 19. PV Curve showing MPP
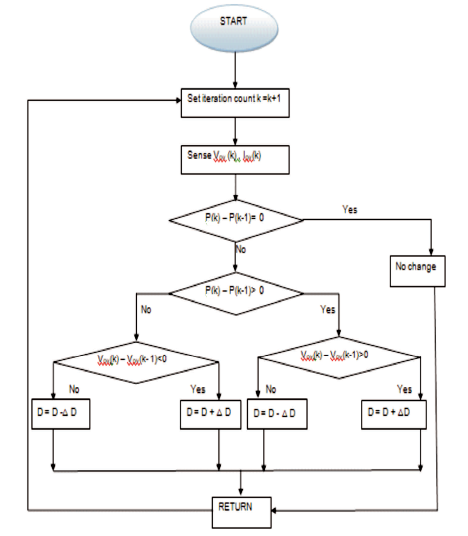
Figure 20. Flowchart of Modified P & O Algorithm [14]
It is known as a step-up DC-DC switching converter (Figure 20). The boost converter steps up the input voltage to a specific level according to the duty cycle. The PV array produces a very low voltage. Therefore the boost converter is employed in solar PV systems to step up the voltage. The boost converter steps up the voltage, but steps down the current and hence the output power remains the same. The switches are used to charge the capacitor and the capacitor is used as a filter to control the duty cycle of switch [8, 10] and shown in Figure 21.


Figure 21. Boost Converter
where T = Ton + Toff
and Ton/T = D, where D is the duty cycle

where,
Vo = Output voltage of boost converter.
Vpv = Input voltage to the boost converter or output voltage pv from PV array [3, 10].
The above equation shows that the output voltage depends on the duty cycle and as it changes from 0 to 1, the output voltage increases accordingly.
Figure 21 shows the circuit diagram of Boost Converter. Typical waveform of Boost Converter is represented in Figure 22. MPPT control algorithm simulation of boost converter and MPPT are shown in Figure 23. Simulation of MPPT modified adaptive P and O algorithm is given in Figure 24. The voltage is boosted up to 614.15 V by the boost converter for a resistive load of 40 Ώ. The simulation result of PV array is presented in Figure 25.
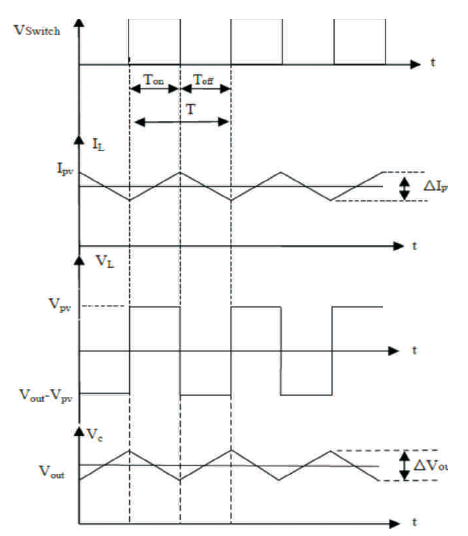
Figure 22. Typical Waveform of a Boost Converter
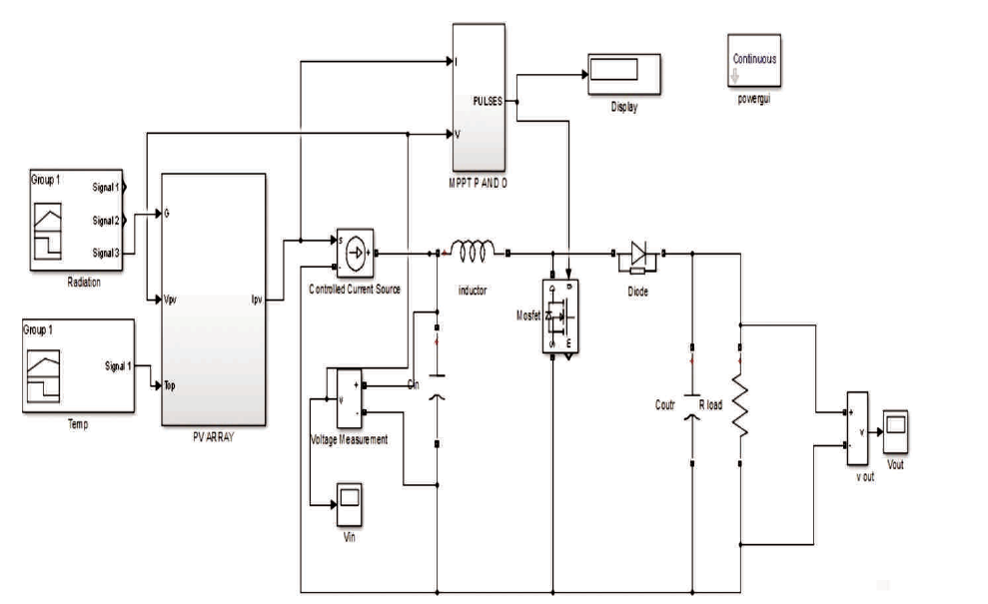
Figure 23. Simulation of PV array with Boost Converter and MPPT P & O

Figure 24. Simulation of MPPT Modified Adaptive P & O Algorithm

Figure 25. Simulation Result of PV Array with Boost Converter and MPPT Controller
In this paper, the solar cell I-V and PV curves were obtained both at constant and varying irradiations. The simulation results were compared with the Sun module SW 230 poly/ Version 2.0 and 2.5 Frame and the results were found to be better and accurate. A resistive load of 40 ohms was connected at the end point of the circuit. When there is change in the solar irradiation, the MPP changes therefore there is a need to track this maximum power point according to varying irradiations. Therefore, the MPPT control algorithm, i.e. Modified Adaptive Perturb and Observe method was implemented to control the duty cycle of the converter so as to track the maximum available power. The operation of boost converter was to boost the solar array PV voltage up to the required level. The loss of power from solar PV array side to boost converter side is mainly due to switching losses of power electronic devices and losses in inductor, capacitor at boost converter side.
The parameters for 235 W solar photovoltaic array are given in the below table.

Table A1. Parameters