Figure 1. Electrode Placement
Electroencephalography (EEG) is an electrophysiological monitoring method to record electrical activity of the brain. EEG recording is highly susceptible to various forms and sources of noise, which present significant difficulties and challenges in analysis and interpretation of EEG data. Noise sources may consist of power line interference, base line noise, random body movements or respiration. A number of strategies are available to deal with noise effectively both at the time of EEG recording as well as during pre-processing of recorded data [8]. In this work, the authors have proposed FrFT based Barlett window to enhance the quality of EEG signal and the fidelity parameters like Signal to Noise Ratio (SNR), MSE, LSE, and sensitivity have to be computed and analyzed in a Matlab environment.
Non-integer order filters (also known as fractional order filters) are a rapidly growing field in signal processing. Theoretical basis of such filters is relatively well documented. However, many problems are still open in the aspects of filter tuning and implementation [2] .
Irreversible brain damages can result from a trauma that is not properly diagnosed, or too late. Hence there is a need for a reliable tool that can be used by emergency services in order to obtain a quick diagnosis of TBI at the place of injury [1]. Seizure, the abnormal change in brain's electrical activity [2], with long duration can disturb various organs' functions leading to brain injury [1, 4]. Claassen, et al. showed that 19% of their patients who underwent continuous electroencephalography (cEEG) monitoring had seizures, mostly non-convulsive ones. 89% of them were in Intensive Care Unit (ICU) [4]
Typical EEG frequency ranges are delta (1-4 Hz), theta (4-8 Hz), alpha (8-12 Hz), beta (12-30 Hz), and gamma (>30 Hz), where each represent certain neural states of the brain with the gamma range believed to correspond to local processing in specific regions [5]. Since the state-of-the-art EEG systems can employ up to 256 electrodes and operate at as high as 16 kHz sampling frequency, even a few second measurement in such a system can generate hundreds of MBytes of data. The evaluation of these experiments result in long execution times (varying from minutes to hours depending on methods, data size, and control parameters) [6]. Decrease of oscillatory activity in a particular frequency band is called event-related de synchronization (ERD) and increase of oscillatory activity in a particular frequency band is called event-related synchronization (ERS). ERD/ERS patterns are produced by motor imagery, which is the imagination of movement without actually performing the movement. The frequency bands and in EEG signals have importance in motor imagery classification [3].
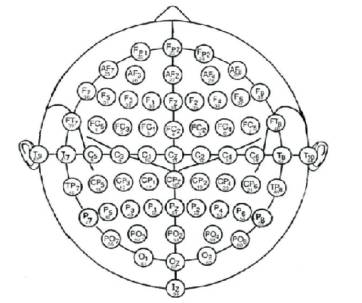
Small metal discs called electrodes are placed on the scalp in special positions. These positions are identified by the recordist who measures the head using the International 10/20 System. This relies on taking measurements between certain fixed points on the head. The electrodes are then placed at points that are 10% and 20% of these distances which are shown in Figure 1 and Figure 2.
Figure 1. Electrode Placement
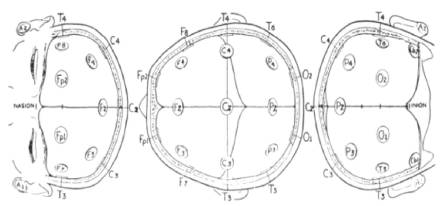
Figure 2. Electrode Placement in 10-20 system
EEG machines use a differential amplifier to produce each channel or trace of activity. Each amplifier has two inputs. An electrode is connected to each of the inputs shown in Figure 3.
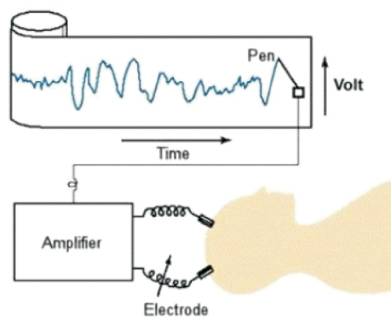
Figure 3. EEG Recording System
Differential amplifiers measure the voltage difference between the two signals at each of its inputs. The resulting signal is amplified and then displayed as a channel of EEG activity. The manner in which pairs of electrodes are connected to each amplifier of the EEG machine is called a montage.
Conventional analogue instruments consist of an amplifier, a galvanometer, and a writing device. A galvanometer is a coil of wire inside a magnetic field. The output signal from the amplifier passes through the wire causing the coil to oscillate. A pen mounted on the galvanometer moves up and down each time the coil moves. The pen draws the trace onto paper moving below it.
The amplifier output is controlled by high and low frequency filters and sensitivity controls. The high and low frequency filter values will set the window within which the EEG activity is recorded. This is known as the bandwidth. The sensitivity controls the size of the activity displayed.
A digital EEG system converts the waveform into a series of numerical values. This process is known as Analogue-to- Digital conversion (ADC).
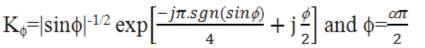
The fractional Fourier transform was first introduced by Namias [7] in its incomplete form. The FrFT can be expressed as,
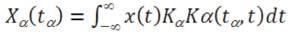
where,

The design of proposed filter is shown in Figure 4. EEG signal is applied to Barlett window with a number of samples N=50. The output of Barlett window is applied to FrFT. The resultant signal is transmitted through low pass filter to get the enhanced EEG signal. In this proposed window we vary the FRFT parameter a, where is varied from 0 to 1 in steps of 0.1 and the fidelity parameters like Signal to Noise Ratio (SNR), MSE, LSE, and sensitivity are computed and analyzed in a Matlab environment.
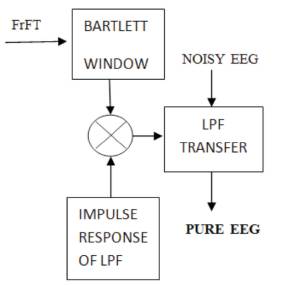
Figure 4. Proposed Filter
In this section, the responses of EEG processed signal through FrFT based filter have been shown and the obtained denoised signal as an output are shown from Figure 5 to Figure 13 under different FrFT optimization factors.
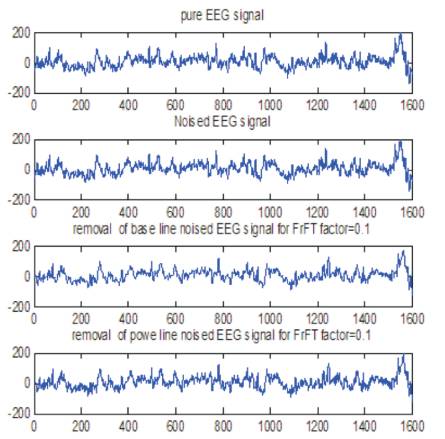
Figure 5. Removal of Power Line and Base Line Noise for α = 0.1
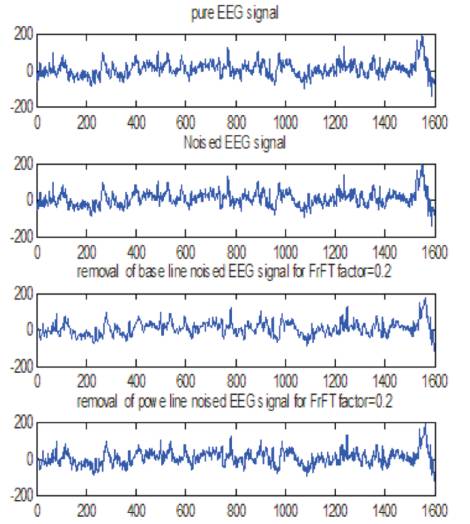
Figure 6. Removal of Power Line and Base Line Noise for α = 0.2
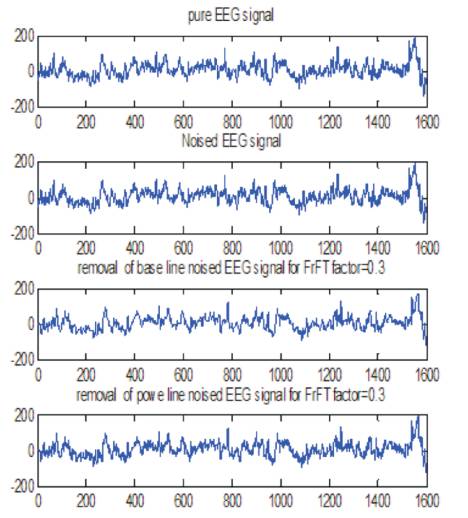
Figure 7. Removal of Power Line and Base Line Noise for α = 0.3
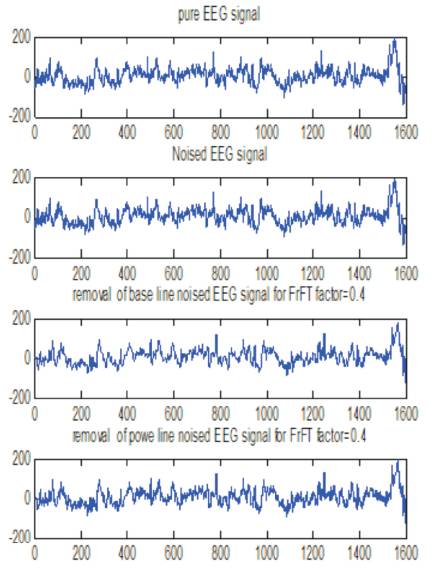
Figure 8. Removal of Power Line and Base Line Noise for α = 0.4
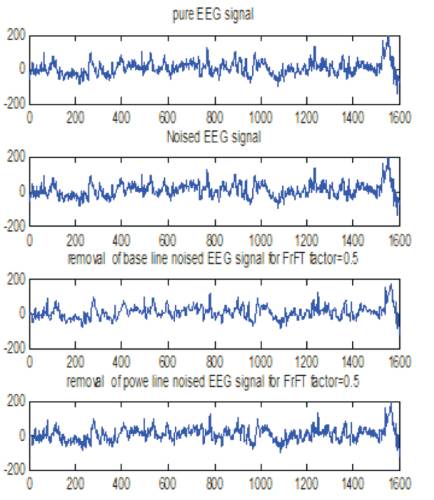
Figure 9. Removal of Power Line and Base Line Noise for α = 0.5
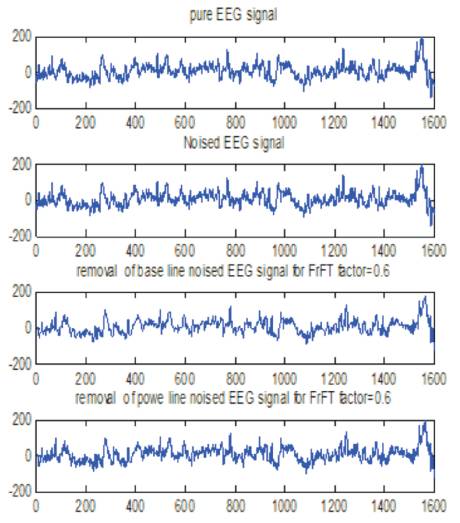
Figure 10. Removal of Power Line and Base Line Noise for α = 0.6
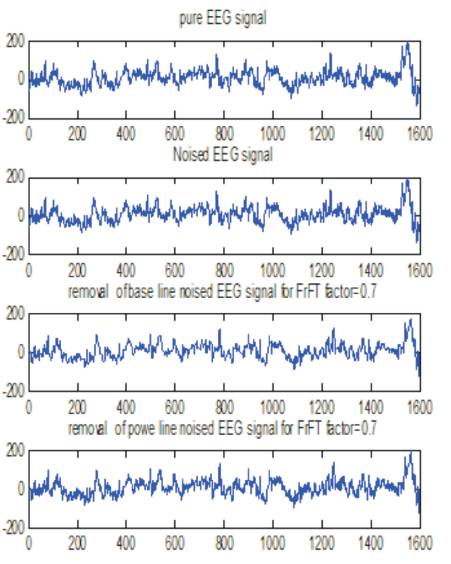
Figure 11. Removal of Power Line and Base Line Noise for α = 0.7
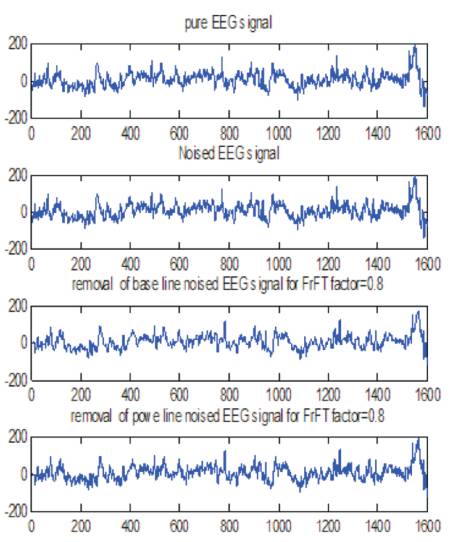
Figure 12. Removal of Power Line And Base Line Noise for α = 0.8
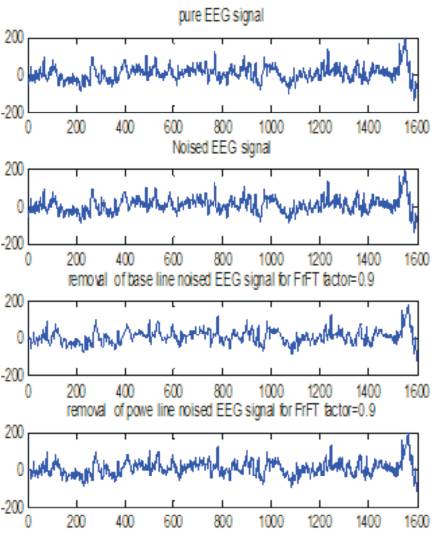
Figure 13. Removal of Power Line And Base Line Noise for α = 0.9
The proposed FrFT based Barlett window on noised EEG signal was performed. The authors have applied a noised EEG signal to FrFT based barlett window and obtained denoised EEG signal. The responses of FrFT based Barlett window were shown for different FrFT parameters. SNR, MSE, LSE and sensitivity of denoised EEG were compared for different FrFT parameters, in Table 1 and Figure 15. From the above discussions it is concluded that, SNR, MSR, and sensitivity is maximum at FrFT parameters 0.4, 0.3, 0.3, respectively, and LSE is independent of FrFT parameters.
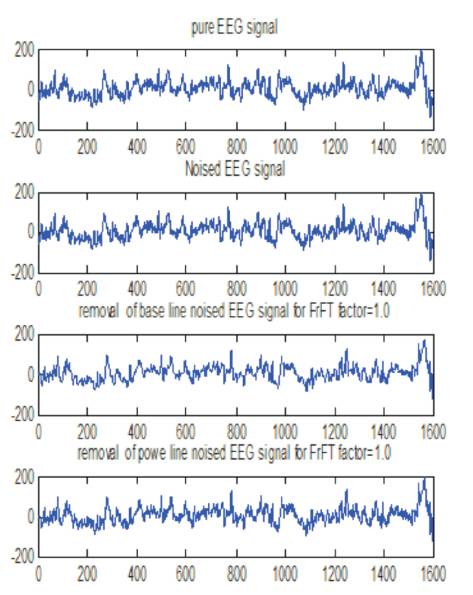
Figure 14. Removal of Power Line And Base Line Noise for α = 1.0
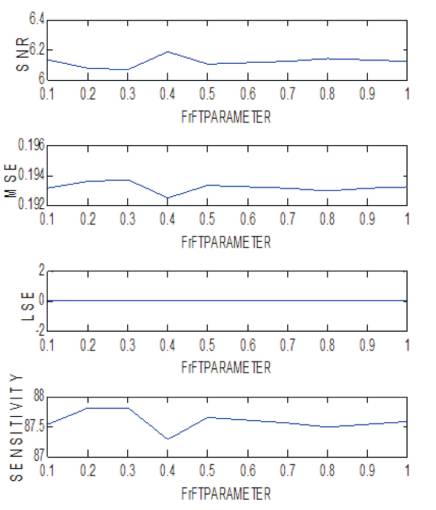
Figure 15. Performance of Proposed Window for different Values of FrFT Parameter
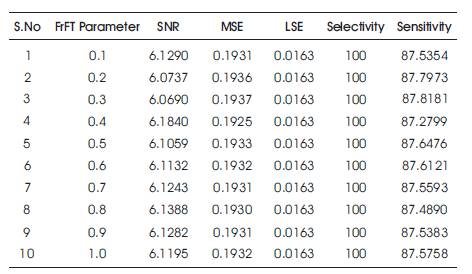
Table 1. Performance of Proposed Window for different Values of FRFT Parameter