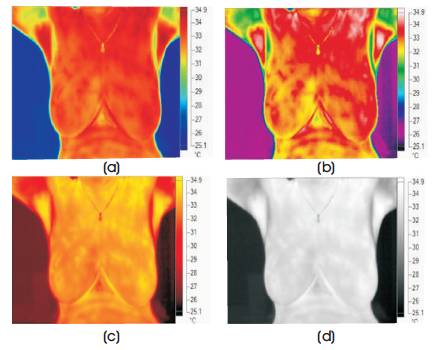
Figure 1. Breast Thermogram in Different Color Palettes, (a) Blue Red, (b) High Contrast, (c) Hot Metal, (d) Grayscale
For ages, human body temperature has been used as an indicator for judging the health status. Over the years, the science of Medical Thermography has evolved to measure body surface temperatures that help in making relevant judgments about diseases. Unusual temperature patterns or the values above permissible limits indicate abnormality. In most of the cases, such temperature differences indicate a high chance of inflammation, infection or malignancy. Localized increase in temperature is termed as Hot spot and is indicative of such abnormalities. This paper develops an algorithm to detect the highest temperature region in breast thermogram to predict the breast disease. Thermal image is captured using an infrared camera. The temperature data are processed to find the hotspot. The location and shape of the hotspot is detected. The thermograms are further segmented in left and right part manually. Statistical parameters are calculated from temperature data of segmented region. Significant differences in these parameters is observed for healthy and sick cases showing asymmetry. The presence of asymmetric hotspot suggests the further follow up. Results are validated by a radiologist confirming the performance of the algorithm.
Breast cancer has been known for decades to be the most common type of cancer among women. The incidence of breast cancer in India is on the rise and is rapidly becoming the number one cancer in women [1]. Breast cancer can be treated effectively only if it is detected at an earlier stage. A range of imaging methods like mammography, ultrasound and MRI are available for breast cancer detection [ 3 ] . Mammography is considered as the Gold standard imaging technology for breast cancer. But, mammography is structural imaging modality that exposes the breast to X-ray radiations on compressed breasts. Due to high compression of breasts and repeated exposure to toxic X-ray, mammography is not ideal for patients [4]
Infrared Imaging is fast emerging as an option for breast tests that are very safe. Thermography, is non-invasive, non-contact skin surface temperature screening test that is economic, quick and does not inflict any pain on the patient [1]. Human body emits infrared rays in proportion to the body temperature. Thermal camera converts this Infrared (IR) energy into electrical signals by the imaging sensor in the camera and displays on a monitor as a color image that represents the variations of the temperature values [5, 6]. The examination of female breast with IR camera for diagnosing the breast cancer is based on the fact that cancer tissue metabolizes more actively than other normal tissues and thus has a higher temperature. The heat thus produced is conveyed to the skin surface resulting in a higher temperature in the skin directly over the malignancy than in other regions [2]. Hence, the temperature distribution is altered, causing thermal asymmetry between the right and the left breasts. Thus, the cancer cells can be imaged as hotspots in the infrared images [3]. In a normal healthy subject, the skin temperature pattern is remarkably consistent showing bilateral symmetry. The asymmetric pattern indicates the deviation from the normal brought out by pathological changes [2].
The main objective of this work is to evaluate the feasibility of thermography as a breast imaging modality. Hotspot Detection Algorithm is developed in order to determine the spots with highest temperature which indicates the presence of abnormality.
The first use of thermography was by Gorman in 1939 that evaluated changes in vascular structure in breasts during pregnancy with infrared photography. Lawson (1956, 57) and Amalrie (1957) initially published research regarding thermography and breast cancer. In 1963, Lawson and Chughtai demonstrated empirical evidence that breast malignancy alters regional skin surface temperature.
V. Umadevi et al., have developed an ITBIC interpretation system for characterization of breast thermal images. This is a tool for differentiation of breast thermal images as normal or a case for follow-up, which is helpful for initial and mass screening. Statistical analysis was carried out on the results of ITBIC interpreter which resulted in Positive Predictive Values (PPV) of 80%, Negative Predictive Values (NPV) of 95.6%, Sensitivity of 66.7%, and Specificity of 97.7% [8].
Iman Zare, et al., described that thermography is suitable compared to the ultrasound diagnosis in detecting the breast tissue diseases, such as cystic masses and hypo echo masses by adopting asymmetry technique. This study emphasizes that thermography should not be used for the first time diagnosis. This technology needs accurate clinical evaluation and it is likely that thermography can be a part of breast screening, detecting, etc. in near future [10].
Xianwu Tang, et al., described the morphological measurement of Local Temperature Increase (LTI) amplitudes in breast infrared thermograms for breast cancer detection. By applying morphological approaches, they obtained LTI amplitudes, which have significant difference between benign and malignant cases. The patients with higher LTI amplitudes have higher carcinomous possibility. It determined the optimal LTI amplitude threshold of 1˚C for breast cancer detection from the Receiver Operating Characteristic (ROC) curve based on the rule of Youden's index maximization [7] .
Breast Thermograms are captured by thermal camera and are processed for hotspot detection. Hot spot detection provides the highest temperature area extraction, in order to determine the presence of lumps in the breast. The breast thermograms are further segmented manually in left and right part. Statistical parameters like mean, median, variance, skewness, kurtosis, and entropy are calculated. The significant difference is observed for healthy and abnormal cases. The results of algorithm are validated by a radiologist. Camera software 'SMARTVIEW' is used to view and analyze the image.
Infrared Camera FLUKE TiX 560 having a spectral response of 8 μm to 14 μm and IR Resolution of 320*240 is used for image acquisition at Magnolia Breast Care Center, Pune under the guidance of Dr. Shekhar Kulkarni. Recommended acquisition protocol is followed to improve accuracy. The test was carried out in AC room, which was darkened during the test and the temperature is adjusted between 18 to 22 degrees Celsius. Total 20 images are acquired, out of which 7 are sick and 13 are normal cases.
Thermal images captured by an infrared camera can be viewed using different color palettes. Breast Thermogram in different color palettes are shown in Figure 1.
Figure 1. Breast Thermogram in Different Color Palettes, (a) Blue Red, (b) High Contrast, (c) Hot Metal, (d) Grayscale
Figures 1(a), 1(b), 1(c) & 1 (d) are representation of the breast thermal image when viewed in different color palettes. Each breast thermogram is best viewed in a certain temperature scale and in a specific color palette. The blue red colour scale is selected in this work.
Specific camera compatible software 'SMARTVIEW' is used for viewing the thermal images. Sample screenshot of SMARTVIEW is shown in Figure 2.
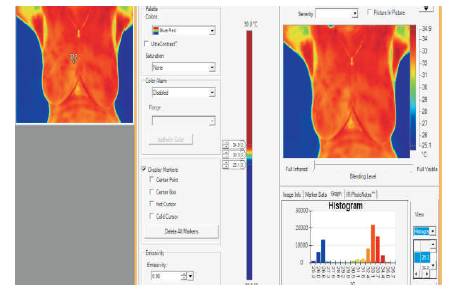
Figure 2. Screenshot of SMARTVIEW
Figure 3 shows the thermograms of volunteers with abnormal breast and with normal breast. The color bar present on the thermograms gives information about temperature distribution indicating the coolest part as blue and the warmest part as red as shown in the figure [9] . For abnormal cases, higher temperature is indicated by red color and the bilateral asymmetry can be seen.
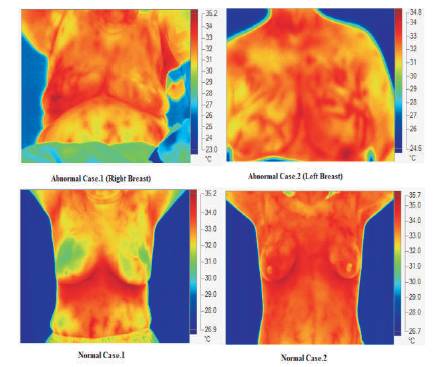
Figure 3. Sample Thermograms
The thermogram is further analyzed through software by selecting marker. The minimum, maximum, and average temperatures of the selected area is shown in Figure 4. It can be observed that, the left breast of volunteer is having more temperature as compared to the right breast. The average temperature difference of around 1˚C is observed for abnormal cases. This particular subject had undergone mammography and the lump was detected.
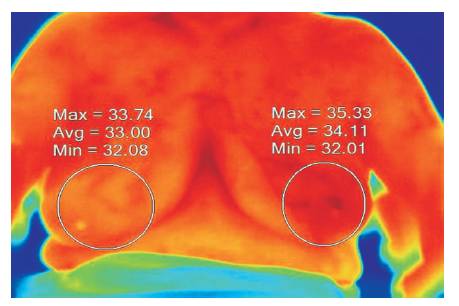
Figure 4. Difference in Average Temperature
Each thermal image is a two dimensional matrix of size 320 * 240, which is the representation of breast surface temperature. It has coordinates x and y and T(x,y) is the temperature of that pixel. The Hotspot detection algorithm consists of two parts: Body Boundary detection and extraction of highest temperature area in the thermogram. Then both the outputs are combined to create a single image which is easy to interpret [8] . The flowchart of the process is as shown in Figure 5.
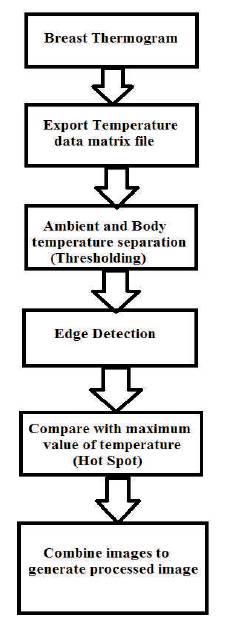
Figure 5. System Flowchart
The temperature file of the whole breast thermogram is exported as an excel file. This file is read in MATLAB which gives a matrix of 320 * 240 values. The minimum temperature Tmin value is found out indicating the ambient temperature. Any value less than Tmin is made zero and is shown as black. While values greater than Tmin are made 1, indicating the body surface temperature. Edge detector algorithm is then applied to this new matrix to detect body contour. Figures 6(a) and 6(b) show the output of Background and Edge detection.
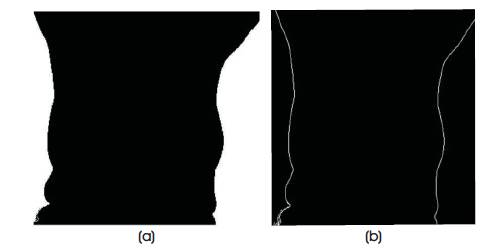
Figure 6. (a) Background Detection, (b) Edge Detection
To detect the hot spot, highest value of temperature Tmax is found out from the original temperature matrix. Again these values are compared with a threshold of (Tmax -1) °C. The threshold of 1°C is selected after analyzing the image through SMARTVIEW where we can see that the abnormal area is having a higher average temperature of around 1°C. Any value above the threshold is marked as 1 and values less than threshold makes zero. With this logic, areas of highest temperature is extracted. Finally, the output matrices generated by body boundar y identification algorithm and highest temperature area extraction algorithm are combined together to generate a processed image. Figures 7 (a) and 7 (b) show the output of hotspot detection and final combined image, respectively. The processed image is easy to interpret and understand.
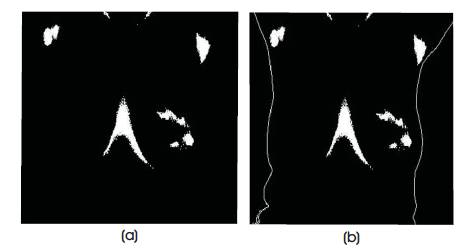
Figure 7. (a) Hotspot Detection, (b) Final Output
The breast thermograms are segmented in Left and Right breast manually using crop function in SMARTVIEW which generates the temperature data of segmented region. Asymmetry analysis is then performed using different statistical parameters. The experimental results show that there is a significant difference in these parameters for healthy and sick subjects and thus they can be used for detection of breast abnormality. Figure 8 shows the process of segmentation.
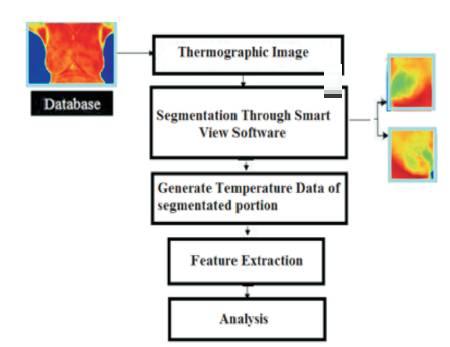
Figure 8. Process of Segmentation
Feature Extraction is performed on segmented thermograms which includes a comprehensive set of features like Skewness, Kurtosis, Median, Variance, Standard Deviation, and Mean to completely study the nature of temperature distribution in Region of Interest (ROI).
The results are treated as 'Normal' case if the Hotspot does not appear in any of the breasts or it is present in both the breasts symmetrically. If the Hotspot is present in areas like armpit, neck, and inframammary folds where the temperature is naturally expected to be more, then also it is considered as 'Normal'. The thermogram is considered as 'Abnormal' if the hotspot appears only in any one of the breast parts.
Highest temperature area appears only in left part of the breast and not in right part of the breast as shown in Figures 9 (a) and (b). The other hotspots present at neck, armpit and centre of breast are to be ignored since the temperature of these areas is naturally high. In both thermograms, highest temperature area appears only in any one of the breasts, which is a sign of asymmetry, and thus treated as abnormal cases.
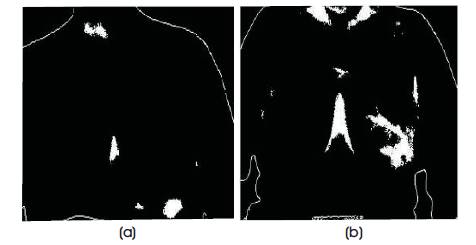
Figure 9. (a) Abnormal Case 1, (b) Abnormal Case 2
Highest temperature area appears below left and right parts of the breast, because of folds across the breast as shown in Figure 10 (a) and (b). No hotspot is present in the breast area. Symmetry exists in appearance of highest temperature area of both left and right parts of the breast, which implies that these are normal case thermograms.
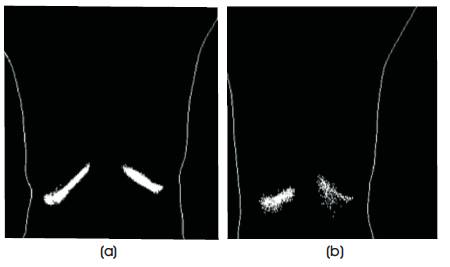
Figure 10. (a) Normal Case 1, (b) Normal Case 2
Feature Analysis is based on Histogram Generation. Figure 11 (a) shows the histogram of Normal Case. It shows that the thermal distribution of ROI for Normal Case is almost symmetrical in both the breasts as compared to the distribution of ROI for Abnormal Case which is distinctly asymmetrical in Left and Right breasts as shown in Figure 11 (b).
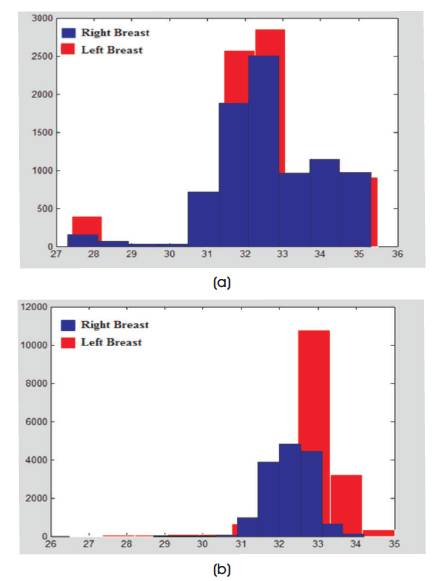
Figure 11. (a) Histogram of Normal Case, (b) Histogram of Abnormal Case
The statistical parameter values vary between contralateral breasts in case of abnormality and is nearly same for symmetric cases. A graphical representation of the parameters is plotted for more precise presentation of the evaluated parameters and for showcasing the symmetry between the contralateral breasts. The horizontal axis of the graphs represent the different statistical parameters, whereas the vertical axis represents its values. Figure 12 (a) shows the graph of the first three parameters i.e. Skewness, Kurtosis, and Median. Figures 12 (b) shows the graph of the remaining three parameters i.e. Variance, Std. Deviation, and Mean. Figures 12 (a) and (b) show the graphs of parameters for normal thermograms.
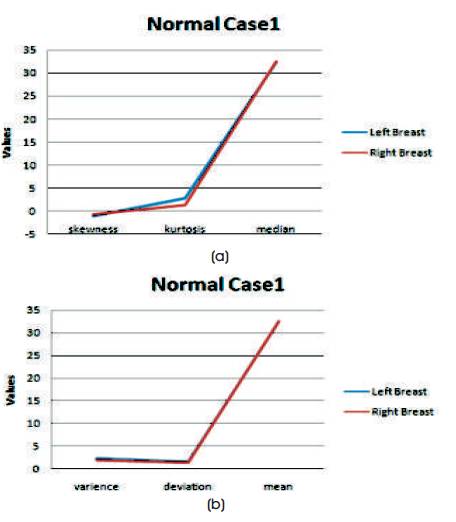
Figure 12. Statistical Parameters Representation for Healthy Case (a) Skewness, Kurtosis, and Median Parameters, (b) Variance, Std. Deviation, and Mean Parameters
Thus, almost no deviation in the values of the contralateral breasts is clearly observed from the graph. Figure 13 (a) and (b) presents the graphs for abnormal case.
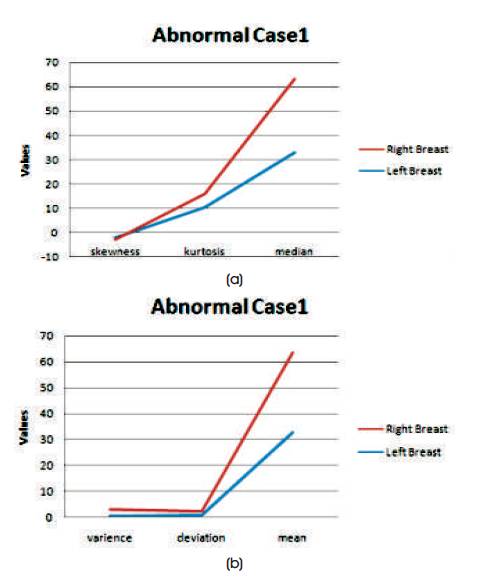
Figure 13. Statistical Parameters Representation for Sick Case (a) Skewness, Kurtosis and Median Parameters (b) Variance, Std. Deviation and Mean Parameters
Thus, the deviation in the values of the contralateral breasts is clearly observed from the graph.
This work presents an approach which deals with analysis of breast thermograms based on hotspot identification for abnormality detection. Experimental results of Hotspot detection show that the proposed approach is able to accurately detect the location and shape of the hot region in the thermogram. The presence of such hotspot is an indication of lump and needs further follow-up. Asymmetry analysis based on statistical features support the abnormality detection. The results are validated by a doctor's diagnosis and are cross checked by camera software where individual pixel temperatures can be monitored. It is difficult to identify deep tumors since they don't show remarkable skin temperature difference in image. To improve decision making in all such type of cases, more data points are necessary for drawing relevant conclusions.
The author would like to thank Dr. Shekhar Kulkarni for his valuable guidance and support during image acquisition.