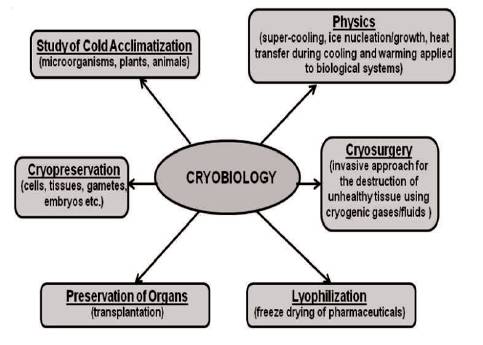
Figure 1. Major Areas of Cryobiology
Cryobiology sets at the interface of physics and biology. In cryobiology, low temperature represents temperature below normal. The living things include human hypothermia and natural hibernation. Cryoprotectants are used to protect cells or whole tissues from freezing damage. 60% glycerol-water is used as one of the cryoprotectants. Glass transition temperature is one of the essential parameters of fundamental importance for cryopreservation by vitrification. In this present paper, glass transition temperature of 60% glycerol-water was determined using molecular dynamic simulation with density variation and cell volume variation. It was found to be 168 K and 166 K using density variation and cell volume approach, respectively. Further results were compared with available experimental results obtained by Differential Scanning Calorimetry (DSC) and Dynamic Mechanical Analyzer (DMA). Molecular dynamic simulation was slightly over predicted glass transition temperature for 60% glycerol-water cryoprotectant with maximum error of 2.7% as compared with available experimental results which are well acceptable.
Study of effects of low temperatures on living things is termed as cryobiology, which is one of the branches of biology. Cryobiology has major six areas as shown in Figure 1(Paul and Geoffrey, 2009). In cryopreservation, cells or whole tissues are preserved at sub-zero temperature (typically at 77 K) at which any biological activities including biochemical reactions is effectively stopped. There are possibilities to damage the cells due to cooling or thawing process in cryopreservation. The damage mainly occurs during freezing stages which have solution effects, extracellular ice formation, dehydration, and intracellular ice formation (Paul and Geoffrey, 2009). Some organisms and plant seeds survive desiccation with residual water bound in a glassy state (Crowe, Carpenter, and Crowe, 1998).
Figure 1. Major Areas of Cryobiology
Vitrification (flash freezing) is one of the main techniques to prevent cr yopreser vation damages, where cryoprotectant solutions are used. In this, a liquid starts behaving as a solid during cooling without any considerable change in molecular array or thermodynamic state variables(Angell, et al., 2000). Vitrification has been successfully used for cryopreservation of various types of cells, tissues and organs (Rall and Fahy, 1975; Fahy, et al., 1988).
Typically, in vitrification, cryoprotectants are added prior to cooling. Cryoprotectant decreases the freezing temperature and also increases the viscosity. The solution turns into an amorphous ice which signify vitrifies instead of crystallizing. The amorphous state is like a solid-liquid and this transformation is generally for a small temperature range called Glass Transition temperature (TG) (Alcor, 2000). It is imperative to know the glass transition temperature for vitrification solutions as TG is one of the essential parameters of fundamental importance for cryopreservation by vitrification (Li, et al., 2008).
The glass transition temperature can be determined theoretically and experimentally(Angell and Sichina, 1976; Strillinger, 1995). The glass transition temperature can be determined experimentally by Differential Scanning Calorimeter (DSC) (Grunina, et al., 2006). In DSC, TG can be determined by an abrupt change of heat flow in the DSC thermogram(Jochem and Korber, 1987). To predict the glass transition temperature, molecular simulation has also been used (Abu-Sharkh, 2001; Gumen, et al., 2001). The various thermodynamic parameters such as heat capacity, specific volume, etc., change regularly with respect to temperature and reveal a discontinuity for change of equilibrium phase. Further, when these parameters are plotted with respect to temperature, an abrupt change can be observed at the glass transition temperature (Li, et al., 2008).
As per available literature, only one paper is available on the prediction of glass transition temperature for cryoprotectants by Molecular Dynamic Simulation (MDS) method (Li, et al., 2008). Hence, it was thought desirable to carry out the molecular dynamic simulation with objective to determine the glass transition temperature of cryoprotectant. A popular cryoprotectant 60% glycerolwater was considered for study.
MDS is the computer simulation of physical movements of atoms and molecules. In this, the atoms and molecules are allowed to interact to know the motion of the atoms for a period of time. In general, Newton's equations of motion are solved numerically to determine the trajectories of molecules and atoms for a system of interacting particles. Here, molecular mechanics force fields are used to define the forces between the particles and potential energy. MDS results provide macroscopic thermodynamic properties of the system. MDS is iterative by calculating forces and solving the equations of motion based on the accelerations obtained from the new forces alternatively. Wide application of MDS in other areas such as Rheology, Nanotechnology, Biomolecular system, Membrane biophysics, etc., can be found in the literature (Jabbarzadeh and Tanner, 2006; Trzesniak and Gunsteren, 2006; Park and Beckman, 2004; Loura and Ramalho, 2011).
Differential Scanning Calorimetry (DSC) measures the temperatures and heat flows associated with transitions in materials as a function of time and temperature in a controlled atmosphere. In Thermo Mechanical Analysis (TMA), a dilatometer is used to determine the linear thermal expansion of a solid as a function of temperature. In dielectric analysis, the sample is subjected to a constant electric field and the current which flows through the sample is measured as a function of temperature. Dynamic Mechanical Analysis (DMA) gives viscoelastic behaviour of materials.
The glass transition temperatures for glycerol-water mixture (60% glycerol by weight), a cryoprotectants has been measured by DSC as in the range 163.6 K - 167.1 K and by DMA as 159.00 K(Li, et al., 2008).
The general MDS methodology adopted for the determination of glass transition temperature is presented in Figure 2 (Katkov and Levine, 2004). As a first step, amorphous structure of the compound is generated at high temperature. The initial stricter is annealed by high temperature Gibbs dynamics for growing time obtained as equilibrated structure. The temperature is decreased by small amount and re-equilibrates using Gibbs dynamics for an equilibrium time which is sufficient to reequilibrate the structure to the new temperature. The properties are measured at this temperature. Previous step is continued until a sufficiently low temperature is reached. The various state properties of the equilibrated structure at each temperature are recorded.
Plot of different state properties against temperature are drawn and a bend in the plot (change in the slope) gives the glass transition temperature (Katkov and Levine, 2004). Free version of the MDS software was used for the simulation. 60% glycerol-water mixture was considered for study. For as 60 weight % glycerol-water mixture, the amorphous cell consisted of 100 glycerol molecules and 341 water molecules and contained total 2423 atoms. The temperature range for molecular simulation was set from 140 K to 200 K. The structure of individual molecule and amorphous cells developed for each of the cryoprotectant solutions are shown in Figure 3.
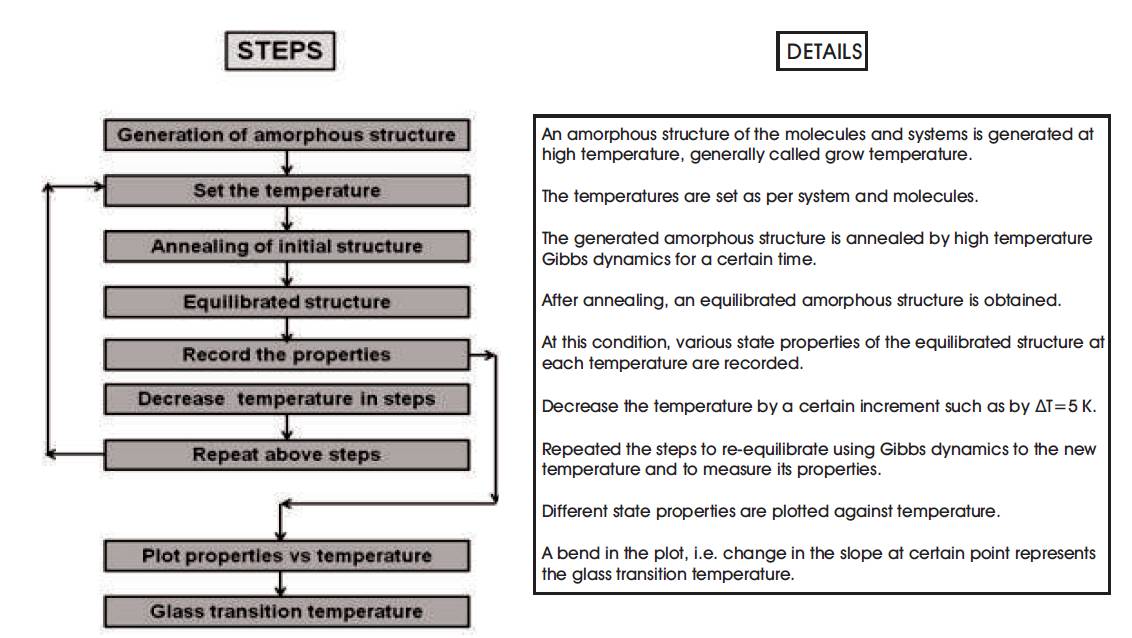
Figure 2. The MDS Methodology adopted for the Determination of Glass Transition Temperature
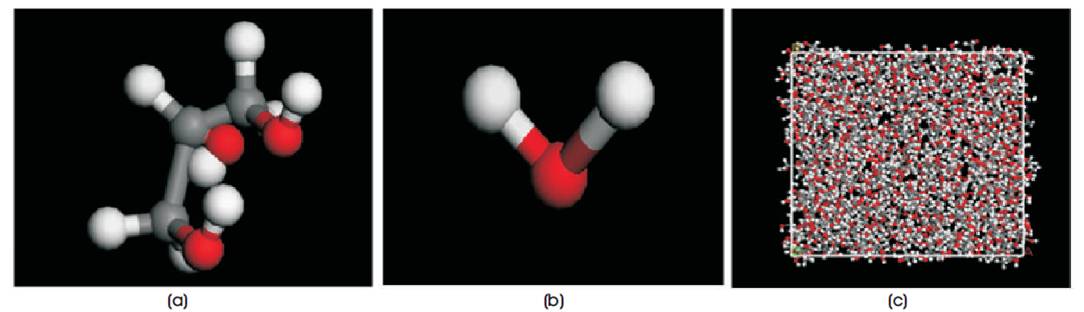
Figure 3. The Structure of Individual Molecule and Amorphous Cells Developed for each of the Cryoprotectant Solutions, (a) Glycerol molecule, (b) Water molecule, (c) Amorphous cell consisting of glycerol–water molecules, (Red-Oxygen atom, Grey-Carbon atom, White-Hydrogen atom, Blue-Nitrogen atom)
To determine the glass transition temperature of 60% weight glycerol-water mixture, MDS simulations were carried out using cell volume and density approach for the temperature range of 140 K to 200 K. The simulation results were equilibrated for amorphous cell structure at various temperatures.
The variation of density of 60% glycerol-water solution with respect to temperature is shown in Figure 4. The slope of the upper line is -5.99 x 10⁻⁴ gcm-3 K-1(R2 = 0.962) and of lower line is -8 x 10⁻⁴ gcm-3 K-1 (R2 = 0.969). The temperature of 168 K is at the intersection of the two curves which is taken as glass transition temperature.
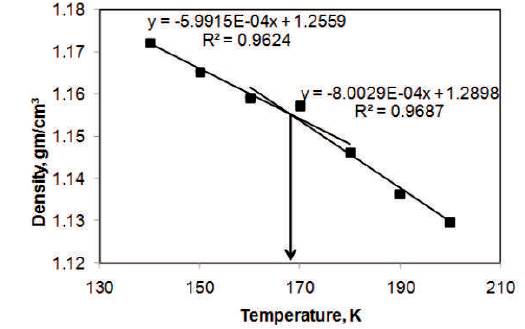
Figure 4. The Variation of Density of 60% Glycerol- Water Solution with respect to Temperature using MDS
Cell volume (specific volume) is also used to determine the value of TG (Abu-Sharkh, 2001; Kurt, et al., 2003; Karl, et al., 2005; Dimitrov, 2006; Li, et al., 2008). The variation of cell volume for various temperatures is presented in Figure 5. The slope of the line changes from 20.2 A3 K-1 to 31.9 A3 K-1 . The intersection is at 166 K, which is 2 K lower than that obtained by density analysis.
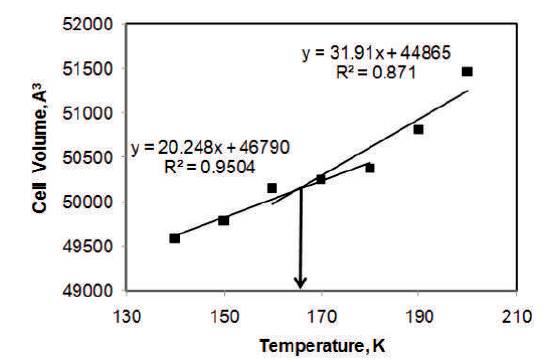
Figure 5. The Variation of Cell Volume of 60% Glycerol-Water Solution with respect to Temperature using MDS
The MDS results of glass transition temperature of glycerol – water mixture (60%, wt%) was compared with available experimental results obtained by DSC, DMA, and DEA(Li, et al., 2008) for the validation of MDS results. Table 1 shows the experimental and MDS values of glass transition temperature of various cryoprotectants such as 60% glycerol in water, 60% ethylene glycol in water, and 3- amino-1-propanol. The MDS results were very well agreed with experimental results within the error of 0.5-5%, which is acceptable.
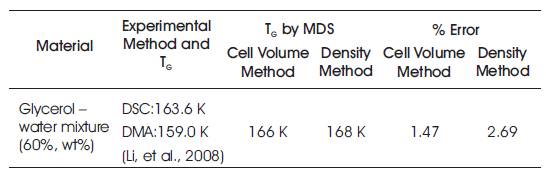
Table 1. Error in TG Values determined by MDS
The slight variation in the results obtained from density variation and cell volume variation may be due to the simulation time chosen for each simulation run. This means the possibility of the amorphous cell not reaching proper equilibration during the annealing procedure. As the annealing cycles increase, simulations move closer towards ideal equilibration. In turn, the accuracy of the results obtained increases.
In present study, glass transition temperature of cryoprotectant: glycerol – water mixture (60%, wt%) was determined by Molecular Dynamics Simulations (MDS). The MDS results were compared with available experimental results obtained by DSC, DMA, and DEA. The MDS results are in good agreement with experimental results and within the error of 0.5-5%, which indicates a good level of accuracy. Thus MDS is a highly accurate and efficient method to calculate glass transition temperatures of pure substances and binary mixtures. MDS method can be applied to calculate the T of G realistic complex vitrification solutions if the types and concentration of the components in the solution are known.