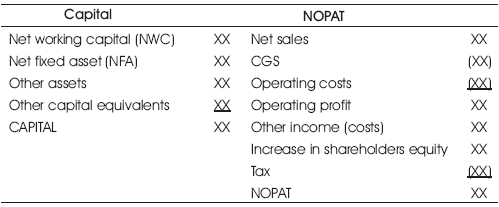
Table 1. Calculation of Capital and NOPAT (Operating Viewpoint)
The basic goal of a business unit is mainly value creation and shareholders wealth maximisation and attracting more investment. The success of every company as well as management is measured by the level of value creation of shareholders. Economic value added is basically a performance measurement tools which is related to the market value of the firm. EVA helps the businesses to calculate the actual profit once the capital and taxes are considered. A greater EVA is an indication of greater value. This tool helps to measure the ability of a business unit to create return based on certain risk. In this paper interrelationship between Return On Capital Employed (ROCE), NOPAT (Net Operating After Tax) and EVA as a percentage of capital employed is examined to find best measure of performance. The time period is taken from March 2003 to March 2012. Mathematical analysis is done and represented graphically. It was concluded that EVA is a better measurement tool of value creation for shareholders.
A measure of a company's financial performance is based on the residual wealth calculated by deducting cost of capital from its operating profit (adjusted for taxes on a cash basis). EVA, Economic Value Added is a measure of financial performance of a company where we derive the actual economic value of the firm rather than value reported and established based on GAAP. Economic Value is different from the value calculated from accounting numbers. EVA reflects the true economic profit of the firm and shareholder's value. It reflects the economic situation of the firm. In EVA calculation we consider all the costs of capital; both cost of debt and cost of equity unlike in GAAP where cost of equity is ignored in calculating Net Profit. In EVA calculation, we subtract the cost of Equity from NOPAT (Net Operating Cost of Capital).
EVA is undoubtedly a superior performance measure tool of a firm when compared to the conventional techniques like calculating ratios, Earning Per Share and Earnings Growth, as in all these, the profit is considered ignoring the cost of Equity involved. The inclusion of overall cost of capital will help the analyst to determine whether and to what extent, Value is created. If there is an excess of returns over the cost of Capital, then Value is said to be created. In other words, the firm's revenue should be more than cost of equity and debt, in order to create wealth and it gives a measure of shareholder's wealth maximization.
For many years economists believed that a business organization must earn more than its cost of equity in order to keep and develop its operations. In the 20th century this concept obtained an operational status and came to be called Residual Income. General Motors applied this concept in the 1920s. In 1965 Solomon's proposed RI as an internal measure of performance evaluation for business organizations, and in (1973, 1982), R. Anthony proposed it as an external measure of performance evaluation (Biddle et all, 1999).
In 1920 General Motors applied the concept of RI (residual income). Many economists are of the view that return should be more than the cost of equity so as to maintain operational efficiency. Economic Value Added is a type of Residual Income calculation which was developed and is owned as a trademark by the consultation firm of Stewart & Co. EVA calculation includes adjustments of cost of capital and adjustments are also made for accounting income to gain better accuracy of the economic effect of transaction and the economic value of assets and liabilities. Post 1990, the concept of residual income has gained popularity because of EVA.
Abate et.al. (2004) shows that firm value can be decomposed into EVA from current assets and EVA from future growth Opportunities However, it is difficult to directly measure EVA generated from future growth opportunities. This study uses the ratio of market value and book value of equity (ME/BE) to proxy for EVA from future growth opportunities when analyzing stock valuations. Considering the issue that the economic value added is calculated using information produced from conventional historical cost accounts, inflation can distort information content and applications of the performance measurement criteria. Inflation can distort economic value added through three factors, i.e., the operating profit, the cost of capital, and capital base. These distortions potentially result in inefficient investment and compensation outcomes (Warr, 2005). Despite all the virtues of EVA's superiority, there are arguments against it too. Villiers (1997) argued that EVA is not effective under inflation, as the concept cannot be used to estimate actual productivity. Villiers further states that the problem with EVA is, it is calculated based on accounting profit, that a discrepancy exists between accounting profit and true profit and that this disaggregation is exacerbated by inflation.
Stewart (1991) comes up with the book “The Quest for Value” in which EVA is introduced as value based financial performance measure with its benefits. In order to support the concept Stewart (1994) asserts that EVA stands well out from the crowd as the single best measures of value creation on continuous basis and EVA is almost 50% better than accounting based measures in explaining changes in the shareholders wealth.” Stewart (1991) further advocates EVA saying that “the best practical periodic performance measure is EVA while earnings, earnings per share, and earnings growth are misleading measures of corporate performance.” Worthington & West argued that there is an obvious requirement to examine the usefulness of EVA over traditional measures over a longer period of time frame which would allow greater empirical certainty on EVA's status as a corporate performance measure.
EVA is performance measure tool which measures how much the company generates each year in excess of its costs. It is similar to the Net Present Value (NPV) concept. However while NPV is used for deciding whether a new project is worth entering into or , EVA, on the other hand, can be looked at as NPV applied to the entire company, instead of one project.
It is an age old cliché that “The role of the organizational mangers lies in maximizing the wealth of its shareholders.” In order to measure the wealth that the organization managers create for various stakeholders traditionally standard accounting magnitudes like Profits, Cash flows and financial ratios are used.
Amongst the profitability measures following are the main metrics:
Managers, shareholders and other stakeholders use this financial statement information to assess and predict current and future performance. ROA and ROE examine income in terms of either assets or equity; they probably come closest to measuring wealth creation. However, using these two ratios to measure wealth can be misleading, because unrealized capital gains are excluded from the calculation. In addition, the ROA and ROE calculations give a percentage as the answer, thus neither of these ratios indicates if a cooperative has created wealth during the course of a year.
EVA is an estimate of the amount by which earnings exceed or fall short of the required minimum rate of return that shareholder and debt holders could get by investing in other securities of comparable risk. The formula is as follows:
EVA = Adjusted NOPAT – (cost of capital X capital employed) (1)
or
EVA = (Rate of return - cost of capital) X capital employed (2)
Where;
Rate of Return = NOPAT/ Capital Employed
The definition of EVA highlights the three basic inputs needed for its computation — the return on capital earned on investments, the cost of capital for those investments and the capital employed in them. Calculation of NOPAT is very critical while calculating EVA. There are many adjustments that are needed to be done while calculating NOPAT. Overall Cost of Capital is calculated while considering the weight of both equity and debt in the capital structure. Calculation of NOPAT is explained in Table 1.
Table 1. Calculation of Capital and NOPAT (Operating Viewpoint)
NWC = Current asset – (Current liability – interest bearing liabilities)
Interest bearing liabilities = Short term facilities from banks – sales receivable)
NFA = book value of Fixed income – Accumulated Depression (AD)
Last step is elimination of accounting deviations. Account deviations are removed by adding back the equity equivalent to capital and periodical changes to NOPAT. Referring to the above mentioned steps, the calculation of cost of equity capital, based on financial perspective, is summarized as follow:
Calculation of capital and NOPAT is explained from financing viewpoint in Table 2.
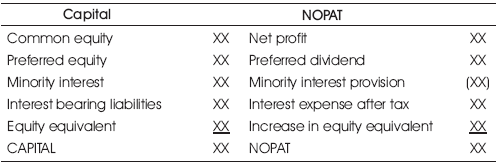
Table 2. Calculation of Capital and NOPAT (Financing Viewpoint)
Each firm has its own risks and rates of return. Each group of investors, like holders of bonds, and preferred and common stock, seek a return proportional to risk taken. Cost of capital is the lowest rate of return a firm must obtain in order to secure its investors' return (Neveu, 1986).
Cost of capital is significant from various aspects, including its applicability in making optimal capital structure decisions, and its use in debt and performance measures and in discounting future cash flows in valuation. Furthermore, ignorance of the cost of equity capital in calculation of net profit justifies the necessity of focusing on this subject.
Cost of capital includes components of capital that construct the sum of the capital structure. The main components of capital structure are debit, preferred stock, common stock and retain earnings. Since each holder of the mentioned financial resources has its own expectation for rate of return, the cost of acquiring each item is different. Further, due to their varied nature, the calculation method for their cost of capital is varied. In order to determine a firm's cost of capital; it is necessary to calculate the cost of every component of capital separately and based on their proportion in capital structure. : (Neveu, 1986). Thus the average cost of capital is computed as follows:
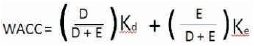
where:
D is the total debt
E is the total shareholder's equity
Ke is the cost of equity
Kd is the cost of debt
Cash flow statements indicate cash inflows and cash outflows during a given time period. When used with other financial statements, this information helps investors, creditors and others to determine the credit rating of a firm. For example, cash resulting from the issuing of bonds shows whether a firm is not only liable to pay its interest rate, but also whether it must pay the deposit at particular due date. Therefore, the cash flow statement is useful in analyzing the past and future rate of return of a firm, and its ability to pay back its debts (Warren. et al. 2004).
With a view of showing the application of the concept of EVA, the author decided to calculate and analyze the EVA of Maruti Suzuki India Limited. The author deliberately chose a company that does not disclosed its EVA in its financial statements. In short, following are the main objectives of doing this exercise.
The study is based on secondary data and covers a period of ten years ranging from 2002-2003 to 2011-2012. Data regarding EVA Statement as reported by the company has been collected from the annual reports of Maruti Udyog Limited and Maruti Suzuki India Limited for the respective years. On 17th September 2007, Maruti Udyog Limited was renamed as Maruti Suzuki India Limited. Maruti Suzuki India Limited is the market leader in India.
The trend of EVA figures of Maruti Suzuki India Limited Clearly shows that the company has not been able to generate enough wealth for shareholders. When we compare ROCE with EVA, EVA as percentage of Capital Employed is less than the Return on Capital Employed for all the 10 Years. Thus the ROCE does not give the actual picture of the value created for its shareholders and EVA thus acts as a superior tool of measurement.
The EVA trend of Maruti Suzuki India Limited is fluctuating. As seen in the study, EVA for year ending March 2012 has fallen in comparison to last two financial years. EVA when compared with Return on Capital Employed shows that the wealth created for shareholders is much less in case of EVA. The study reveals the computation of returns using EVA is much lower than the Return on capital employed. These findings are in conformity with the findings of EVA proponents like Biddle, Bowan and Wallace (1997), and Chen and Dodd (1997) and Mamun, Abdullah Al; Mansor and Shazali Abu (2012) who insist upon the superior information given by the EVA figures when compared with the traditional accounting measures. So, it can be concluded that traditional parameters have shown a quite rosy and positive picture of the company's performance in almost all the years as compared with EVA yet; they seem to have failed in reflecting the true financial performance of the company. The Figure 1 clearly states the difference in return using ROCE and EVA. The return when calculated using EVA is much lower than the Return on capital employed. Calculation of EVA from the year 2003-2012 is explained in Table 3. EVA is calculated by subtracting the product of CE and WACC from NOPAT [NOPAT – (CE *WACC)]. Table 4 explains the relationship between EVA and ROCE and comparative figures representing the Return on Capital Employed vs. EVA as a percentage of Capital Employed.
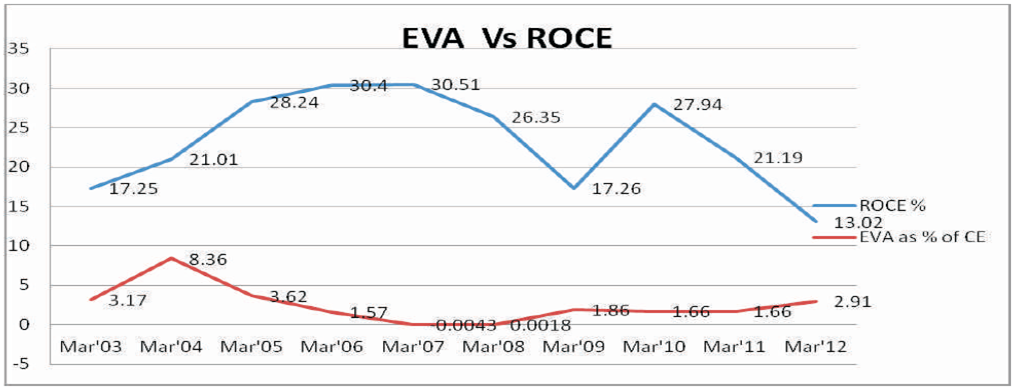
Figure 1. EVA vs ROCE
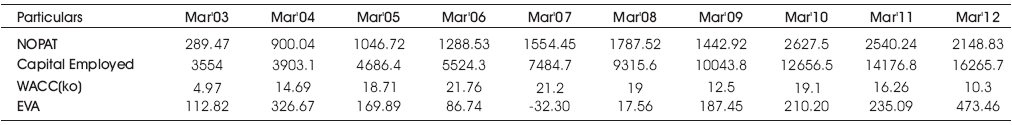
Table 3. Calculation of EVA
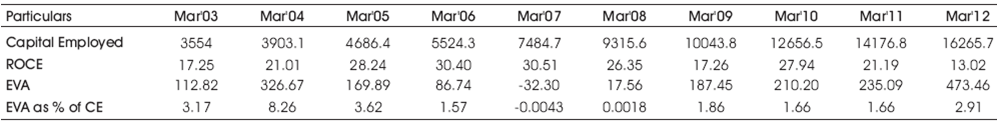
Table 4. Return on Capital Employed vs. EVA as a percentage of Capital Employed
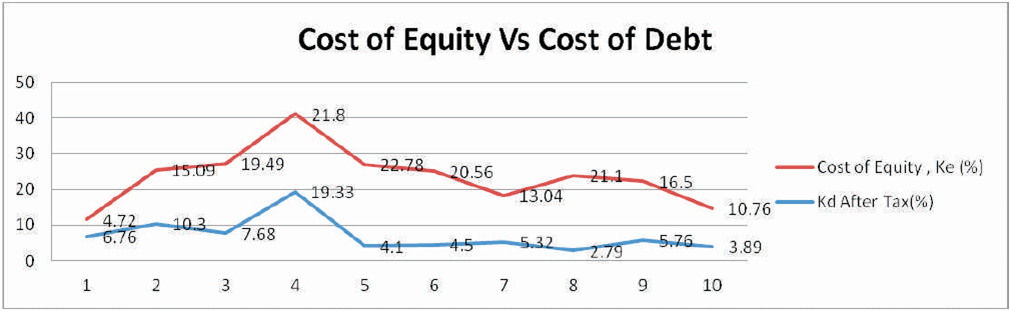
Figure 2. Cost of Equity Vs Cost of Debt
Cost of equity Vs Cost of Debt is graphically shown in Figure 2. Calculation of NOPAT of each year from Mar'03 to Mar'12 is calculated and tabulated in Table 5. NOPAT is calculated by multiplying Operating Profit with (1-t). Table 6 shows the Cost of Equity (Ke) which is calculated by dividing Profit Available for Equity Share Holders by the Equity Fund. Table 7 shows the Cost of Debt, Kd is calculated by dividing debt Interest by Total Debt. Then, Kd after Tax is calculated by multiplying Kd (found in first case) with (1 minus tax rate) which is used for further calculations. Table 8 shows the Total Capital Employed is found out by subtracting Current Liabilities from Total Assets. Table 9 shows the WACC (Weighted Average Cost of Capital) is calculated by adding the products of Kd & Weight of Debt and Ke and Weight of Equity fund.
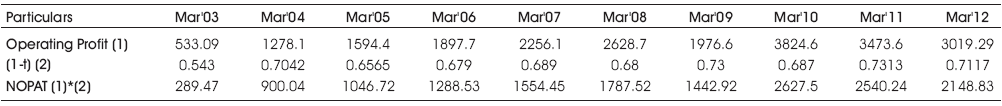
Table 5. Calculation of NOPAT
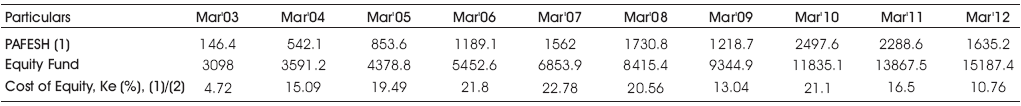
Table 6. Calculation of Ke
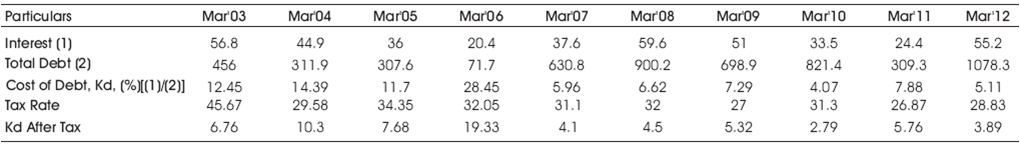
Table 7. Calculation of Kd
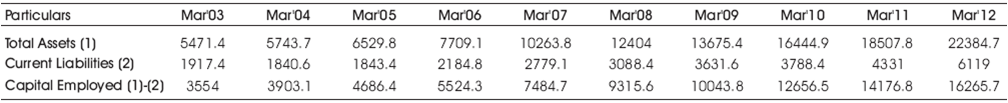
Table 8. Total Capital Employed is found out
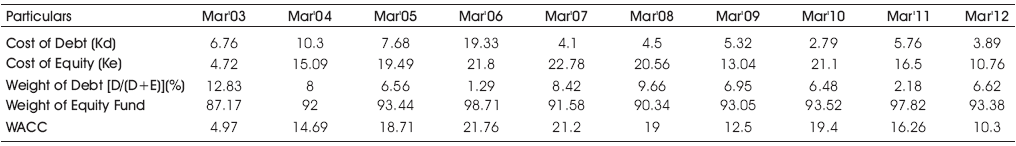
Table 9. WACC (Weighted Average Cost of Capital) is calculated
It can be concluded that EVA certainly has some edge over the conventional performance management and control tools. In fact it is not just the tool for management control but can play significant role in strategic level planning for an organization. However it is not a magic pill for higher productivity and higher performance, because of the fact that, its success in achieving promising objectives, depends mostly on the effective execution and adaptation for a specific organization. In the current global financial Scenario, EVA can be looked as an universally adoptable major tool of Value analysis for a firm, over the conventional methods as it reflects the true economic value of the firm and some global giants like Coca Cola, Quaker Oats have already adopted this tool and it is also being increasingly used in Western countries.