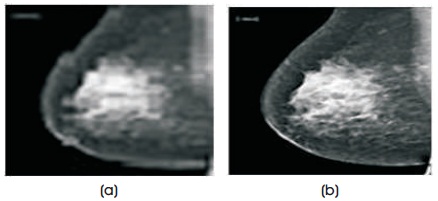
Figure 1. (a) Original Unfiltered Image (b) Noise Removed Image after Filtering
The breast cancer is absolutely life intimidating and dreadful disease. The primary screening of breast tumor is still under research because of some risk features, such as gene, taking birth control pills, smoking, obesity, and age are playing vital role spreading the cancers. The malignant tumors induct into the breast cells and eventually this tumor extends to the surrounding tissues. The proposed technique consists of four steps. Step 1 is for digitized noises removal, step 2 is for suppression of radio opaque artifacts, step 3 is for Pectoral Muscle removal, and step 4 is for detecting location of cancer on breast for emphasizing the region of breast profile. To reveal the capability of this technique, two separate digital mammograms are tested using GT (Ground Truth) mammograms for assessment of performance characteristics. The Experimental results indicate that the breast cancer regions are extracted truthfully in compliance to respective Ground Truth Images.
Mammography consisting of cancer masses is processed by Computer Aided Design (CAD) systems. However, a CAD system magnificently adopted in medical training will principally depend on the segmentation techniques or set of rules used. In the breast image examination, segmentation is well-defined as the method of allowing the precise shape or margins or of the organ and the potential lesions in the breast image to be determined. A tumor in the mammogram extending from medium grey value to white shades is a pathology that resides in an assured area of the image and this smallest area visible is approximately 0.5 cm diameter in mammograms. Depending on the nature and the shape of its boundaries, the major features represent whether the tumor is malignant or benign (Breast Cancer India, n.d.). Benign tumors are in regular shapes like spherical oval, principally with sleek margins and uniform texture, circumscribed well against the encircling tissue and malignant tumors are seemingly to be of irregular shapes and with fuzzy margins or spicules growing into the encircling tissue. Digital mammograms with cancerous tumors are of various shapes and appearances which often contain sturdy noise and therefore the margins between are fuzzy and troublesome to mark. This shows that the segmentation of the lesions is essential and principally very troublesome task.
Classifying breast images into many distinct regions by breast image segmentation includes the border of the breast image (Kass, Wttkin, & Terzopoulous, 1988), the nipple (Clarke et al., 1994) and the pectoral. Adequacy of the breast images are studied using (Detounis, 2004), mammogram-pair registration and comparison (Bernstein, 2018). For calcification and lesion detection, square measures are created with the sting of the pectoral (Ferrari, Rangayyan, Desautels, Borges, & Frere, 2004). The predominant dense regions in most mediolateral oblique views upsets the outcome of image process (Makandar & Karibasappa, 2010) and targets the threshold (Gudmundsson, El-Kwae, & Kabuka, 1998), gradients (Eklund, Cardenosa, & Parsons, 1994), and modeling of the opposite than in the breast province of X ray image employing a polynomial (Gudmundsson, El- Kwae, & Kabuka, 1998). Earlier approaches for segmenting the form of the breast was discussed in (Jyothi & Gayathri, 2014), and mentioned using a spatial filter and Sobel edge detector to find the boundary of the breast on captured mammograms. Recent efforts (Raju, Harikiran, & Priya, 2012) inform that the native thresholding have shown more brilliant results. In (Cherukuri, Raju, & Vherukuri, 2010) uses a system of masking pictures with completely different thresholds to seek the breast edge and delineated a motivating algorithmic program (Reddy, Reddy, Raju, & Madhu, 2010). It supported the idea that the suggestion of intensity values from the image of the breast area to the background may be a monotonically decreasing. The algorithm first searches for the secondary boundary from the initial boundary by employing a clustered image. For every initial boundary a corresponding purpose is calculable using nursing extrapolation methodology. Through a refinement method, a contour springs from the figure, and by linking all the boundary points, the breast contour is outlined. McLaughlin and Bones conjointly made numerous attempts to use active contours (Padmaja, Madhu, & Raju, 2010). They estimated a method for the separation of the background and breast region employing a typical threshold. Pixels below this threshold are accustomed get a model of the background of the X-ray images picture by using Poisson approximation. The edge found by the Poisson model is employed to make a binary mask from the initial contour and designed the greedy snake algorithm. A semi-automated methodology supported the conception of united bends represented in (Nayak, Ghosh, & Ari, 2013). The interactive boundary outline procedure was referred to get the snake algorithm. The unified snake compactly unifies the foremost important snake variants, permitting the user to decide on the foremost acceptable snake variables. The algorithm is tested on mammograms from databases of the real patients to have the edge contour of the “basic snake” as outlined in (Bernstein, 2018).
Step 1. Digitization Noise Removal
The noises in most of the mammogram images are filtered by using Median Filter of 3 x 3. Each output pixel in the 3 x 3 community contains the intermediate value around the matching pixel in the input breast images. The edges of the images are replaced by zeros. Figure 1(a) shows the mammogram image with digitization noise and Figure 1(b) shows filtered image after removal of noise.
Figure 1. (a) Original Unfiltered Image (b) Noise Removed Image after Filtering
Step 2: Suppression of Artifacts in breast
The artifacts like segments and markers in the breast are removed with the following steps:
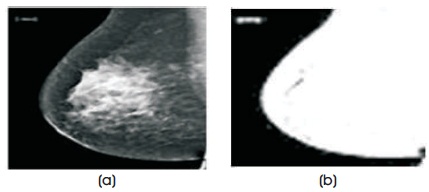
Figure 2. (a) Original Image (b) Thresholding Image
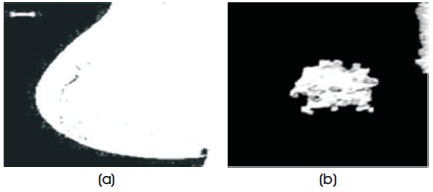
Figure 3. (a) Thresholded Image with Largest Selected Area (b) Profile of Lesion Extracted from the Background
Step 3: Pectoral Muscle Segmentation
The SRG rule is employed for striated muscle segmentation and is illustrated within the following steps:
Step 3.1. Before playing SRG, the breast profile orientation left or right discrimination, an automatic procedure in X-ray image is to be determined. The binary image is cropped left to right and prime to bottom, such that the profile of the breast touches all four borders of the image. Then the total of the primary and last 5 columns of the binary values within the cropped binary image is calculated. The profiles of the breast area unit classified employing easy if-else logic, such that, if 'sumfirct less than sumSact', then the breast is right orientated else it is left-orientated.
Step 3.2. On the breast-profile, images discrimination is done with the MATLAB 'imadjust' and 'stretchlim' functions. The 'stretchlim' operator finds limits to distinction stretch on image. The 'imadjust' operator is used to map the values in associate intensity image to newer values; the output limits from the 'stretchlim' operator on area unit used as associate input into the 'imadjust' operation. Figures 4 and 5 show the characteristic sweetening technique applied to the breast profile images.
Step 3.3: A seed has to be placed within the pectoral of the grayscale image to implement machine-driven SRG. If the profile of the breast orientation is right, a seed is placed within the right fifth column and fifth row of the Xray breast image, whereas if the profile of the breast orientated is left, a seed is placed within the last fifth column and fifth row.
Step 4: Detecting Location of Cancer on Breast
For finding Location of cancer on breast image first we have a tendency to take into account the form extracted breast image from step 2 and take into account the sole cancer, a part of the breast that is when obliteration of pectoral muscles in step 3. On the output image that is in Figure 6, apply morphological gap operation with disk formed structuring component. Typically this operator generates the boundaries of the image, cracks tapered Peninsulas and annihilates tinny Protrusions. By endeavor Dilation on scoured Image, gap operation is obtained. Usually, objects that are adjacent are spaced, objects that are adjoined are detached and also the holes among the objects are exaggerated by gap to smoothen the X-ray picture when locating half cancer on the breast.
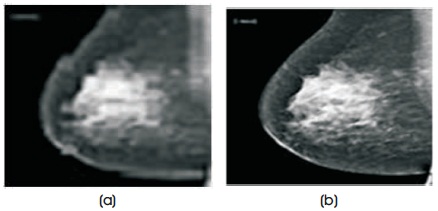
Figure 4. Contrast Enhancement of a Mammogram Image (a) Before Contrast Improved Original Image (b) After Contrast Improved Image
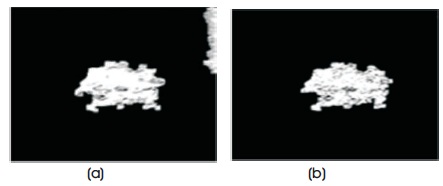
Figure 5. Pectoral Muscle Segmentation (a) Lesion with Pectoral Muscle (b) Lesion
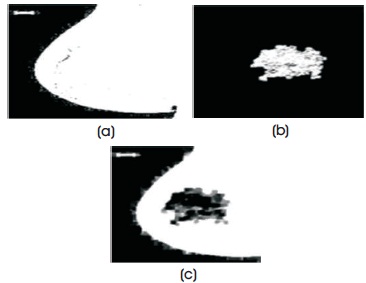
Figure 6. (a) Structure Image (b) Lesions (c) Lesion Located in Structure
After successful completion of detection, matching is applied by using certain technique to estimate accuracy. Table 1 shows the formulas of selected parameters. Figure 7 represents these parameters, such as a, b, c, d where “a” element counts the figure of “11”, “b” element counts the figure of “10”, “c” element counts the figure of “01”, and “d” elements counts the figure of “00”.
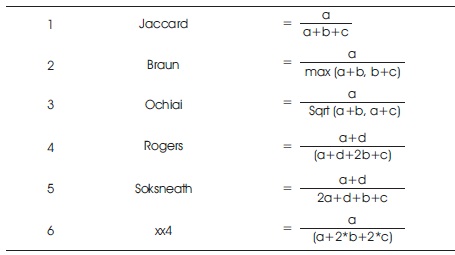
Table 1. Formulae of Parameters
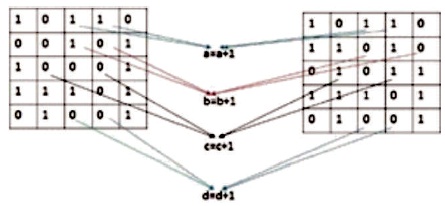
Figure 7. Relationship Diagram of Two Images
In this study, Digital mammogram X-Ray images were accomplished from a public dataset of the mini Mammogram Image Analysis Society (MIAS). This database contains 332 mammograms with 1024 x 1024 pixels. Each one of the pixels in the image is represented as an 8-bit word, where the images are in grayscale format with a pixel intensity of range [0, 255]. Here, they have used 102 cases, which was abnormality with benign or malignant. The images acquired are left oriented and right oriented with fatty, dense-glandular fatty-glandular breast images. As corresponding to standard muscles, in mammograms, lesions incline to be brighter and have higher contrast, which gives the statistical features and are useful in noticing suspicious lesions and structure of breast. Figure 8 and Table 2 show that the proposed method produced better results on speckle noise up to 92% of noise level. Figure 9 shows the fourth row and third column image contain pectoral muscle and fourth row, fifth column after pectoral muscle removal. Figure10 shows the speckle noise up to 92% is added and tested with proposed techniques and it shows that even more than 90% of noise the cancer parts are extracted clearly. The method showed good performance in detecting and in locating the cancer on the breast images.
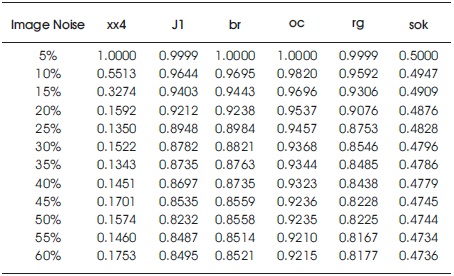
Table 2. With Speckle Noise
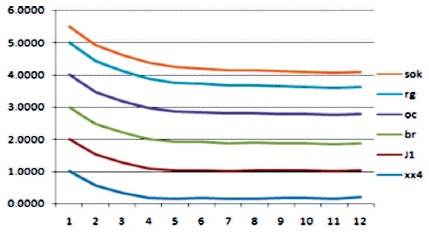
Figure 8. With Speckle Noise
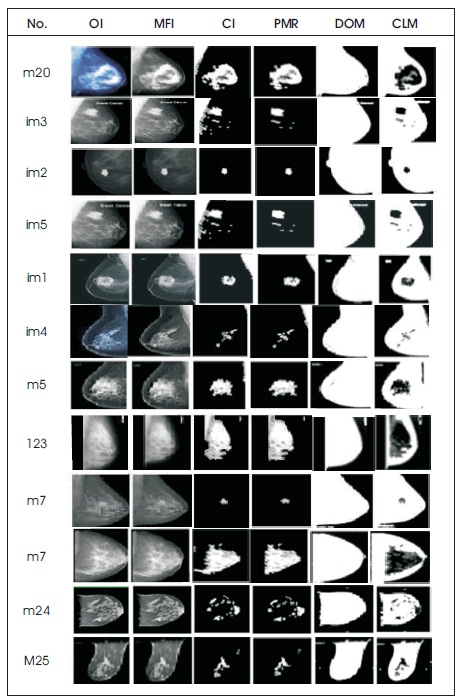
Figure 9. Images (a) Original (OI) (b) Medial Filter Image (MFI) (c) Contrast Image (CI) (d) Pectoral Muscle Removal (PMR) (e) Detection of Mammogram (DOM) (f) Cancer Located Mammogram (CLM)
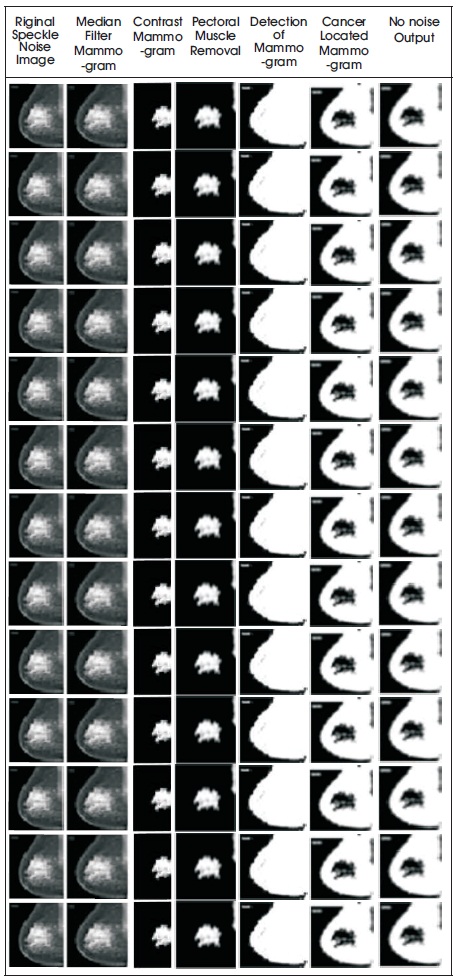
Figure 10. (a) Original Noise Image (b) Median Filter Mammogram (c) Contrast Mammogram (d) Removal of Pectoral Muscle e) Detection of Mammogram (f) Cancer Located Mammogram (g) No Noise Output
Cancer masses are identified by describing the technique that consists of 4-procedural steps and the key contributions of the work presented is fully automated segmentation algorithm, which is responsible for a breast contour represents breast profile region and second contribution is the algorithm performance evaluation on differing densities of mammogram images with high accuracy and thirdly a computer aided detection system using the result to identify the type of lesion or masses like benign or malignant its size and its precise location in the breast, which helps the radiologists to specify the diagnosis.