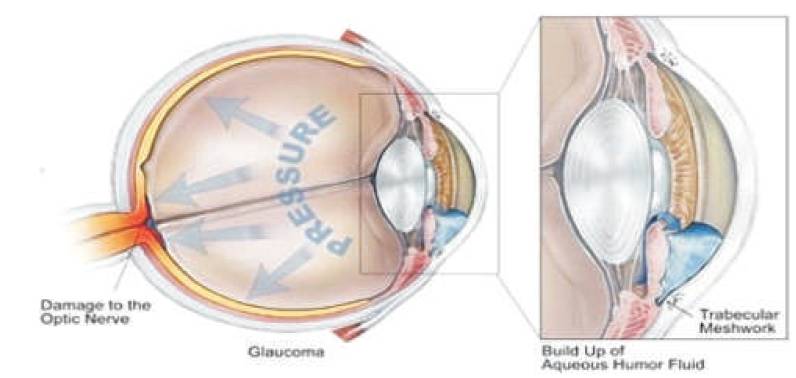
Figure 1. Normal Physiological Parts of the Eye Fundus
Glaucoma is the most common cause of blindness in India. Diagnosis of glaucoma is based on measurement of intraocular pressure by cup area to disc area ratio from the color fundus images. When this intraocular pressure (IOP) is increased in internal eye, vision starts to decline. So, detection of glaucoma is essential for minimizing the vision loss. An approach for detection of glaucoma using fundus images is developed. The Region of interest (ROI) based segmentation is used for the detection of disc. The optic cup and disc localization are used for detecting the region of interest, and Gabor filter is used for edge detection. A Semi automated method using CDR ratio in glaucoma detection of a fundus image has been proposed. The Cup to Disc Ration (CDR) is defined as the ratio of the area between Optic Cup and Optic Disk. Optic cup size increases while the Optic Disc size remains same for a patient in Glaucoma detection and the CDR will be high for a glaucoma patient when comparing with normal fundus image. In this paper the Cup to disc ratio calculation is discussed for detection and classification of glaucoma.
Glaucoma is a potentially blinding disease which affects 66.8 million people worldwide. Risk assessment of the disease goes a long way in diagnosis and management of the disease. The blood pressure of eye is known as intra ocular pressure (IOP) and if it increases to dangerous level, it affects the optic nerve axon as shown in Figure 1. Thus increase in IOP has a significant risk factor for developing glaucoma. This can result in decrease in vision and lead to blindness. In the early stage of Glaucoma, patients are unaware of the disease as no symptoms are shown until the advance stage of Glaucoma (Ho et al., 2011). Although the damage caused during the early stage is permanent, treatment of the disease can prevent its progression if detected earlier. No symptoms are shown until noticeable vision loss occurs. Glaucoma is also called as the “Silent Thief of Sight”. Therefore, detection of Glaucoma plays a vital role (Havagondi and Kumbhar, 2014). The surgery of the eyes for the Glaucoma treatment is done as a last option when other treatments such as eye drops and laser treatments become difficult to lower the eye pressure effectively to prevent further vision loss (Bock et al., 2010).
Figure 1. Normal Physiological Parts of the Eye Fundus
The increase in blood pressure happens when the passages that normally allow fluid in eyes to drain become clogged or blocked. Lowering of eye pressure is determined based on how severe the optic nerve is damaged. In general, normal eye pressure ranges from 8 to 21 millimeters mercury (mmHg). Ophthalmologists tend to start treatment if the pressure exceeds 30 mmHg. The ideal intraocular pressure level for most glaucoma patients is 14 mmHg or lower (Chandrika and Nirmala, 2013; Vision and Eye Health, 2010).
An optic nerve head assessment method is used for identification of glaucoma. Fundus images of the retina are color images of the eye taken by specially designed digital cameras. Optic nerve head assessment in retinal fundus images is more promising and superior (Kumar et al., 2016).
Although Glaucoma damage is irreversible, early detection and subsequent medical intervention by ophthalmologists is effective in slowing the progression of the disease (Aquino et al., 2010). The detection of optic cup and disc position is a pre-requisite for the computation of some important diagnostic indexes like glaucoma (Havagondi and Kumbhar, 2014; Wong et al., 2008). The diagnosis of Glaucoma can be done through the measurement of CDR, defined as the ratio of the vertical height of the optic cup to the vertical height of the optic disc as shown in Figure 2. The optic disc is the region on the retina at which optic nerve axon enters and leaves the eye (Havagondi and Kumbhar, 2014). The optic disc was located by identifying the area with the highest variation in intensity of adjacent pixels changes in the optic disc can indicate the current position and progression of a certain disease. The optic cup and disc location is an important issue in fundus image analysis (Ranjith et al., 2015).
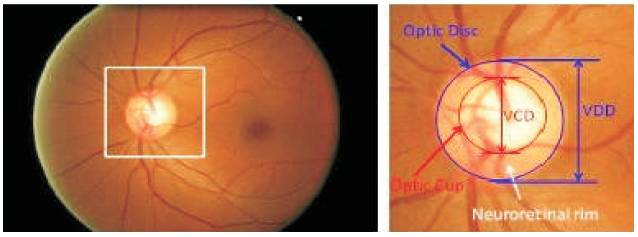
Figure 2. Optic Disc and Optic Cup Segmentation
In this study, an optimized solution for optic cup and disc segmentation necessary for the detection of Glaucoma was proposed (Minhas and Javed, 2009). In image processing, a Gabor filter, which is a linear filter is used for edge detection (Aqeel and Ganesan, 2011). The preprocessing step is also introduced to reduce bright spots that are likely to introduce errors in the ROI localization (Rangayyan et al., 2010). Next, the entire image is processed to locate the most likely location of the ROI. They used thresholding or binarization for optic cup segmentation process. After obtaining the disc and cup, various features can be computed, and the clinical convention is followed to compute the CDR (Narasimhan et al., 2012).
The proposed system mainly consists of following different stages:
The fundus images using the fundus camera was obtained, which is preferred to acquire the database of the images. The images acquired are color retinal fundus image. The images are stored in JPEG Image format file.
We can either apply basic filter techniques or use histogram equalization techniques for image processing. Adaptive histogram equalization (AHEM) is used to improve the contrast in image.
In this process we use the Sobel Operator for Edge detection. The Sobel operator extracts the edges, which is a necessary step to be done for Disc Extraction.
A Region of Interest (ROI) is a portion of an image that one wants to filter or perform some other operation on. An ROI is defined by creating a binary mask, which is a binary image that is the same size as the image to be processed. In the mask image, the pixels that define the ROI are set to 1 and all other pixels are set to 0.
Gabor filter, a linear filter is applied on the obtained ROI for proper acquisition of optic disc. It is used for feature extraction. It extracts out the proper disc area, which is required for the disc area calculation. Gabor filters use frequency and orientation representations for this purpose. The values of frequency and orientation are similar to that of the human visual system, which are specified to be appropriate for feature extraction.
Gabor filter is used for feature extraction. Gabor wavelets can be tuned for specific frequencies and orientations, which is useful for enhancement of blood vessels by which we get proper shape of optical disc.
Here erosion is used to remove extra pixels to the boundaries of objects in an image by using structuring element to reshape the obtained disc boundary and get proper disc shape.
Thresholding or binarization can be used for optic cup segmentation process. This process will convert the given image into a threshold or binarized image, where we can easily get the optic cup.
After obtaining the disc and cup, various features can be computed. The clinical convention to compute the CDR is followed.
CDR = Area of Cup/Area of Disc
The computed CDR is used for glaucoma detection. If CDR value is less than 0.4, then the patient has no Glaucoma and has a normal eyesight. If CDR value is between 0.4 to 0.6, then the patient has a moderate Glaucoma and the patient is in his early stage of Glaucoma. If the CDR value exceeds 0.6, then the patient has severe Glaucoma and should be recommended for further analysis to an ophthalmologist.
The Flowchart for glaucoma diagnosis is shown in Figure 3.
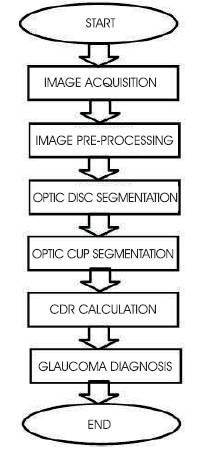
Figure 3. Simplified Work Flow of Glaucoma Diagnosis
In this paper, the algorithms are implemented, which are able to detect optic cup and disc regions. Matlab R2013 used for the optic cup and disc localization is shown in Figures 4 to 15. The Level of Glaucoma is represented in Table 1.
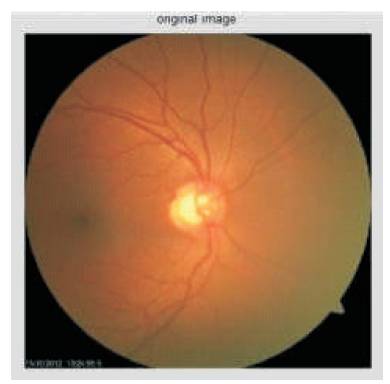
Figure 4. Color Retinal Fundus Image
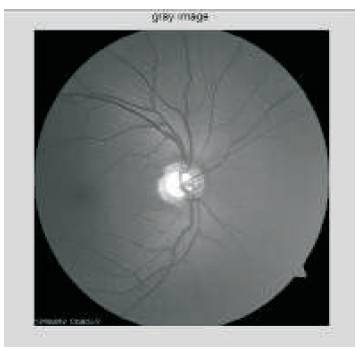
Figure 5. An Image with Green Channel
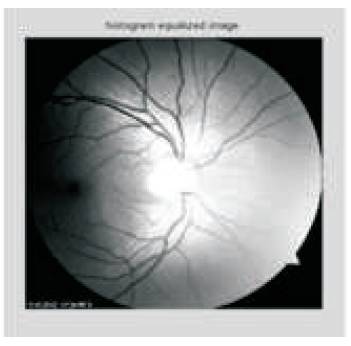
Figure 6. Adaptive Histogram Equalization
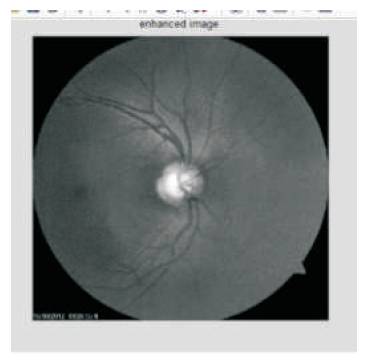
Figure 7. Image Enhancement
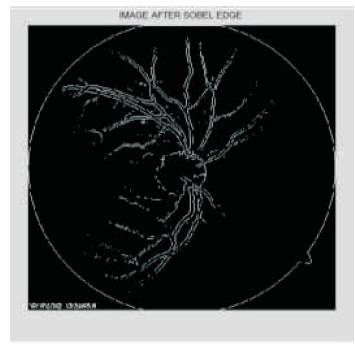
Figure 8. Sobel Edge Detection
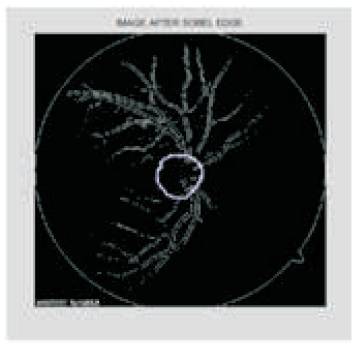
Figure 9. The Image is Obtained by using the Function Imfreehand
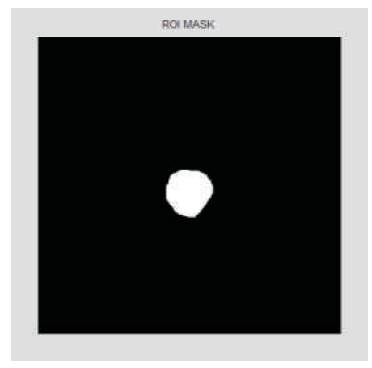
Figure 10. The White Mask that is acquired using the Create Mask
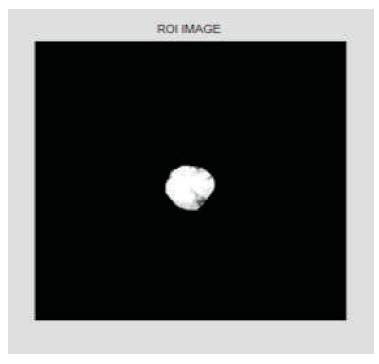
Figure 11. The Required Portion from the Adjusted Image. i.e. ROI
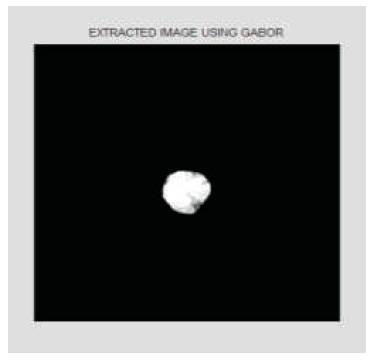
Figure 12. Extracted Image using Gabor Filtering
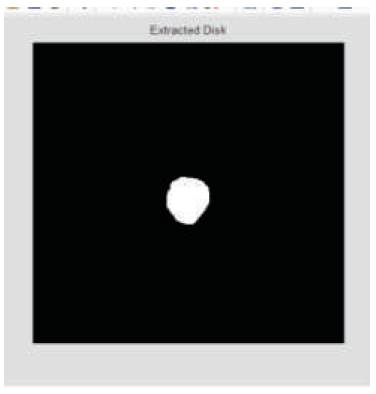
Figure 13. Extracted Disk Boundary
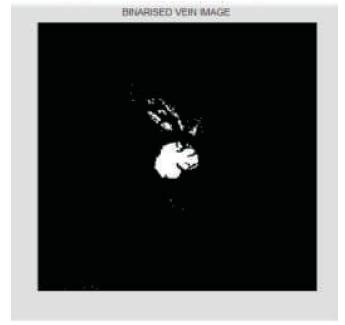
Figure 14. Binarized Vein Image
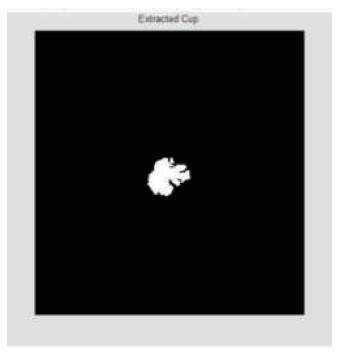
Figure 15. Extracted Cup Boundary
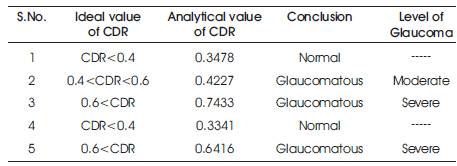
Table 1. Level of Glaucoma
This paper is presented and evaluated for Glaucoma detection in patients, a global leading cause for blindness. Region of interest (ROI) based segmentation is used for the localization of optic disc. The thresholding and smoothing is used for the localization of optical cup. The calculation of the Cup to Disc Ratio (CDR) is done and compared to the standard ratio values: if CDR<0.4, then it is normal, if CDR>0.4 and <0.6 then it is moderate glaucoma, and if CDR>0.6 then it is severe Glaucoma. According to this analysis, the patient is recommended for further analysis to an opthalmologist.