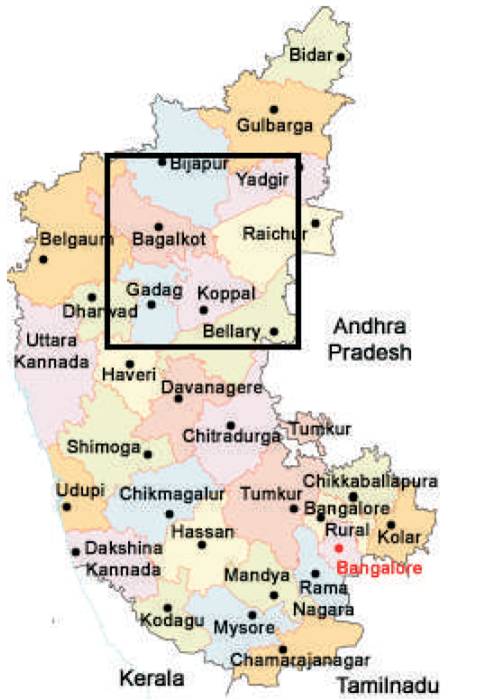
Figure 1. Karnataka- area of Study (squared)
Rice is the staple food for major population of India. Area and spatial distribution information of paddy rice are important for understanding of food security, water use, greenhouse gas emission, and disease transmission. Due to urbanization and drought during various times, rice cultivation is negatively affected in Karnataka. An algorithm based of paddy phenology is used to identify paddy fields and map the same. Landsat 8 data with high temporal resolution and geographic coverage is used for mapping. Envi along with idl 8.3 is used for data processing. The resultant paddy rice map well supports the statistical data. The resultant paddy rice map is expected to provide unprecedented details about the area and spatial distribution of paddy rice fields in Koppal, which will contribute to food security assessment, water resource management, estimation of greenhouse gas emissions, and disease control if this work is extended towards more scenes in a sub continental level.
Rice is one of the chief grains of India. India stands the first row of the world's largest rice producers. According to the recent survey, India produces 20% of all world rice production. The staple food of the people of the eastern and southern parts of India is rice [18]. Rice production increased and there was a 39 percent increase over the decade (1980 to 1990). By the year 1992, rice production had reached 181.9 kg, second in the world only to China with its 182 kg [12].Rice production in India is a vital part of the Indian national economy. In 2009-10 crop year (July–June), country's rice production had decreased to 89.14 million tonnes from the record 99.18 million tonnes in the previous year due to the severe drought that affected almost half of the country [3].
Being a tropical plant, rice grows abundantly in hot and humid climate. Rainfed areas are the major cropland for paddy cultivation, because of the heavy annual rainfall. That is why in India it is fundamentally a Kharif crop. Thoseareas that receive comparatively less rainfall, rice is also grown through irrigation[3].
There are few more points which marks the importance of information of paddy rice planting area. One is that paddy rice is the largest water-consuming crop and the water use efficiency for rice planting is related to global water security in the future [2] ,[14]. Next, effects of paddy rice agriculture on methane emission and future climate change cannot be ignored because it accounts for more than 10% of the total methane flux in the atmosphere [11]. Finally, paddy rice agriculture is related to avian influenza virus transmission as paddy rice fields are important habitats for free-ranging ducks and wild waterfowls [20]. The existing remote sensing based global or national land cover and land use datasets do have cropland layers. But it contains general information about crops rather than specific paddy rice information.
The difficulty of paddy rice mapping arises largely from the similar spectral characteristics between paddy riceand other land covers as well as frequent clouds and cloud shadows in the rice planting regions [6]. There are several existing methods to classify paddy fields. We can map paddy rice through different methods. Mapping using the images from certain stages (e.g., transplanting) and the image statistics-based approaches (e.g., the supervised classifiers like Maximum Likelihood [16], Support Vector Machine [4], and unsupervised classifiers like the Iterative Self-Organizing Data Analysis Technique).
Another approach is which flooding signatures during the rice transplanting phase to early vegetative growth phase is used to identify paddy rice. Flooding signatures can be detected from calculating the time series Land Surface Water Index (LSWI), Normalized Difference Vegetation Index (NDVI), and Enhanced Vegetation Index (EVI) [1], [9], [15].
Using freely available Landsat data by USGS/EROS [13],
Figure 1. Karnataka- area of Study (squared)
The time series of Landsat TOA image collection was used to calculate three vegetation indices, including NDVI [7], EVI [17], and LSWI [1]. The spectral indices were calculated using following equations:
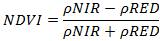
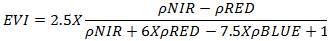
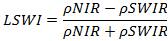
where ρ, ρ RED, ρNIR, and ρSWIR are the surfacereflectance values of the blue band (0.45–0.52 mm), red band (0.63–0.69 mm), near infrared band (for short hereafter, 0.76–0.90 mm), and short wave infrared band (1.55–1.75 mm), respectively in the Landsat OLI sensor.
A phenology-based algorithm was used for paddy rice mapping. The paddy rice is the only crop needing to be transplanted in a water–soil mixture environment [10]. Hence flooding signature is the key feature to detect paddy rice fields. A study reported in [8]. that the relationship between LSWI and NDVI (EVI) can effectively plot the flooding signals.
Flooding in the paddy field can last for approximately two months after transplanting until rice canopy covers mostof the surface area in tropical areas [6]. Time at which paddy is transplanted can vary according to rain availability, temperature, etc. Therefore, the flooding signals were identified using the vegetation indices for the rice transplanting period. The following equation is,
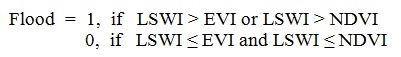
where Flood is the status of flooding/transplanting during transplanting phase.
Although the flooding signal is a unique characteristic for paddy rice during transplanting period, flooding signals from other land covers could also exist in the paddy rice transplanting phase. Those flooding mainly includes water bodies (e.g., rivers and lakes) and natural wetlands. To avoid these errors we need to remove permanent water bodies. For this we need masks. The generation of these non-cropland masks can help to reduce commission errors in the resultant paddy rice maps [6]. We generated masks for water bodies with the help of supervised classification (minimum distance) in envi 5.4.
After masking other water bodies which are non-cropland lands, paddy rice can be identified. It is done by making use of its unique flooding characteristics in the transplanting period. Due to the variation of transplanting timing in different fields, the flooding signature from one specific image could be biased [6]. Here a frequencybased approach is used to plot the flooding signals by accounting for all the flooding signals in the transplanting phase, ie., Frequency = ΣFlood
Initially apply a threshold value for frequency and classify those areas which satisfy the threshold condition as flooded regions. Here 2 is taken as threshold.
Validation is done by comparing the resultant paddy map with satellite images by visually zooming it using ENVI 5.4 andErdas. For the further clarification, statistical information from the Department of Agriculture Karnataka [7], [19].is considered.
Summer crop data collected from Karnataka State Natural Disaster Monitoring Centre on Koppal district during 2014 to 2016 is graphically represented in Figure 2.
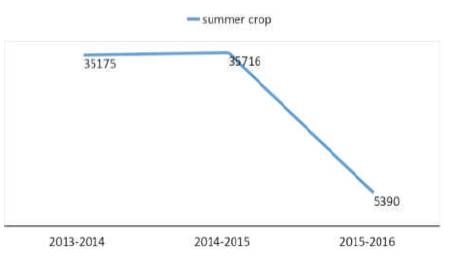
Figure 2. Paddy Cultivated Area in Hectors of Koppal District
From the derived paddy map for the years 2014 to 2016, we can see that, especially concentrating on Koppal district, from Figure 3 and Figure 4 we can see more green dots indicating more paddy cultivation. From Figure 5 and Figure 6, 2015 has the maximum cultivation. From Figure 7 and Figure 8, during 2016 there is very less cultivation. Figures 9 and 10 show that in 2017 there is adip in paddy cultivation, especially in Koppal district again. From the statistical data itself, we can see the variation of paddy cultivated areas, which clearly supports the paddy map in 2015, which has maximum cultivation of 35716 hectors, while in 2016 it dropped to 5390. 2017 statistical data is not available now for the comparison.
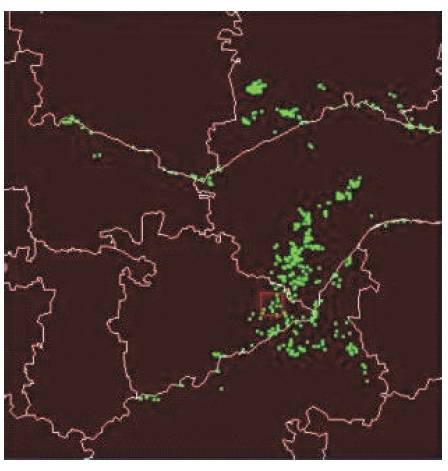
Figure 3. Paddy Mapping for 2014
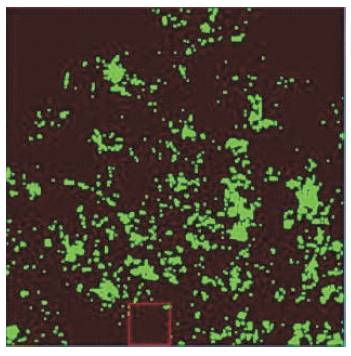
Figure 4. Paddy Mapping for 2014 (Zoomed)
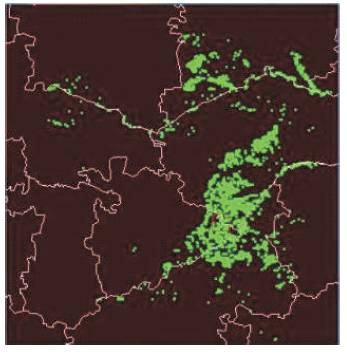
Figure 5. Paddy Mapping for 2015
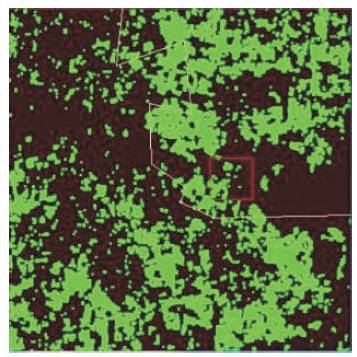
Figure 6. Paddy Mapping for 2015 (Zoomed)
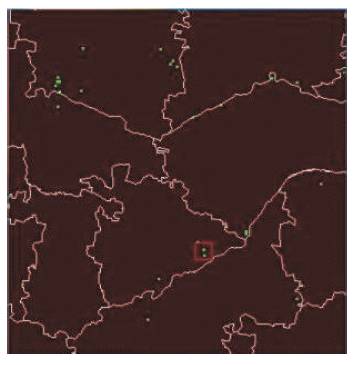
Figure 7. Paddy Mapping for 2016 Figure 6. Paddy Mapping for 2015 (Zoomed) Figure
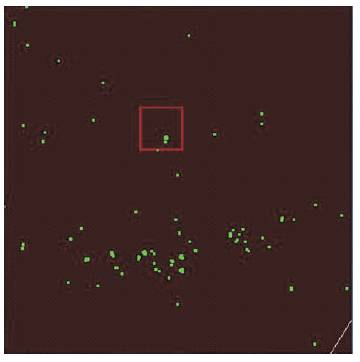
Figure 8. Paddy Mapping for 2016 (Zoomed)
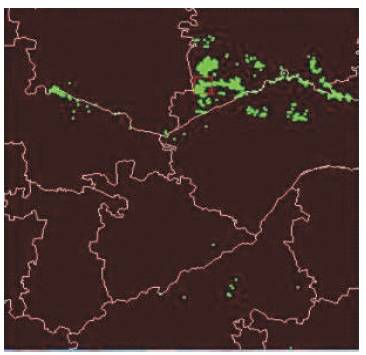
Figure 9. Paddy Mapping for 2017
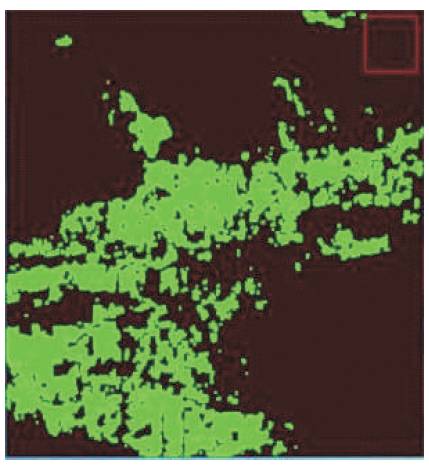
Figure 10. Paddy Mapping for 2017 (Zoomed)
By observing the rainfall distribution from Figure 11 for the following years, we can clearly infer that there was a drought during 2016, which might be one of the reasons for the dip in cultivation during that period.
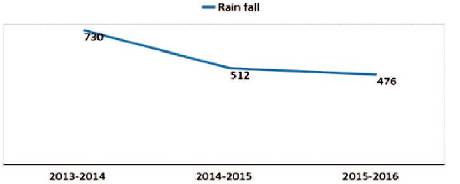
Figure 11. Annual Rainfall in mm for Koppal 26
Based on the improved phenology and pixel-based paddy rice algorithm and all the available Landsat 8 images in a single year, this study generated an unprecedented 30-m paddy rice map in Koppal. Landsat 8 imagery effectively provided sufficient information for paddy rice mapping algorithm as it requires perfect observation in transplanting state. To the authors knowledge, this is the first application of Landsat imagery on paddy mapping in India. This study also proves that Landsat 8 data can meet the high temporal resolution requirement of the rice mapping algorithm. Landsat 8 imagery is a great tool for detailed land use mapping, such as different crop type, forest species, etc.