(1)
Quantitative information on the low-flows regime of a stream is of utmost importance while making decisions on varied water resources management issues. The paper details a study on estimation of low-flows using 2-parameter Log- Normal (LN2) and Weibull (WB2) distributions for river Periyar at Neeleswaram site. The maximum likelihood method is used for determination of parameters of the distributions. Goodness-of-Fit (GoF) tests, viz., Chi-square and Kolmogorov- Smirnov are used for checking the adequacy of fitting of LN2 and WB2 distributions to the series of annual minimum d-day average flows for different durations of 'd', such as 7-, 10-, 14-, and 30-days. Model Performance Indicators, viz., correlation coefficient and root mean square error is used to evaluate the performance of the probability distributions adopted in frequency analysis of low-flows with a specific objective to identify the best suitable distribution amongst LN2 and WB2 studied for estimation of low-flows. The GoF test results and values of MPIs indicate the WB2 is better suited distribution for estimation of low-flows at Neeleswaram site. Low-flow frequency curves using LN2 and WB2 distributions are developed and presented in the paper.
Low-flows analysis is an important aspect of water quality management, reservoir storage design, determining minimum release policy, and safe surface water withdrawals. Many studies have focused on flow duration analysis, low-flows frequency analysis, flow recession analysis, and storage-yield analysis. There is, however, a need to classify clearly the definition of the low-flows and drought. Low-flows are seasonal phenomenon and an integral component of flow regime of any river. Drought, on the other hand, is a natural event resulting from less than normal precipitation for an extended period of time (Nathan and McMahon, 1990). Thus, drought, which is a more general phenomenon, can be characterized by more factors than low-flows alone. Hydrological literature describes that there are many interlinking natural factors that contribute to low-flows which includes direct river withdrawals for human activity and artificial afforestation in the catchment.
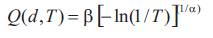
Number of measures and indices were used to characterize the low-flows, which includes mean annual runoff, mean daily flow, median flow, and absolute minimum flow. Among these, the Low-flows Frequency Analysis (LFA) is most commonly performed on the basis of a series of Annual Minimum d-day Average Flows (AMdAF) for different duration of 'd', such as 7-, 10-, 14-, and 30- days. An associated, annual event based, low-flows statistic Q(d,T) gives low-flows estimates, which is defined as the AMdAF that is expected to be occurred once in Tyear return period (Ries, 2012). In most of the cases involving low-flows Frequency Analysis, the available flow data are insufficient to conduct an accurate analysis of an extreme low-flows event. Therefore, various statistical distributions are used to improve the accuracy of LFA (Ang and Tang, 1984). After finding the series of AMdAF, a probability distribution should be selected to estimate the value of Q(d,T).
Research reports iterated that the Normal, 2-parameter Log Normal (LN2), Pearson Type-3, and 2-parameter Weibull (WB2) distributions are commonly available for LFA (Durrans, 1996; Önöz and Bayazit, 2001). In Low-flows Analysis, a selected distribution must fit an AMdAF and must have a finite lower limit of at least zero. Since LN2 and WB2 distributions satisfy these conditions, both distributions are considered in the present study for LFA (Lee and Kim, 2008). Jin Ahn et al. (1998) applied Power and SMEMAX transformation, Gumbel Type-III, Weibull, log-pearson type-III, and Log normal distributions to estimate 7-day and 30-day low flows for different return periods at four gauged points of the Ansung stream in Korea. They found that the power transformation, log pearson type-III, and the lognormal distribution provide good fit to low flows for the Ansung stream. Bowers et al. (2012) analysed the seasonal river flow data and found both power law and lognormal distributions are relevant to dry seasons. They also found that the river flow data in wet seasons are typically better fitted by lognormal distribution than by power law distributions.
Randall and Freehafer (2017) carried out the study on lowflow statistics at ungauged sites on streams in the Lower Hudson River Basin, New York using regression method. They found that the logarithmic transformations yielded less accurate equations inconsistent with some conceptualized relationships. Gotvald (2017) used Weighted Left-censored Regression method to compute the Low-flow Frequency and Mean Annual Flow statistics and basin characteristics for 56 stream gauge locations within north Georgia and 75 miles beyond the State's borders in Alabama, Tennessee, North Carolina, and South Carolina. Generally, Method of Moments (MoM) and Maximum Likelihood Method (MLM) are commonly used for determination of parameters of the distributions. Since MoM estimates are usually inferior in quality, especially for distributions with three or more number of parameters because higher order moments are more likely to be highly biased in relative small samples. Under these circumstances, MLM is considered to be more efficient method for determining the parameters of LN2 and WB2 distributions (Jain et al., 2007). For LN2 and WB2, the initial values of the parameters are obtained from first two moments of the distribution and then the MLM values are obtained through maximum likelihood functions using iterative method.
This paper details a computer aided procedure for evaluation of low-flows using Q(d,T) by adopting LN2 and WB2 distributions (using MLM) for river Periyar at Neeleswaram site. The methodology can be used to evaluate the frequency and magnitude of the AMdAF at a gauged site for different return periods. Goodness-of-Fit (GoF) tests, viz., Chi-Square and Kolmogorov-Smirnov (KS) are used for checking the adequacy of fitting of LN2 and WB2 distributions to the series of AMdAF. In addition to GoF tests, the performance of the probability distributions used in LFA using the series of AMdAF is evaluated by Model Per formance Indicators (MPIs), viz., Correlation Coefficient (CC) and Root Mean Square Error (RMSE).
The objective of the study is to identify the best suitable distribution amongst LN2 and WB2 adopted for estimation of low-flows for river Periyar at Neeleswaram site using GoF tests and MPIs.
Analysis of low-flows of a stream pre-supposes that: (i) the river to be perennial, (ii) no significant withdrawals and diversions from the location points are in operation; and (iii) the flows can reasonably be considered to be natural. The data on daily flows, for the entire period of record, are divided into yearly intervals. The series of AMdAF for different values of 'd', such as 7-, 10-, 14-, and 30-days are subsequently obtained. These values are used to determine the parameters of LN2 and WB2 distributions for estimation of Q(d,T).
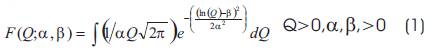
The cumulative distribution function (F(Q)) of LN2 is given by:
where and are shape and scale parameters of the distribution (Yue and Wang, 2004). The values of and are determined by MLM using the mean and standard deviation of the series of AMdAF for different values of 'd'. The parameters are used to estimate Q(d,T) for different return periods using equation (2):
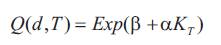
where, K is the frequency factor corresponding to T Coefficient of Skewness (Cs=0.0) for a given return period T.
The cumulative distribution function (F(Q)) of WB2 is given by:
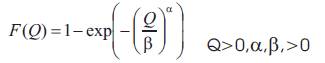
where and are shape and scale parameters of the distribution, respectively (Vogel and Kroll, 1990). The parameters ( and ) of WB2 are determined by MLM from equation (4), which is given by:
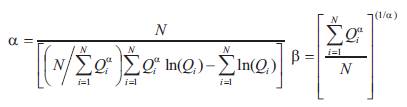
The parameters are used to estimate Q(d,T) for different return periods using equation (5) and given by:
GoF tests (D'Agostino and Stephens, 1986.) viz., Chi-Square 2 ( ) and Kolmogorov-Smirnov (KS) are commonly available for checking the adequacy of fitting of LN2 and WB2 distributions to the series of AMdAF data. Theoretical descriptions of the GoF tests are as follows: 2-test statistic is defined by:
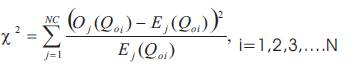
where O (Q ) is the observed frequency value of AMdAF for j oi th different values of 'd' for j class, E (Q ) is the expected j oi th frequency value of AMdAF for different values of 'd' for j class, NC is the number of frequency classes, and p is the number of parameters of the distribution. KS test statistic (KS) is defined by:
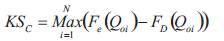
where, F (Q )=(i-0.35)/N is the Empirical Cumulative Distribution function of Q , F (Q ) is the Computed oi D oi Cumulative Distribution function of Q . The rejection oi 2 region of and KS test statistics at the desired significance level ‘ ’ are 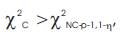 and
and  respectively.
Selection Criteria:
If the computed values (c and KS ) of GoF test statistics C of the distribution are less than that of theoretical value at the desired significance level ‘h’ then the selected distribution is found to be suitable for modelling the lowflows data (Horn, 1977).
The selection of suitable probability distribution for estimation of Q(d,T) is carried out through Model Performance Analysis using MPIs, viz., Correlation Coefficient (CC) and Root Mean Square Error (RMSE). The theoretical expressions of CC and RMSE are given below:
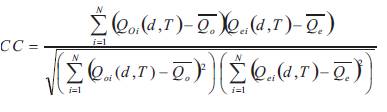
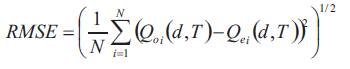
where, Q (d,T) and Q (d,T) are the observed and oi ei th estimated low-flows, respectively for i sample for a return period (T) and desired value of 'd'. Also, Q is the average o of observed low-flows and Q is the average of estimated e low-flows.
Selection Criteria:
The distribution with higher CC value (say, CC>0.9) and least RMSE is identified as better suited distribution in comparison with the other distribution for estimation of low-flows (Arora and Singh, 1987).
In the present study, a study on estimation of Q(d, T) using the series of AMdAF for different values of 'd' by adopting LN2 and WB2 distributions for river Periyar at Neeleswaram site is carried out. The Periyar river basin falls within the central part of Kerala and lies between 9°15’ 30’’ N and 10° 21’ 00’’ N latitudes and 76° 08’ 38’’ E and 77° 24’ 32’’ E longitudes. It spreads in the districts of Idukki and Ernakulam. From its source at 1850 meter above the mean sea level, it has a total length of approximately 244km and a catchment area of 5398 km . The highest point in Periyar basin is Anamudi, which is at an elevation of 2,695 meter above mean sea level. The Neeleswaram gauging station is located in the Periyar river basin and lies o o between 10 11’ 00’’ N latitude and 76 30’ 00’’ E longitude. The catchment area of the Neeleswaram gauging site is 2 4234 km . The location of the gauging site is presented in Figure 1.
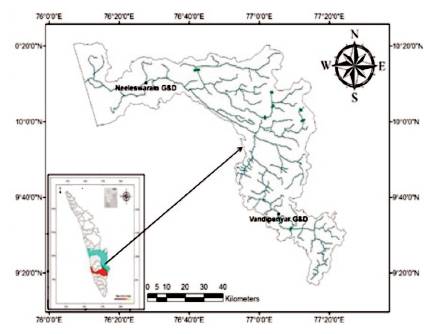
Figure 1. Location Map of the Study Area
The daily stream flow data pertaining to water year (June to May) for river Periyar at Neeleswaram site for the period 1971-72 to 2013-14 is used. From the scrutiny of the data, it is observed that the Gauge-discharge data of Vandiperiyar site is available only for few years and also found to be inconsistent. Therefore, the gauge-discharge data of Vandiperiyar site is not considered in the study.
The stream flow responses vary during non-monsoon months owing to the non-monsoon rainfall and flow regulations by the upstream reservoirs, which could be observed from the topography of the river basins. The examination of low-flows data of Periyar River at Neeleswaram for the period from 1971-72 to 2013-14 indicates that the river was perennial till the year 2007-08. However, after 2007-08, there have been a number of occasions, when the river had no flow. This is an alarming situation for changes in river flow characteristics and suggests the need of soil and water conservation measures in the up-reach sub-watersheds in both the basins. The lean period flows could be partly due to nonmonsoon rainfall and partly due to the regulated flows from upstream reservoirs. As the flows in the rivers are regulated, the lean season flows are considered as average over 7-days, 10-days, 14-days, and 30-days for the period of 43 years for river Periyar at Neeleswaram site.
By adopting the procedures, as described above, a computer program was developed and used to derive the series of AMdAF for different durations of 'd'. The program computes the parameters of LN2 and WB2 distributions, low-flows estimates for different return periods, GoF tests, and MPI values. The estimates of Q(d,T) for different durations of 'd' for different return periods from 1.01-year to 100-year obtained LN2 and WB2 distributions for river Periyar at Neeleswaram site is presented in Table 1.
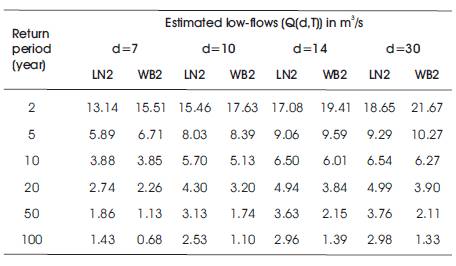
Table 1. Low-flows Estimates for Different Return Periods using LN2 and WB2 Distributions
The estimated values of Q(d,T) for different return periods from 1.01-year to 100-year for different values of d, such as 7-, 10-, 14-, and 30-days were used to develop LFCs and presented in Figure 2. From the figure, it can be seen that the estimates for Q(d, T) for different values of ‘d’, such as 7-, 10-, 14-, and 30-days obtained from LN2 distributions are higher than the corresponding values of WB2 distribution for return periods from 10-year to 100- year. Also, from Figure 2, it is observed that the estimates of Q(d,2) and Q(d,5) using WB2 distribution are consistently higher than the corresponding values of LN2 for different values of 'd', such as 7-, 10-, 14-, and 30-days.
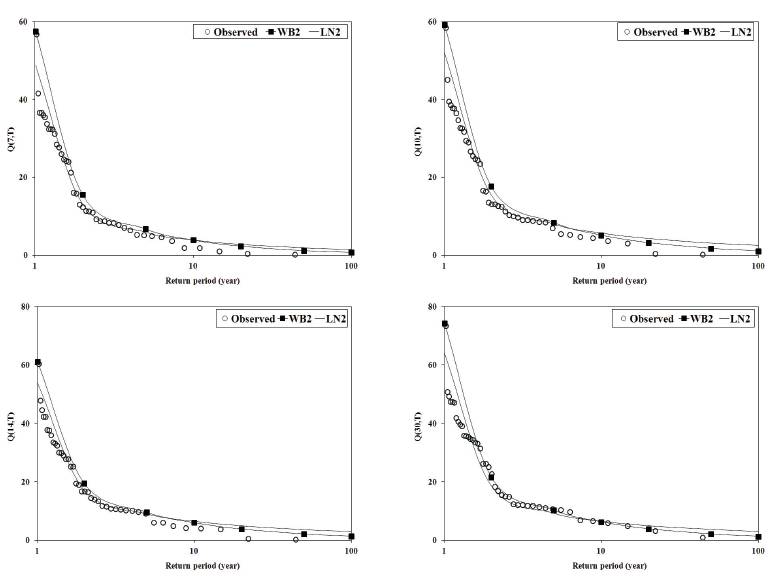
Figure 2. Low-flow Frequency Curves for River Periyar at Neeleswaram Site
GoF test values of c and KS for different values of 'd', such as 7-, 10-, 14-, and 30-days were computed using equations (6) and (7), and presented in Table 2.
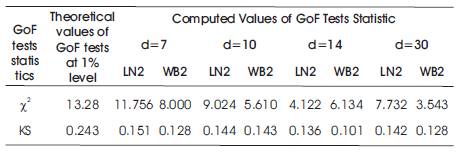
Table 2. Theoretical and Computed Values of GoF Tests using LN2 and WB2 Distributions
From Table 2, it may be noted that the computed values of c and KS using LN2 and WB2 distributions are not greater than its theoretical values at one percent level of significance, and at this level, both the distributions are considered as significant for modelling of low-flows.
The RMSE values for the series of AMdAF for different values of 'd', such as 7-, 10-, 14-, and 30-days were computed by using equations (8) and (9), and presented in Table 3.
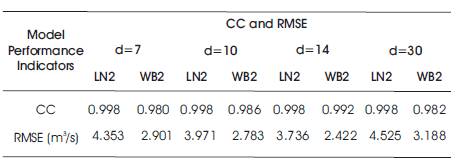
Table 3. CC and RMSE Values Computed by LN2 and WB2 Distributions
From Table 3, it is noted that the RMSE values given by WB2 distribution are minimum when compared with the corresponding indices of LN2 for the series of AMdAF for different values of 'd', such as 7-, 10-, 14-, and 30-days. Also, from Table 3, it is noted that there is generally good correlation between the observed and estimated values of Q(d,T) using LN2 and WB2 distributions. The CC values obtained from LN2 distribution are noted to be 0.998 for the series of AMdAF. The CC values obtained from WB2 distribution for the series of AMdAF vary between 0.980 and 0.992.
This paper presents briefly the study carried out for estimation of Q(d,T) for different values of 'd', such as 7-, 10, 14-, and 30-days by adopting LFA using a computer aided procedure for determination of parameters of LN2 and WB2 distributions (using MLM) for river Periyar at Neeleswaram site. From the LFA, it was found that the estimated Q(d,T) by LN2 distribution are higher than the corresponding values of WB2 for the return periods of 10- year and above. The GoF test results indicated that the LN2 and WB2 distributions are acceptable for frequency analysis of low-flows using the data series of AMdAF for different values of 'd'. The results of Model Performance Analysis indicated that the WB2 distribution having least RMSE for the series of AMdAF for different values of 'd'. The CC values obtained from LN2 and WB2 distributions showed that there is a good correlation between the observed and estimated values of low-flows and these values vary between 0.980 and 0.998 for the series of AMdAF for different values of 'd'. The results of GoF tests and the values of MPIs confirmed the suitability of WB2 (using MLM) distribution amongst LN2 and WB2 distributions studied for estimation of Q(d,T).
On the basis of the results obtained from GoF tests and Model Performance Analysis, the study recommends the estimated values of Q(d,T) adopting WB2 (using MLM) distribution could be used for planning, design and management of water resources projects in the vicinity of Neeleswaram site.
The author is grateful to the Director, Central Water and Power Research Station, Pune, for providing the research facilities to carry out the study.