Table 1. Difficulty Level and Item Evaluation
This paper focused on the analysis of test items constructed in the paper of teaching Physical Science for B.Ed. class. It involved the analysis of difficulty level and discrimination power of each test item. Item analysis allows selecting or omitting items from the test, but more importantly item an alysis is a tool to help the item writer improve an item. There were 100 objective type questions in the achievement test and was administered to a sample of 100 students from B.Ed. colleges. The result of the work showed that most of the test items fall in the acceptable range of difficulty index and discrimination index. However, 17 of the test items was excluded due to very high or very low difficulty level and poor discrimination power. Purposive sampling was adopted for this study and 100 B.Ed. Physical Science students were taken from private B.Ed. Colleges in Pondicherry, India. A test of 100 items was used for data collection. Using the findings relationship between the difficulty index of each item and the corresponding discrimination index is carried out using the Pearson correlation formula. From the analysis, it was found that item discrimination power increased with the increase in difficulty value but got decreased for very easy and very difficult test items. This work is significant for the researcher in framing test items with optimum difficulty and discrimination power. The findings also show that, most of the items were falling in the acceptable range of difficulty and discrimination level, however, some items were rejected due to their poor discrimination index.
Teaching and learning in classroom can be well assessed by achievement test and the two most important characteristics of an achievement test are its reliability and content validity. For a test to be reliable and valid, a systematic selection of items with regard to subject content and degree of difficulty is necessary. The effectiveness and quality of a test depends upon the individual item. And to determine the quality of individual item, item analysis is done after the administration and scoring of the preliminary draft of the test on the selected sample.“Item analysis indicates the difficulty level of each item and discriminate between the better and poorer examinees (Ebel, 1972). Item analysis has two purposes: First, to identify defective test items and secondly, to indicate the content the learners have or have not mastered Item analysis measures the effectiveness of individual test item in terms of its difficulty level and power to distinguish between high and low scorers in test (Brown & Frederick, 1971) . Thus item analysis helps in selecting and retaining the best test items in the final draft of the test. Rejecting poor items in the test also show the need to review and modify the items. Therefore the main purpose of item analysis is to improve tests by revising or eliminating ineffective items. The procedures of item analysis of an achievement test in teaching of physical science in the B.Ed syllabus is described in this paper with a stress on the difficulty level and discrimination power of items in the test.
According to Backhoff, E., Larrazolo, N., & Rosas, M. (2000), the Basic Knowledge and Skills Examination (EXHCOBA) is one of the few great-scale examinations in Mexico which has been publishing its psychometric parameters. In this paper they described the item analysis results, regarding the exam's difficulty level and discrimination power. It is viewed in the results that most of the items have a medium difficulty and a high discrimination power. It also revealed that, the mathematical items have better discrimination power levels than the ones which belong to social science.
Suruchi & Surender Singh (2014) conducted a study on the analysis of test items constructed in the subject of Biology for class IX. It involved the analysis of difficulty level and discrimination power of each test item. There were 120 objective type questions in the achievement test and was administered to a sample of 500 students from Government and Private Schools. The findings of the study showed that, most of the test items fall in the acceptable range of difficulty index and discrimination index. However, nine of the test items were rejected due to very high or very low difficulty level and poor discrimination power. It was found that, item discrimination power increased with the increase in difficulty value, but got decreased for very easy and very difficult test items. This work is significant for the researchers and school teachers in framing test items with optimum difficulty and discrimination power.
Gowdhaman & Nachimuthu (2013) aimed to analyze the test items of an achievement in the subject of history (Indian) of standard 11th . According to this study, objective tests are widely used to measure intelligence, aptitude, and achievement (or attainment). Item analysis allows selecting or omitting items from the test, but more to important, item analysis is a tool to help the item writer improve an item. Item statistics used in the item analysis of such criterion-referenced test is the Difference Index (DI). The difference index shows the gain, or difference in performance, on each item between the pre-test and post-test. Purposive sampling was adopted for this study and 15 students were taken from Municipal Girl's Higher Secondary School, Gugai, Salem District in Tamil Nadu state, India. A test of 190 items was used for data collection. Photographs (358) based teaching history of instruction, before and after the tests were conducted. Findings of the study were a total 190 items of achievement test for the difference index like 80 items are much better related to the Curriculum, 25 items are higher values and 85 items are not fitting; because they reflect only small gains. So these items were rejected. Finally, 105 items were selected form of History achievement test.
Kevin D. Crehan (1974) have developed an achievement test in which various item selection techniques are compared on consequential criterion referenced reliability and validity. Techniques compared include three nominal criterion-referenced methods, a traditional point biserial selection, teacher selection, and random selection. Eighteen volunteer junior and senior high school teachers supplied behavioral objectives and item pools ranging from 26 to 40 items. Each teacher obtained responses from four classes. Pairs of tests of various dimensions were developed by each item selection method. Evaluation of test reliability and validity were obtained using responses independent of the test construction sample. Resultant reliability and validity estimates were compared across item selection techniques. The findings of the study revealed that two of the criterion-referenced item selection methods resulted in consistently higher observed validity. However, the small magnitude of improvement over teacher or random selection raises a question as to whether the benefit warrants the necessary extra effort on the part of the classroom teacher.
Michael (1974); Muller, Calhoun, and Orling (1972) concluded that test reliability is dependent on the type of answer document used by elementary pupils. The present study was designed in part to assess the differential effect of two pupil response procedures (answering directly in the test booklet versus on a separate answer folder) on Metropolitan Achievement Tests scores of grades 3 and 4 pupils. Over 4000 pupils from nine school systems took the Metropolitan, half responding in their booklets and half using answer folders. The two groups were matched by grade in general scholastic aptitude. Although the separate answer folder group received lower scores than those did the group responding in the test booklets, the score reliabilities did not differ significantly for any test. Additionally, these reliabilities did not differ significantly from comparable metropolitan normative reliabilities. For survey achievement tests such as metropolitan, test reliability would not appear to depend on pupil response mode.
Boopathiraj & Chellamani, K. (2013) have conducted a study to analyze the test items of a researcher that made test in the subject of Research in Education for the studentteachers of Master of Education (M.Ed.). It involves the item difficulty and item discrimination. A test of multiple choice items was used as a data collection instrument in different Colleges of Education to 200 student teachers taken randomly. The sample for this study consisted of both gender. The findings show that most of the items were falling in acceptable range of difficulty and discrimination level however some items were rejected due to their to poor discrimination index.
The following questions emerged for the present study
Purposive sampling method was adopted to draw a sample size of 100 B.Ed. students of Physical Science branch.
An Achievement test of 100 objective test items was used for data collection. The test is developed with the help of subject experts on the selected three chapters in teaching of Physical Science course in B.Ed. Blueprint of the test was prepared giving due weightage to the instructional objectives, subject content and forms of questions. Bloom's revised taxonomy was used to frame the test items. Test comprised of twenty fill in the blanks, twenty true or false, twenty answer in one word questions and forty multiple choice questions. While constructing the items it was ensured that, language of test items was simple and unambiguous providing no clues towards the correct answer. Instructions were made clear on the test and answers were written in the question paper.
The test was conducted on a sample of 100 students from B.Ed. Colleges. Students were given as much time as they required to complete the test. Students were instructed to fill their answers only in the question paper provided.
After scoring the test items, test scores were arranged in descending order. To carry out the item analysis top 27% scorers and bottom 27% scorers of the total examinees were selected. Upper and lower 27% was used as “this value maximize the difference in normal distributions while providing enough cases for analysis” (Wiersma & Jurs, 1990). Middle 46% of the test scores were excluded as they behave in a similar pattern contributing insignificantly to discriminate the performance by students.
The difficulty of an item is understood as the proportion of the persons who answer a test item correctly. The higher this proportion, the lower the difficulty. What this means is that, it has to do with an inverse relationship: the greater the difficulty of an item, the lower its index (Wood, 1960).
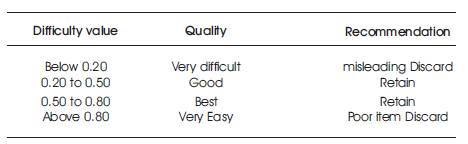
Item difficulty is the percentage of students correctly answered the item, also referred to as the p-value. The range is from 0% to 100%, the higher the value, the easier the item. P values above 0.80 are very easy items and might be a concept not worth testing. P-values below 0.20 indicate difficult items and should be reviewed for possible confusing language or the contents needs revision.
The following formula is used to find difficulty level.
DL= R u+Rl/Nu +Nl
where,
Higher the values of the difficulty index, easier the item is (Brown, 1983). If most students answered an item correctly, then the item was an easy one. If most students answered an item incorrectly, then it should have been a difficult one. So, the items answered correctly by 100% or 0% of the examinees are insignificant. Table 1 shows the difficulty level and item ecaluation
Table 1. Difficulty Level and Item Evaluation
Item discrimination defines the index of indiscrimination as the ability of an item on the basis of which the discrimination is made between superiors and inferiors. (Blood and Budd, 1972). Item discrimination or the discriminating power of a test item refers to the degree to which success or failure of an item indicates control of the ability being measured. It determines the extent to which the given item discriminates among examinees in the function or ability measured by the item. This value ranges between 0.0 and 1.00. Higher the value, more discrimination of the item. A highly discriminating item indicates that, the students who had high tests scores got the item correct whereas students who had low test scores got the item incorrect.
Discrimination power is estimated using the following formula: Discrimination power = RU -RL /NU (or)NL
Tests with high internal consistency consist of items with most positive relationships with total test score. In practice, values of the discrimination index will seldom exceed 0.50 because of the differing shapes of an item and total score distributions. ScorePak® classifies item discrimination as "good" if the index is above 0.30; "Fair" if it is between 0.10 and 0.30; and "poor" if it is below 0.10. Table 2 shows the Discriminative Indices and Item Evaluation.
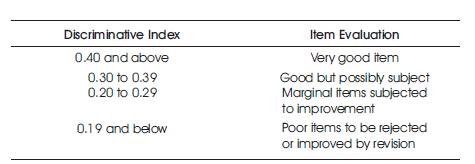
Table 2. Discriminative Indices and Item Evaluation
The findings of item analysis on 100 test items can be understood by the Table 3.
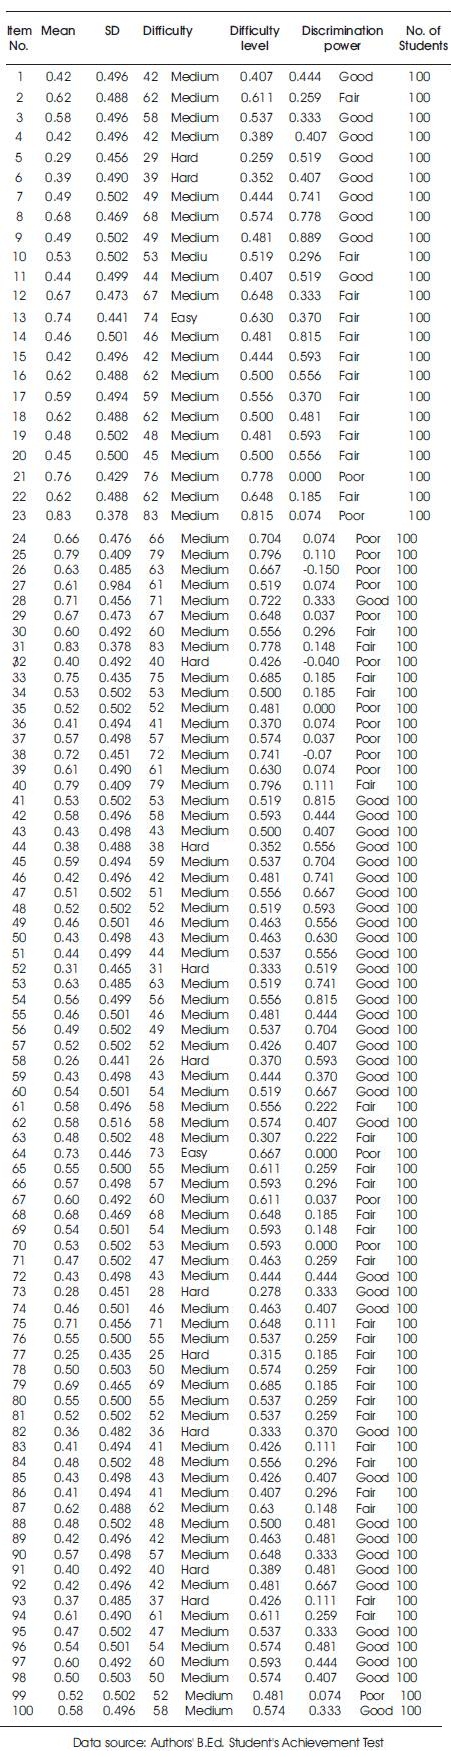
Table 3. Item Analysis
The test items provided for achievement test in teaching of Physical Science is hundred. The item difficulty index and item discrimination was calculated using respective formulas and values are tabulated. Based on the value, each item is described as Poor, Fair, Good, Hard, Medium and Easy.
The discussion is made based on the research question framed for this study. This study aimed to study the differences in the item difficulty level and discrimination power of the individual test item. The findings of the study reveal that seventeen items out of 100 items were rejected either due to difficulty level or discrimination Index. Thirty seven items fall in the range of 0.1 to 0.3 and they are named as fair items. Remaining forty six items are good items as they have the discrimination value above 0.3. Therefore Eighty three items were accepted provided with necessary revision. Table 4 shows the rejected item (Poor item <0.1).
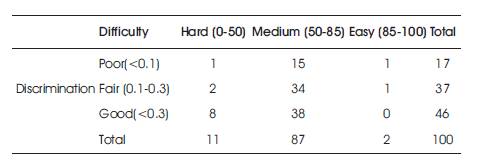
Table 4. Relationship between Item Difficulty and Item Discrimination
Figure 1, shows the graph of difficulty indices for the 100 items frequency, no items fall below 0.2 and only three item falls above 0.80 difficulty level. A total of 97 items are in the range of 0.2 to 0.80. The three items are found to be very easy with difficulty value above 0.80. And that three very easy test items were rejected for the final draft of achievement test. Hence it shows that if the difficulty index increases the difficulty of an item decreases.
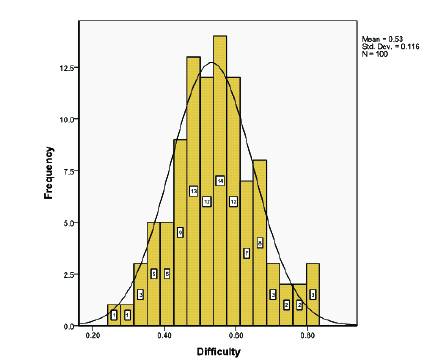
Figure 1. Item Frequency for Each Difficulty Index Range.
Figure 2, the graph shows discrimination power of test items clearly and mostly 81% of the test items had a discrimination index of 0.40 and above and fall in the category of excellent items. Thirty seven items are considered as fair with a discriminative power range of 0.30 to 0.39 while seventeen items with Discriminative power range between 0.20 to -o.2 needs improvement and are rejected.
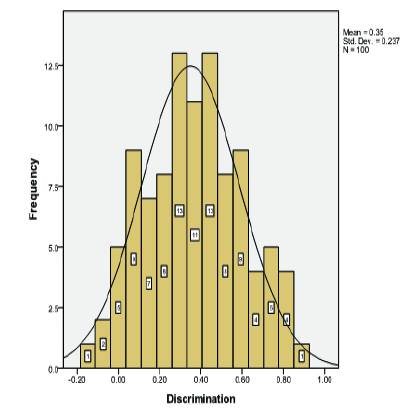
Figure 2. Item Frequency for Each Discrimination Index Range.
Figure 3 shows the relationship between difficulty level and discrimination power calculated for an achievement test for B.Ed., students. It shows a moderate negative relationship between values of Difficulty index and Discrimination power. This negative correlation signifies that as the difficulty index increased discrimination index also increase but to an optimum value only after which discrimination power decrease with the increase in difficulty level. This suggested that the easier items (>0.80) or too difficult items (<0.20) poorly discriminate between the superior and inferior examinees. However in this study no wide scattering was observed. Thus, after the item analysis of test items nine items were recommended to reject for the final drafting of achievement test.
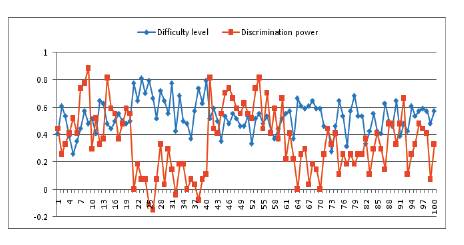
Figure 3. Relationship between Difficulty Level and Discrimination Power.
The study suggests the following recommendations for further studies:
The findings of this study imply the importance of the item analysis for defining the quality and efficacy of individual test item in constructing a more reliable test. The study proposes that test items with good positive discrimination power and medium difficulty are ideal for a good test whereas these items with negative or zero discrimination power and having very low or very high difficulty level should be rejected. Item analysis results are tentative and are influenced by the quantity and nature of students, instructional techniques applied, chance errors and purpose of the test. This work can be repeated in other subjects to develop a good item bank for student community.