Figure 1. Block Diagram of Proposed System
Indoor air pollution in developing countries has a direct impact on the mortality rate. Washrooms and kitchens are the common sources of indoor air pollution. In recent years, Scientists and public have shown more concern towards indoor air quality as most people spend more than 70-90% of their time indoors. Shower head and faucets can accumulate bacteria due to the moist environment in washrooms. The swift in the deterioration in quality of atmospheric conditions is very high due to unclean emissions from automobiles and industries. These changes could be the causes of life threatening diseases. An air quality monitoring system that relies on IoT and cloud computing is presented in the proposed work. The device is designed to sense CO2, CO, H2, NH3, LPG, Toluene, Temperature and Humidity. The system sense the presence of these air pollutants and send them to cloud analysis. It also includes the development of a mobile application to monitor and alert whenever the pollutant concentration exceeds the threshold value.
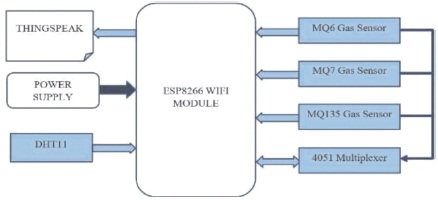
Air is an indispensable resource of life. According to World health Organization more than 80% of population is inhaling polluted air that is leading to chronical diseases (Kulkarni & Zambare, 2018). There is a need to use air quality monitoring system in our environment to ensure the air is not contaminated. This can be done by using sensors to monitor temperature, carbon dioxide, carbon monoxide and other harmful gases. According to Lancet report, air pollution killed 1.7 million Indians in 2019 (Rout et al., 2018). IoT based Air Pollution Monitoring System monitors the air quality over a web server using internet and will display the values on the graph and also sends a notification to the user when the quantity of pollutants go beyond threshold level, means when there are sufficient number of harmful gases present in the air like CO2, smoke, CO, Toluene, NH3, LPG and H2. It will show the air quality in PPM on the webpage so that it can be monitored easily. The system also monitors temperature and humidity as they are considered as critical aspects in monitoring air quality. The rate at which chemicals are released from building materials is usually higher at higher building temperatures. The proposed block diagram is shown in Figure 1 and flow diagram of Node MCU is shown in Figure 2.
Figure 1. Block Diagram of Proposed System
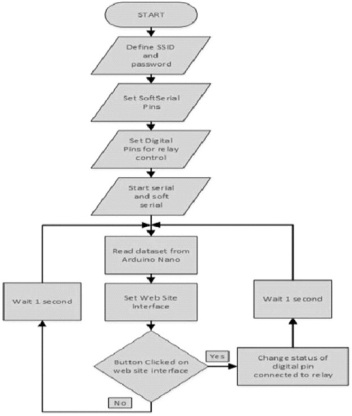
Figure 2. Flow Diagram of Node MCU Firmware
IoT emboldens the communication between various devices, which is also popularly known as Machine-to- Machine (M2M) communication. Due of this, the devices are able to be directly connected. Connected Infrastructure delivers maximum performance, saves time, space optimization, gives superior customer experience and sustainability by design (Liu et al., 2011). Since physical objects are digitally and centrally connected and managed through wireless infrastructure, a high degree of automation and control can be enabled. Hence machines can communicate with each other, resulting in faster performance (Postolache et al., 2009). IoT devices can interact with each other and do a lot of work without any intervention of humans, and this minimizes the human efforts (Luo et al., 2008). One of the most obvious advantage of IoT is monitoring. Knowing the precise number of resources or the air quality in your home, can in addition offer more statistics that couldn't have formerly been amassed easily (Kumar & Kumari, 2019). IoT saves heaps of time by automating the tasks that are otherwise very time-consuming. IoT applications will offer personal assistants who can notify you on your everyday plan (Singh & Jain, 2016). MQTT protocol stands for Message Queue Telemetry Transport Protocol. It is a lightweight protocol which is mainly used for transporting the data to middleware and applications. Unlike the simple client and server and client protocol where the server interacts directly with the client to provide services (Sun et al., 2017), DDS is an IoT standard protocol for real-time, scalable and high-performance machine-to-machine communication. The DDS protocol can be used for IoT devices as well as in the cloud (Sokolova et al., 2006).
Air pollution is all around us, Indoors, outdoors, in cities and in the country side. It affects us all, whether we realize it or not. Without air there can be no life, but breathing polluted air condemns us to a life of disease and early death (Parikh et al., 2008). From smog hanging over cities to smoke inside the home, air pollution poses a major threat to health and climate.
There is no doubt today that air pollution is a public health emergency. Exposure to polluted air can affect everyone's health. Air pollution can contribute to small annoyances like coughing or itchy eyes. It can also cause or worsen many diseases involving the lungs and breathing, leading to hospitalization.
In circuit diagram shown in Figure 3, the 5V Vin from Node MCU to DHT11, MQ6, MQ7 and MQ135 sensors Vcc. Ground pin from Node MCU to grounds of all sensors and 4051Multiplexer pins 6,7 and 8 are also grounded.4051 acts as a Multiplexer if Pin 6 is made logic low or grounded and as a De-multiplexer if it is made logic high.
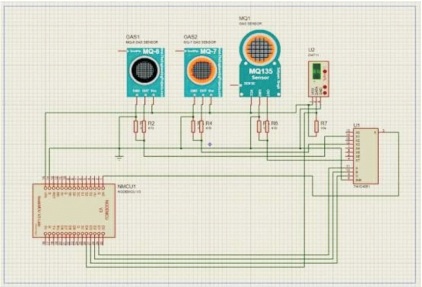
Figure 3. Circuit Diagram
Pin 3 (Enable input) from 4051 is connected to the analog input pin A0 of Node MCU. D1, D2 and D3 pins from Node MCU are connected to select lines of 4051 pins 11, 10 and 9 respectively. A0 pin from MQ135 to pin 4 (Y7) of Multiplexer. A0 pin from MQ7 to pin 12 (Y3) of Multiplexer.A0 pin from MQ6 to pin 14 (Y1) of Multiplexer. Data pin from DHT11 to GPIO pin 2 (D4) of Node MCU. Multiplexer is powered using a 9V battery to pin 16 (Vcc). As there is one analog pin in Node MCU, the data from all sensors need to be multiplexed. Therefore, data from Gas sensors is multiplexed using 4051 IC and then the output is given to A0 pin of Node MCU. This pin receives the data in regular intervals from all sensors with some delay between one sensor and the other, whereas, the data from DHT11 sensor is directly connected to GPIO2 pin (D4) of Node MCU.
The implementation of proposed system has two Air pollution monitoring channels. The data received from the sensors is processed and sent to Thing Speak server. The server plots the real time data on a graph with the help of MATLAB code running in the background. The graphs obtained for Hydrogen and LPG concentration is shown in Figure 4.
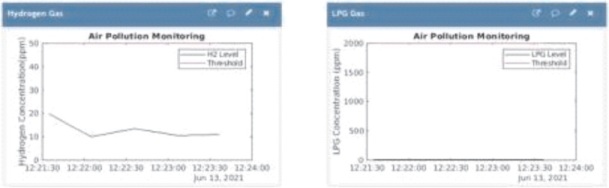
Figure 4. Hydrogen and LPG Concentration
The graph for carbon monoxide, temperature, humidity is shown in Figures 5 and 6. These graphs are helpful in easy analysis in monitoring the data.
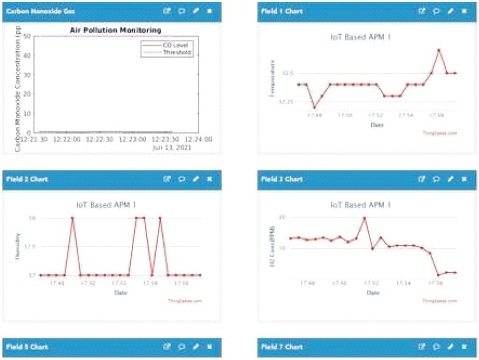
Figure 5. Carbon Monoxide, Temperature and Humidity Concentration
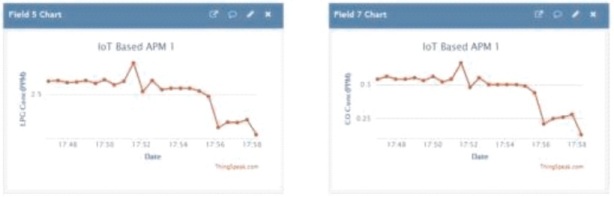
Figure 6. LPG and CO plots
Thing Speak does not allow to plot the threshold value dynamically as, there is no MATLAB code for plotting a unit step function or a DC value dynamically. Therefore, the threshold value is plotted by allotting separate field value for it and then plotting it on the graph. Field 3 in the code shows the real time data of H2 received from sensor and field 4 is allotted to plot its threshold value. And these two fields will be plotted on the same graph to know if the pollutants have exceeded the threshold value. In this way 14 fields are considered in which two are for temperature and humidity and the remaining to plot the pollutant gases and their threshold values. As each Thing speak channel can have only 8 fields, Channel#1 is to plot Temperature, Humidity, H2 gas, H2 threshold, LPG gas, threshold, CO gas, CO threshold, and Channel#2 is to plot NH3 gas, NH3 threshold, Toluene gas, Toluene threshold, CO2 gas, CO2 threshold as shown in Figure 7. The NH3, toluene and CO2 concentration and threshold plots are shown in Figure 8 and 9 respectively.
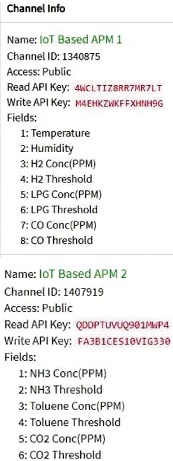
Figure 7. Channel Information
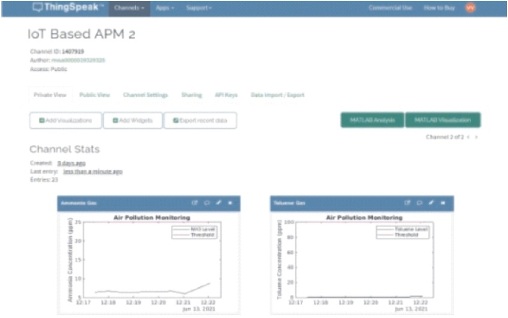
Figure 8. APM2 Interface
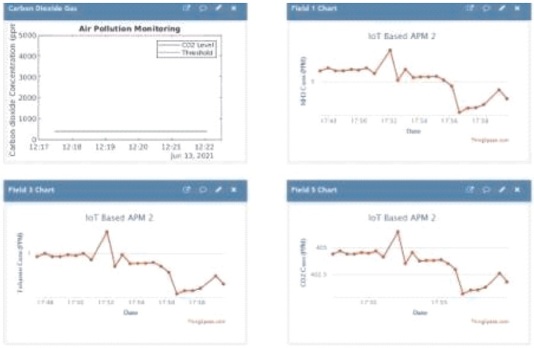
Figure 9. NH3, Toluene and CO2 Concentration and Threshold Plots
Although, Thing speak can send notification to the registered mobile phone through an App, when the concentration of pollutants exceeds the threshold value, the automatic clearing of data is not possible after the alert is indicated and sliding time axis is not possible. Due to these limitations an application interface is developed which can fetch the real time data. This application can plot the graph and update it regularly. This application also sends an alert message to the mobile phone whenever the pollutant concentration exceeds the threshold value.
The Application interface developed is shown in Figure 10. The sensors receive the data and send it to Node MCU for further processing.
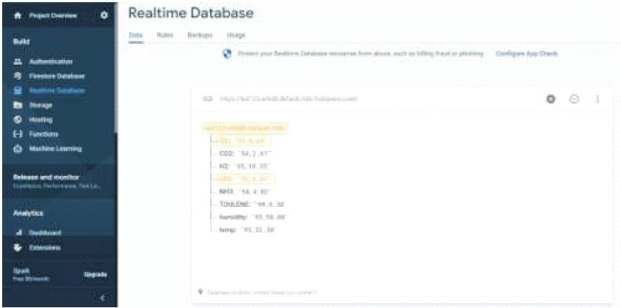
Figure 10. Real Time Data Base
After processing the data, Node MCU sends it to real time database of Firebase. This cloud stores the data and syncs it to APM app. Our APM app on receiving real time data plots it onto respective graphs. The temperature and humidity is shown in Figure 11. Hydrogen level and LPG are shown in Figure 12. Carbon monoxide and Ammonia are shown in Figure 13. The toluene and carbon dioxide levels are shown in Figure 14. This application also sends an alert whenever the concentration of pollutants exceeds threshold value as shown in Figure 15.
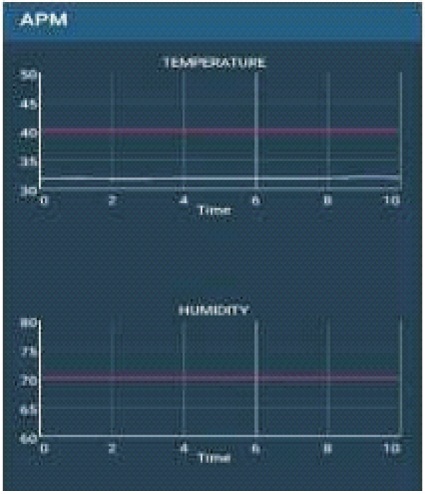
Figure 11. Temperature and Humidity Plot
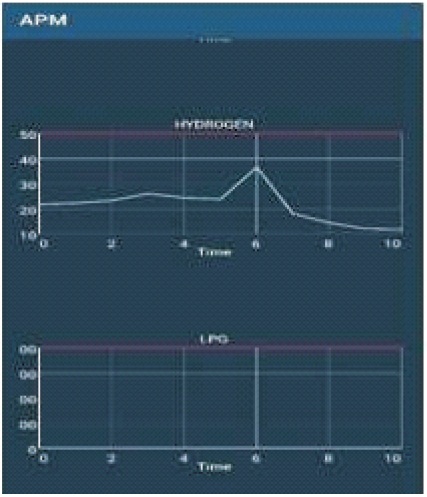
Figure 12. Hydrogen and LPG Plot
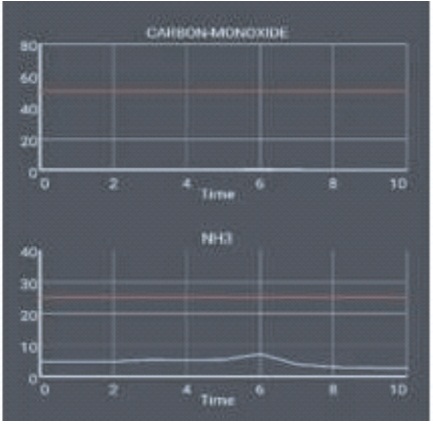
Figure 13. Carbon Monoxide and Ammonia Plot
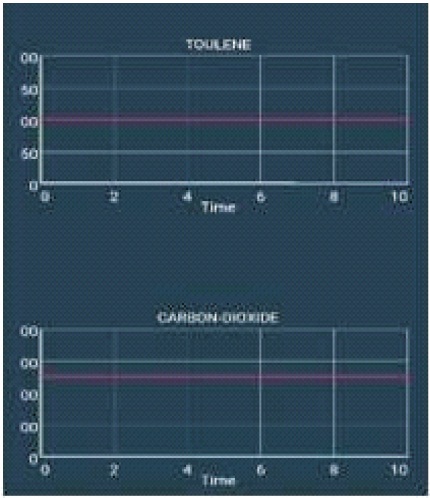
Figure 14. Toulene and Carbon dioxide plot
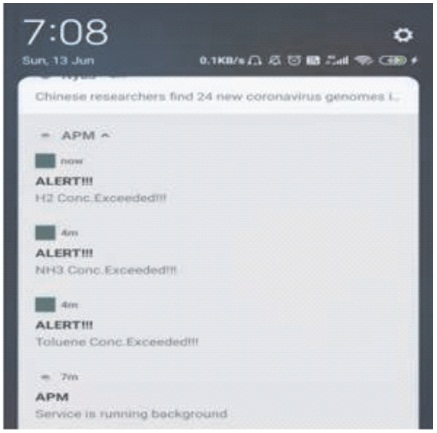
Figure 15. Block Diagram
The system using ESP8266 as Master control unit with IoT and cloud computing technology is interfaced successfully to monitor the quality of air. The use of MQ135 for sensing NH3 and CO2, MQ7 for sensing CO, MQ6 for sensing H2 and LPG and DHT11for temperature and humidity are successfully interfaced to the proposed system. The mobile Application developed can be used anytime anywhere to monitor the air pollution. The proposed model has been tested for reliability of data and the outputs are shown in results.