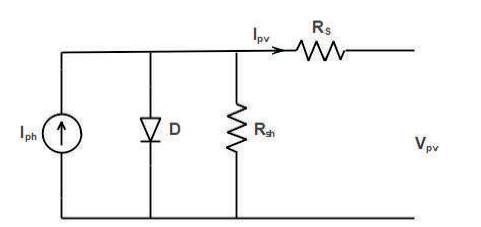
Figure 1. Equivalent Circuit of a Solar Cell
The aim of this paper is to emulate commercial PV module under different parameters and environmental condition (insolation or temperature change) by using Photovoltaic Power Profile Emulation (PPPE) software and Magna DC power supply. This method can be used, where the real PV panels are not available or hard to work within lab conditions. The PPPE software automatically calculates solar array voltage and current profiles based on predefined values entered by the user. After this, profiles are sequentially sent to a Magna-Power supply. The user can define a limitless number of profiles to be emulated and sequenced over a given period of time.
Electrical power is essential to improve and develop the life cycle. There are two types of energy source in the world, such as conventional and non-conventional energy source. However, most of the used energy came from conventional energy sources, such as gas, coal, and oil (Application of Non-Conventional and Renewable Energy Sources, n.d.). It contributes about 92% of total power generation in the world (Meshram & Mujumdar, 2013), since these sources are limited and will be exhausted in the future. The non-conventional energy source is considered to be a promising alternative. Nonconventional energy sources, such as solar radiation, biomass, wind, geothermal, and waves a r e environmental friendly and pollution free. Therefore, new developments in the field of non-conventional energy are being developed (Taylor & Hilger, n.d.).
As Sun is a non-ending source of energy, solar energy is considered to be the best solution to maintain the energy requirements in the future. Solar energy can be used in many applications, such as electricity generation for residential uses, heating water, and agriculture (Xiao et al., 2004). To get use of the solar energy, the most popular method is to use solar photovoltaic panels (Das & Pradhan, 2011). Solar photovoltaic (PV) is a technology which coverts the sunlight to electricity without any moving parts. A PV panel consists of many PV cells connected together in series and parallel combination to increase the output current and voltage depending on the application requirements. A typical PV cell produces around 0.5 V and a current that very much depends on the intensity of the sunlight and the area of the cell (Messenger & Abtahi, 2017). PV panels are considered to have a low operating and maintenance costs compared to other renewable energy sources. Therefore, solar PV panels have a highly promising future for economic viability and environmental sustainability point of view (LEONICS).
Due to the recent upsurge in the demand of PV systems, new requirements have been set to the manufacturer of PV panels. It was necessary to develop more advanced methods to test PV panels. The converted electricity from the solar energy are affected by some factors, such as temperature, sunlight intensity, and other atmospheric conditions (Kumari & Babu, 2012). The solar radiation is not constant. It keeps changing throughout the day. It was possible before to test the low power PV system under real weather conditions. However, now the PV systems generate up to hundreds of kilowatts of power. It is difficult to test these modern PV systems due to cost and space. Also, it is hard to reproduce the same I-V characteristic every time under real weather conditions. In addition, it is usually not suitable to work with actual PV panels’ indoor laboratory conditions. Thus, a PV emulator is devolved to be used in place of commercial PV modules to test the performance of the modules before using them in a real system. There are different types of PV emulator on the market that can emulate photovoltaic modules with output power range up to 2000 kW (Programmable DC Power Supplies, n.d; Pelin et al., 2014; Can, 2013; ETSystem DC Sources).
The aim of this paper is to emulate commercial PV module under different parameters and environmental conditions (insolation or temperature change) by using Photovoltaic Power Profile Emulation (PPPE) software and Magna DC power supply. This can be used in laboratory setup at all times. The developed technique can be used to investigate and understand the behavior of any emulated PV depending on several factors, such as variation in temperature and insolation. The emulation of the PV profile can be done under various extreme conditions such as complete or partial shadings.
PV emulator is considered as a simple and low-cost solution method, which allows the user to reproduce the same irradiation conditions indoor. The PV emulator introduces a suitable way, which easily allows emulating PV system component with different parameters to be able to study its characteristic. Figure 1 shows the equivalent circuit of a solar cell that is emulated.
Figure 1. Equivalent Circuit of a Solar Cell
The system can be emulated by a photocurrent source (Iph) with a diode connected in parallel. A series and a parallel resistance are connected, since in practice, the solar cells are not ideal. The photocurrent source is proportional to the solar radiation and is affected by the surrounding temperature. Using the above circuit, the I-V characteristics of a solar cell is given as,
where,
Ipv is the photo-generated current
Iph is the photocurrent
I0 is the dark saturation current
Vpv is the output voltage
Vt is the junction thermal voltage
Rs is the intrinsic series resistance of the solar cell.
Rsh is the intrinsic shunt resistance of the solar cell.
Ns is the number of connected cells in series.
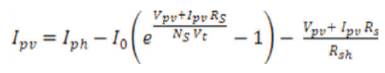
The figures below demonstrate the outcomes from a DC supply emulated as a PV panel for specified reference parameters, such as temperature (60°), maximum voltage (34.4 V) and current (3.49 A), open circuit voltage (43.20 V), and short circuit current (3.9 A). Experiments for no load and load conditions are carried out to understand the behavior of the emulated PV.
Figures 2 and 3 demonstrate the I-V and P-V characteristics of the referenced PV module for varying temperature (with red curve having the lowest temperature), respectively. It can be observed that as the temperature increases, the open-circuit voltage decreases, while the short-circuit current increases slightly. This trend reflects on the P-V characteristic curve as shown in Figure 3 and the highest maximum power is obtained at a lower temperature.
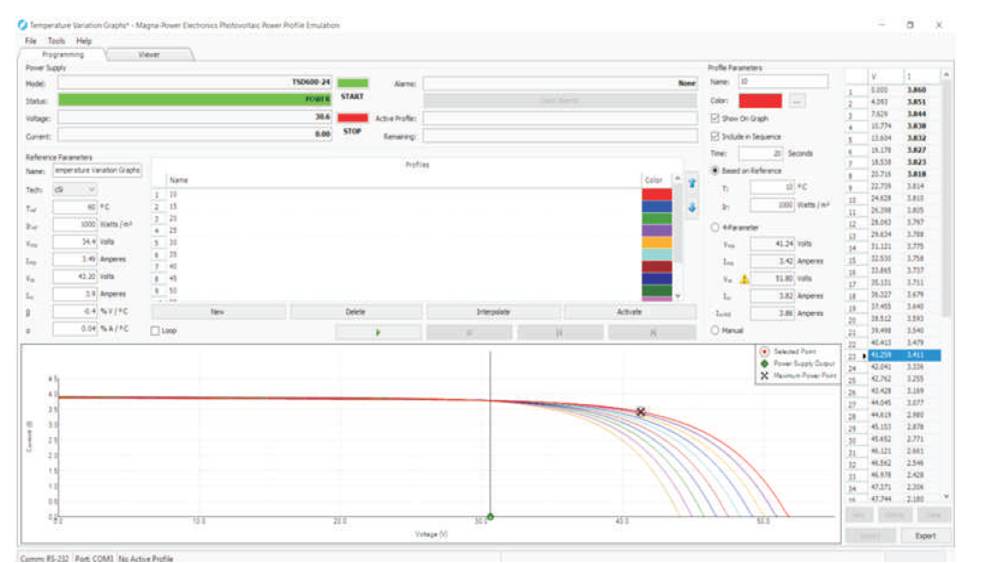
Figure 2. V vs. I for Varying Temperature
Figure 3. V vs. P for Varying Temperature
Table 1 is derived from the results obtained in Figure 2 and 3. From Figure 4, it can be noted that open-circuit voltage is almost linearly proportional to temperature but with a negative slope, i.e., as temperature increases, voltage decreases. However, from Figure 5, it can be inferred that the short-circuit current is directly proportional to temperature with a positive slope. As the temperature increased, the band gap between filled band through forbidden band to the conduction band is reduced. This reduction implies ease for electrons to move to conduction band, leading to an increase in current conduction capacity while changing several semiconductor parameters (Arjyadhara et al., 2013). Figure 6 demonstrates the drop in maximum power delivered by PV with increase in temperature.
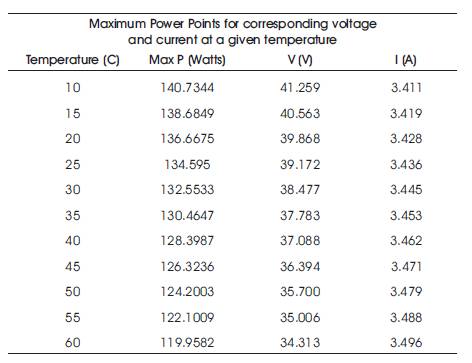
Table 1. Maximum Power Point with varying Temperature
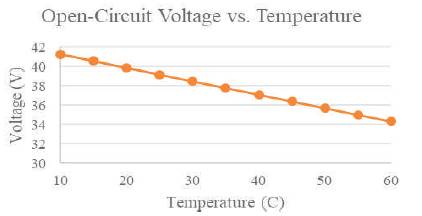
Figure 4. Voltage vs. Temperature Curve for no Load
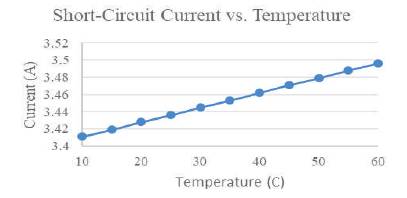
Figure 5. Current vs. Temperature Curve for no Load
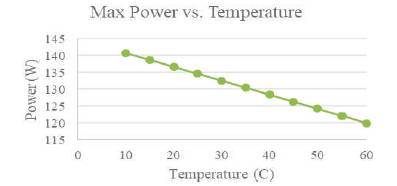
Figure 6. Power vs. Temperature Curve for no Load
As a result, most efficient use of MPPT can be carried out on cold days because maximum power can be delivered in lower temperature operating conditions. In order to deliver maximum power for any specified temperature, the behavior of any PV panel can be interpolated, and the maximum power can be obtained by utilizing the maximum power point tracking algorithm (MPPT).
Figures 7 and 8 demonstrate the I-V and P-V characteristics of the referenced PV module for varying insolation. It is observed that as the insolation increases, the open-circuit voltage increases slightly, while the shortcircuit current increases significantly. The cumulative effect of the change in voltage and current results in a higher maximum power output for increasing insolation. Table 2 shows the variation of power, voltage and current with insolation.
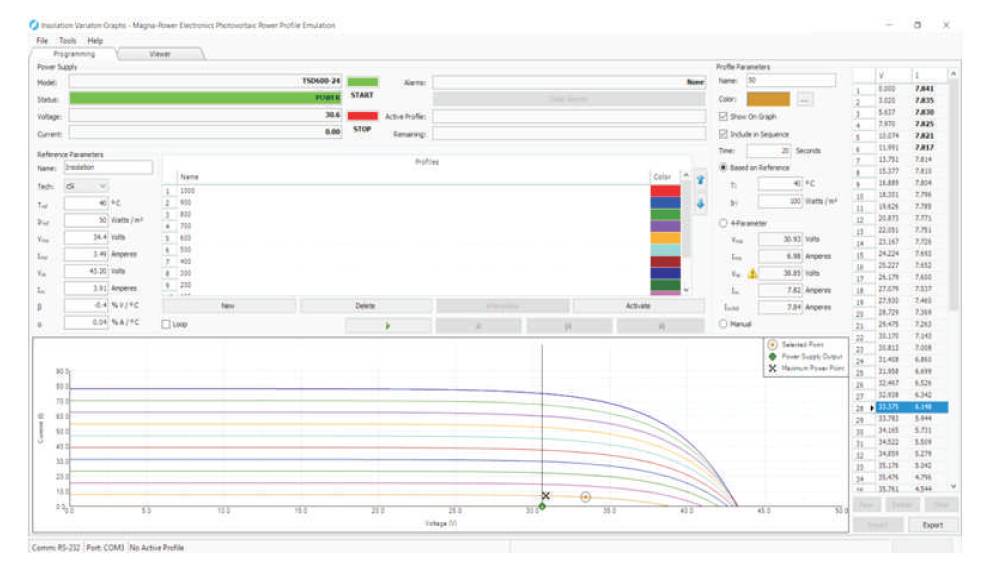
Figure 7. V vs. I for varying Insolation
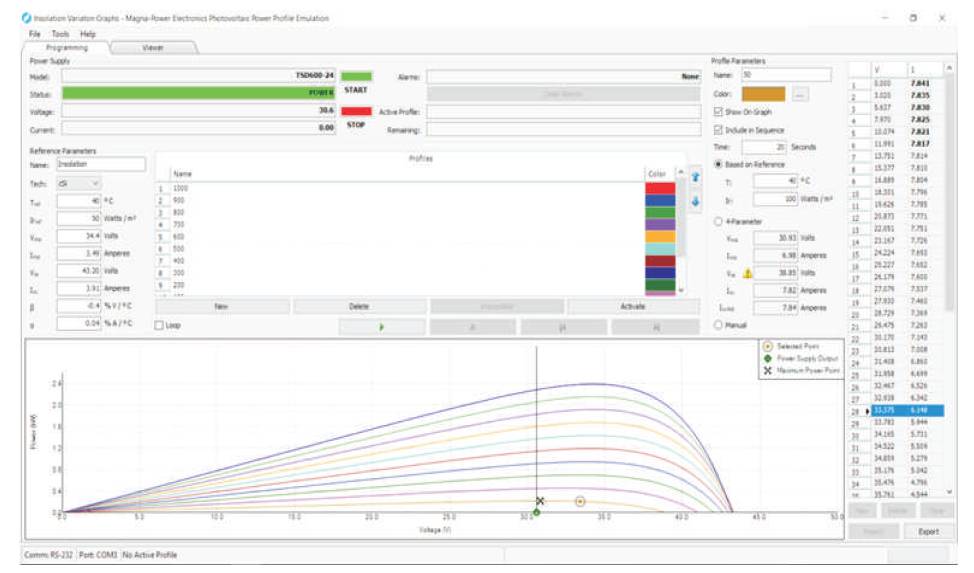
Figure 8. V vs. P for varying Insolation
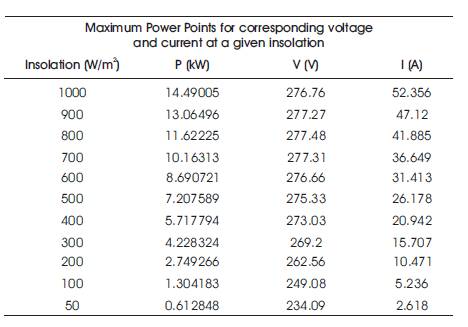
Table 2. Variation of Power, Voltage and Current with Insolation
As insolation increases, the open circuit voltage and short circuit current of the PV increases as shown in Figures 9 and 10, respectively. Increase in insolation implies increase in incident solar radiation, as a result more electrons escape from their semiconductor bonds resulting in higher open-circuit voltage and short-circuit currents (Meshram & Mujumdar, 2013). From Figure 9, it can be seen that voltage and insolation follow an increasing non-linear behavior. However, from Figure 10, the short-circuit current is observed to increase linearly with insolation. Thus, the cumulative effect of the opencircuit voltage and short-circuit current results in a linearly increasing maximum power as a function of insolation as shown in Figure 11. As mentioned earlier, several other characteristics of a given PV panel be found out by interpolation. Thus, any PV panel module can be emulated by a DC supply to simulate any required characteristic behavior.
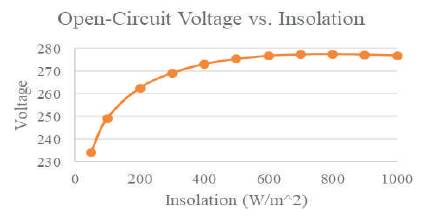
Figure 9. Voltage vs. Insolation Curve for no Load
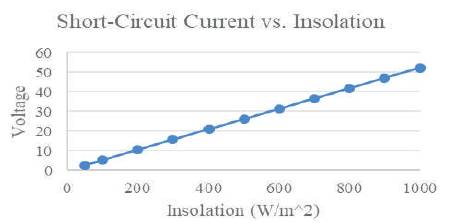
Figure 10. Current vs. Insolation Curve for no Load
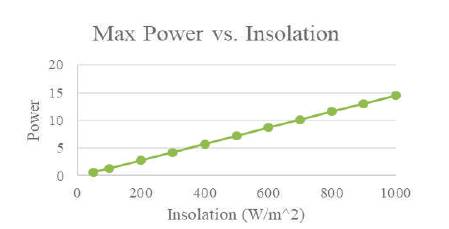
Figure 11. Power vs. Insolation Curve for no Load
Several loads were tested to understand the variation of current and voltage with insolation and temperature. In this experiment, all the loads used were purely resistive in nature. As a result, current and voltage are directly proportional to each other. From the several graphs plotted for voltage and current vs. insolation, it was noticed that the voltage and current (as a result, even the power) start to decrease after a certain insolation threshold is reached. Thus, for a given load, the power is constant till the threshold is reached and reduced after a threshold. This threshold is observed to depend on the load used. Higher the value of the load, the higher is the threshold of insolation, after which open-circuit voltage and current decreases.
From Figures 12 and 13, it can be noted that the threshold for load of 22.6 Ω is 70 W/m2 . On the other hand, from Figures 14 and 15, it can be observed that for load of 12.1 2 Ω, the threshold is only 35 W/m2 .
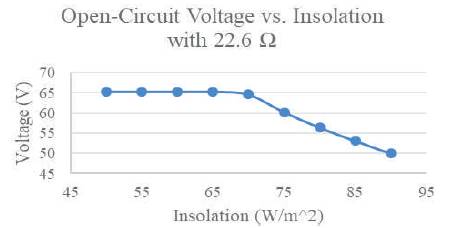
Figure 12. Open-circuit Voltage vs. Insolation for the Load of 22.6 Ω
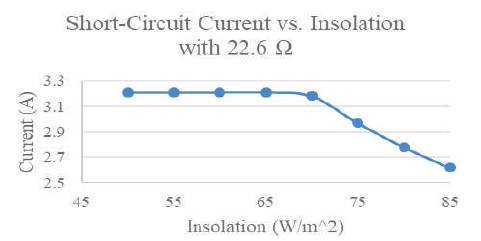
Figure 13. Short-circuit Current vs. Insolation for the Load of 22.6 Ω
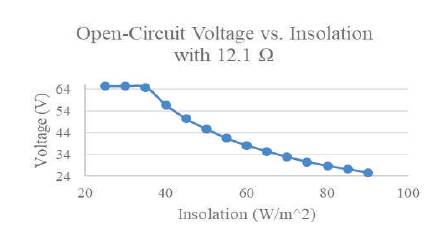
Figure 14. Open-circuit Voltage vs. Insolation for the Load of 12.1 Ω
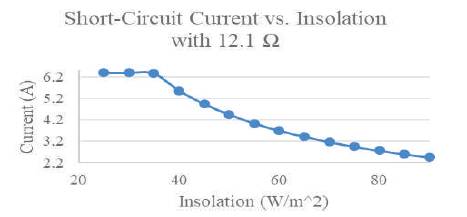
Figure 15. Short-circuit Current vs. Insolation for the Load of 12.1 Ω
While the voltage and current are affected in load condition due to insolation, the temperature, on the contrary, is not seen to affect the load conditions.
In conclusion, several characteristics of a DC supply emulated PV panel were studied. It was observed that any PV panel module can be emulated by a DC supply to simulate any required characteristic behavior. The effects of insolation and temperature were also evaluated. Increase in temperature led to decrease in output voltage and power. However, increase in insolation led to an increase in output voltage and power. Also, in load conditions, the voltage and power drop after a certain threshold of insolation is overcome. Before that the power and voltage remain constant. On the other hand, change in temperature does not affect the load condition. Thus, the DC Power supply can be used as solar PV in the laboratory condition.
This publication was made possible by grant # [QUST-2- CENG-2017-17] from the Qatar University. The statements made herein are solely the responsibility of the authors.