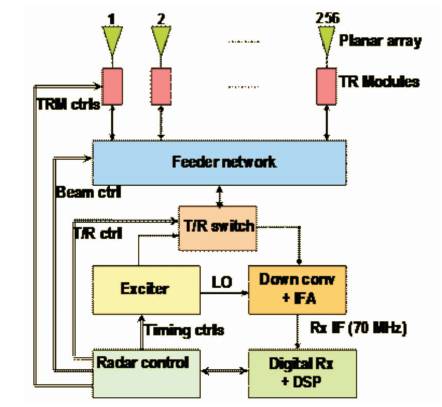
Figure 1. Block Diagram of LAWP Radar
The dedicated VHF clear-air atmospheric radars built in the late 70’s and early 80’s were found to be capable of observing atmospheric parameters such as the three-dimensional wind vector. These radars measure wind continuously. Wind profiling radars yield real-time lower atmospheric wind profiles in continuous unattended operation. Wind profilers are necessary to measure the height profile of wind vector and Signal to Noise Ratio (SNR) by detecting the Doppler shift of echoes. The lower atmospheric signals, which are processed in the present work has been obtained from the LAWP radar at National Atmospheric Research Laboratory (NARL), Gadanki, India. This paper discusses estimation of the wind profile using Peak Detection Technique (PDT) and Db11 Wavelet. The fake peaks which are adjacent to the real in the radar data can be detected by applying the threshold. In order to get the true position of the object, those fake peaks should be removed and this is possible by using Peak Detection Technique. Effective Doppler shift for LAWP data is obtained by using Peak Detection Technique and compared with the doppler obtained for LAWP data using Daubechies Wavelet. Results shows that there is an effective doppler shift after using Db11 Wavelet.
The Lower Atmospheric Wind Profiler is used for conducting research in the lower atmosphere[1]. National Oceanic and Atmospheric Administration (NOAA) developed the technology for operational wind profilers, and in the early 1980’s deployed the Colorado wind-profiling network consisting of five VHF and one UHF radars. National Atmospheric Research Laboratory (NARL) at Gadanki (13.47 °N, 79.18 °E) near Tirupati, India, has been operating this wind profiler at 1280 MHz. This wind profiler is used for studying the structure and dynamics of the lower atmosphere. These radars employ bi-phase coding with complementary codes, to achieve better range resolution with maximum average power.
Wind profiles are ver y important for studying meteorological phenomena and weather forecasting. These wind profilers receive echoes from the atmosphere in the height range from about 100 m to 4-5 km. These wind profiler radars are pulse Doppler Radars, coherent, and very high sensitive. The radar works on the principle of doppler effect. The range and the radar scattering crosssection of the target are measured by using time delay, with reference to the transmitted pulse and the received signal power. These wind profilers are also called pulse radars.
Whatever the signals received by the LAWP Radar, it contains both signal and noise. By reducing the noisy signal in the received data, SNR gets improved. It can be possible by using different algorithms. This can be done already by using Wavelets, but doppler shift for the LAWP data, which was obtained after de-noising using wavelets is not much effective. To get more effective doppler shift for LAWP data, Peak Detection Technique is used.
The atmospheric radars of interest to the current study are known as clear air radars and they operate typically in VHF (30 –300 MHz) and UHF (300 MHz –3 GHz) bands. Nowadays, Radars were extensively used for obtaining the wind information (wind profiler). Doppler radar capability for probing the atmosphere and wind profiling radars have been used successfully for meteorological research and they have been considered for routine operations. Figure 1 shows the block diagram of a LAWP Radar. Wind profilers are expected to have a growing impact upon weather forecasting, atmospheric research environmental pollution monitoring, climate, air traffic control, and many more. It is therefore important that the wind measurements of these radars are both accurate and reliable. This network of systems have provided important insight into the optimal design details for an operational network[2]. The wind profile can be measured at these frequencies, even in rainfall season. However, these wind profilers have a serious limitation, (i.e), inability to measure high resolution winds in the first few kilometers. Wind profiler radars are relatively less sensitive and low cost systems, which use less power and smaller antenna and they are used for both research and operational applications.
Figure 1. Block Diagram of LAWP Radar
This wind profiler or Boundary Layer (BL) radar as it probes the lower part of the atmosphere (up to about 5 km) and operating in the frequency band 900-1400 MHz are popular for measuring the wind vector by making use of variations in amplitude and frequency of radio waves which are transmitted from a radar system. The height resolution of this profiler is 100 m or better. The features of high spatial resolution and fast system recovery time requires operation at frequencies near 1000 MHZ.
There are several variants to the above type of pulse radars that have been developed with varying degrees of complexity to meet the demands of application in various fields, eg: Over The Horizon (OTH) radars, Imaging radar, Synthetic Aperture Radar (SAR), Doppler Weather Radar (DWR), Precipitation radar, Atmospheric radars [3].
LAWP radar has applications beyond wind profiling. It is being extensively used for atmospheric research and operational meteorology. It can measure the complete Doppler spectrum of atmospheric targets with a time resolution on the order of 1 min and a range resolution of about 100 m. These data may be used to estimate the Moments, Noise Levels and Doppler shift[2]. LAWP radar can be used to distinguish the clear-air, scattering from the precipitation scattering arising from cloud and rain drops. Since they provide almost continuous measurement of wind over a range of altitudes, they provide detailed information on vertical structure and wind variability. Vertically directed beams provide for direct measurement of vertical motions. In addition to wind and wind variability, the Doppler wind profiler provides measurement of signal strength and Doppler spectral width. It has yielded valuable data for the research community with respect to the winds, ABL and precipitation.
LAWP Radar system Specifications are as follows,
To measure the atmospheric winds the winds, profilers use either Doppler Beam Swinging (DBS) technique or Spaced Antenna (SA) technique. Generally, DBS technique uses a minimum of three radar beam orientations (Vertical, East- West, and North- South) to derive the components of the wind vector.
One antenna beam is pointed toward the zenith, and two or four beams are pointed at off-zenith angles in the range of 10- 20o off-zenith with orthogonal azimuths (three beam systems) or orthogonal and opposite azimuths (five beam systems) as shown in Figure 2. Spaced Antenna technique measures the temporal and spatial variation of field pattern of radar signals which are partially reflected or scattered from refractive index irregularities in the atmosphere. The antenna is pointed vertically. The spectral or complex auto correlation analysis yields an estimate of the vertical velocity.
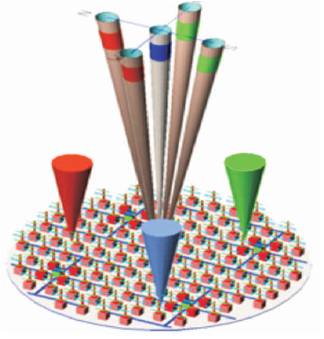
Figure 2. Antenna Configuration for Doppler Beam Swinging Technique
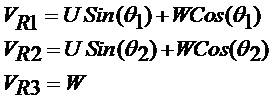
The profiler is operated in a pre-selected sequence of beam directions. Comparing the received echo with the transmitted pulse permits the determination of the Doppler frequency. Radial velocity measurements are made at each specified height along each beam. The beam pointing sequence is typically repeated for every 1-5 min. For each height, the radial velocities measured from the three beams are used to derive the east-west (zonal), northsouth (meridional), and vertical components wind, U, V and W respectively.
If the beams are oriented to east at the zenith angle θ1 (beam 1), and to north at zenith angle θ2( beam 2), and to the vertical θ3 (beam 3), then the radial velocities along these three beams are,
The received signals are converted into quadrature baseband signals using the down converter and quadrature detection. The demodulated quadrature signals, which represent the combination of signal plus noise are sampled at regular intervals. The Data processing steps as illustrated in Figure 3 include pulse compression, coherent integration and spectral processing steps like clutter removal, incoherent integration, etc.
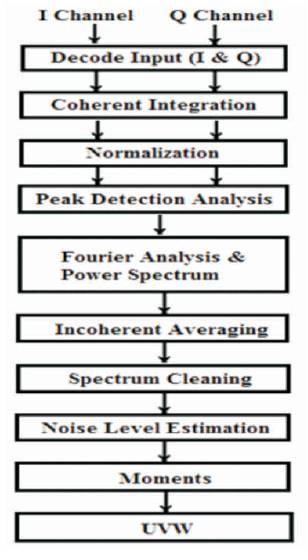
Figure 3. Data Processing Steps of LAWP Radar
The maximum range capability of the radar wind profiler is directly proportional to the square root of the average transmit power, which is the product of peak power and duty ratio (τ/T), where T is the inter-pulse period. The Profiler's Range Resolution is equal to cτ/2. The best range resolution is obtained with short pulse length, but the profiler's height coverage will be minimum due to low average transmit power.
The time series complex data {(Ii, Q), i = 0, 1. . NFFT- 1} is subjected to FFT to obtain the complex Doppler spectrum {(Xi, Yi), i = 0. . . NFFT - 1} of the received echoes. Ii and Qi are the in-phase and quadrature components in time series data, Xi and Yi are the real and imaginary components of the complex Doppler spectral data, and NFFT is the number of time series points.
In general, the echo power due to a single pulse is very weak compared to the noise power and echoes received over a large number of successive pulses are averaged to improve the detection capability. Therefore, large number of pulses need to be transmitted within the given integration interval. Otherwise, radar should be able to transmit pulses at a fast rate for better detection.
Peak indicates a sudden increase in signal, sharp rise in amplitude and bursts in data, etc. in the time-series analysis and signal processing. Peak Detection Technique can be able to detect peaks in variant environments, independent of the average magnitude of the peak signal [4].
Thresholding can be used to find the local maxima for signal portions which exceeds the threshold level [6]. Effective Doppler shifts can be obtained by Peak Detection Technique. Peak Detection Technique is one of the methods for reducing the probability of false detection. The advantage of this algorithm is better height coverage and effective doppler shift. The flow diagram of the Peak Detection Technique is shown in Figure 4.
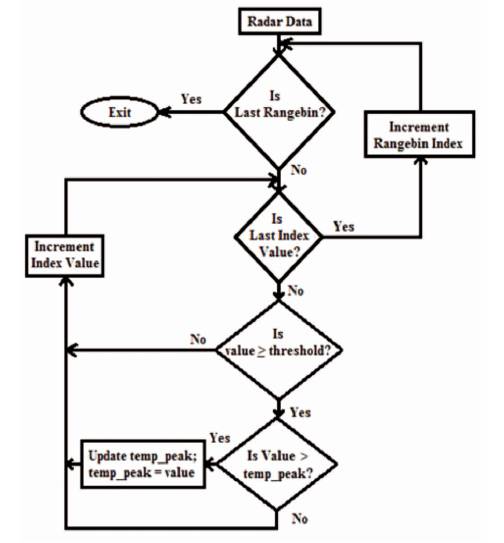
Figure 4. Flow Diagram of the Peak Detection Technique
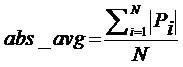
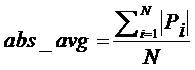
Computing the Threshold automatically by adapting it to the noise levels in the time-series as

where max is the maximum value in the time-series and K is the influence factor of the deviation, abs_avg is the average of the absolute values in the time-series and abs_dev is the mean absolute deviation.
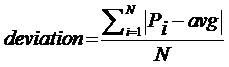
If the deviation is very low, the threshold will nearly be in the middle of maximum value and the average value.
When K= 0.5, Then the Threshold equation can be rewritten as,
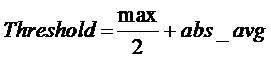
where,
The Threshold can be calculated based on the above equations.
The clutter can be removed from the wind profiler data by applying the thresholding. First, the peak value should be identified in each and every range bin and stored in an array. The wind profile of the radar data should be done by combining all these peak values using the spline method.
Wavelets are the one of the tools for removing noise from a variety of signals. Wavelet transforms, uses a multi resolution technique by which different frequencies are analyzed. The Wavelet transform performs a correlation analysis, therefore the output is expected to be a maximal when the input signal most resembles the mother wavelet.
Wavelet decomposition of a signal y(t) is
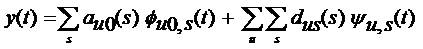
u is the dilation parameter and s is the translation parameter.
ϕ(t) and Ѱ(t) are called scaling and wavelet functions respectively. auo and duo are wavelet coefficients.
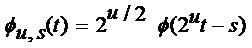
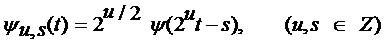
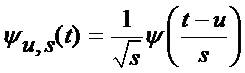
Wavelet technique is one of the most important methods for removing noise and extracting signal from any data. Mallat defines a wavelet as a function of zero average,
which is dilated with scale parameter s, and translated by u
Wavelet analysis can often de-noise a signal without degradation. The term “de-noising” describing various schemes attempt to reject noise by thresholding in the wavelet domain. The aim of this study is to investigate the wavelet function that is optimized to identify and de-noise the radar signal.
The Daubechies support the orthonormal wavelet, making wavelet analysis in discrete time possible [5]. The wavelet and scaling function for Daubechies exist up to order 20. Higher order Daubechies functions are difficult to describe with an analytical expression. The Daubechies wavelets are chosen to have the highest number of vanishing moments. The wavelet based denoising process is shown in Figure 5.
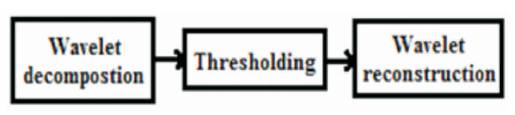
Figure 5. Block Diagram of Wavelet Based De- noising
The properties of this wavelet are asymmetric, orthogonal, and bi-orthogonal. In this paper, Db11 has been used to improve the SNR for the Lower Atmospheric signals [6]. Db11 wavelet is shown in Figure 6.
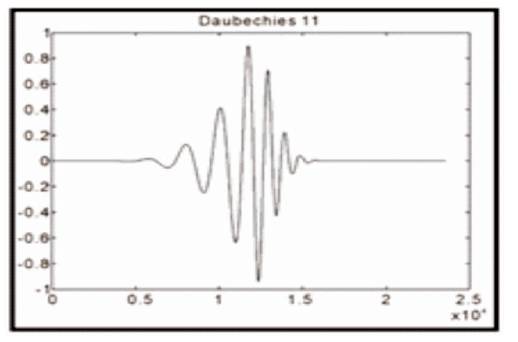
Figure 6. Db11 Wavelet
Wavelet thresholding methods for noise removal, in which the wavelet coefficients are threshold in order to remove their noise, where it was first introduced by Donoho in 1993. Wavelet thresholding is a signal estimation technique for signal denoising. It removes noise by killing coefficients that are insignificant relative to some threshold.
There are different ways to apply the threshold to the wavelet coefficients as represented in Figures 7(a) and 7(b). The signal is composed into L levels before thresholding is applied. There are two types of thresholding. Hard threshold is a "keep or kill" procedure and is more intuitively appealing and Soft thresholding shrinks coefficients above the threshold in absolute value [5]. The soft thresholding provides smoother results in comparison with the hard thresholding and soft thresholding avoids the discontinuities by shrinking the coefficients.
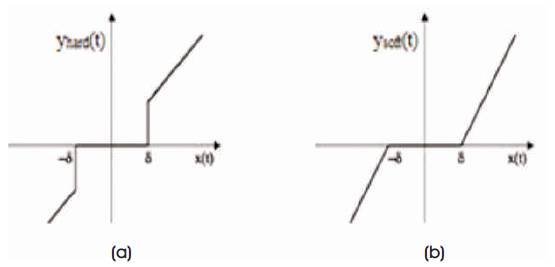
Figure 7. (a) Hard Thresholding, (b) Soft Thresholding
For all these reasons, the suitability of one or the other method depends on each particular application. Thresholding can be applied manually by selecting the desired coefficients at different levels.
Reconstruction of the signal using the appropriate coefficients of level N modify the detailed coefficients of the level from 1 to N.
Denoising is applied to LAWP Radar data on 20th August 20, 2014.
An Algorithm for Doppler profile using Db11 wavelet:
Doppler shift to the LAWP data on 20th Aug, 2014 in East and North directions using Peak Detection Technique are shown in Figures 8 and 9 respectively, and also in North direction using Db11 wavelet is shown in Figure 10. Figure 11 depits the SNR East, West and Zenith Directions.
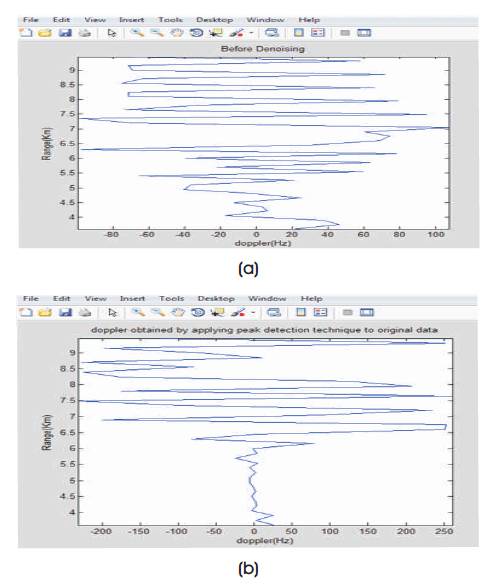
Figure 8. Doppler obtained for LAWP Data in EAST Direction (a) Before Denoising (b) After Denoising using Peak Detection Technique.
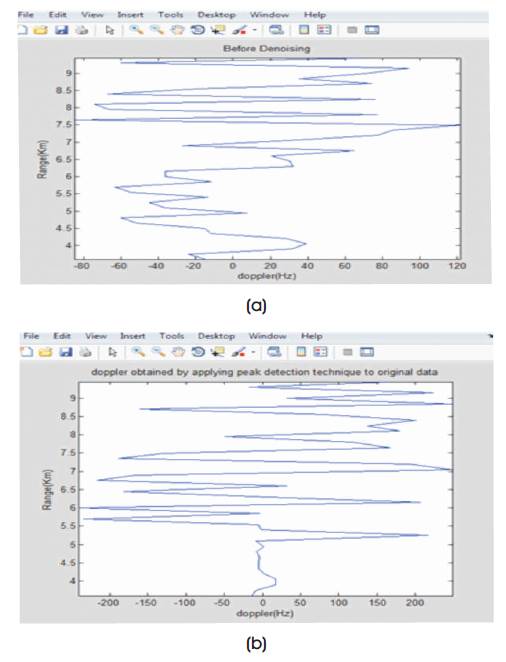
Figure 9. Doppler obtained for LAWP Data in North Direction (a) Before Denoising (b) After Denoising using Peak Detection Technique.
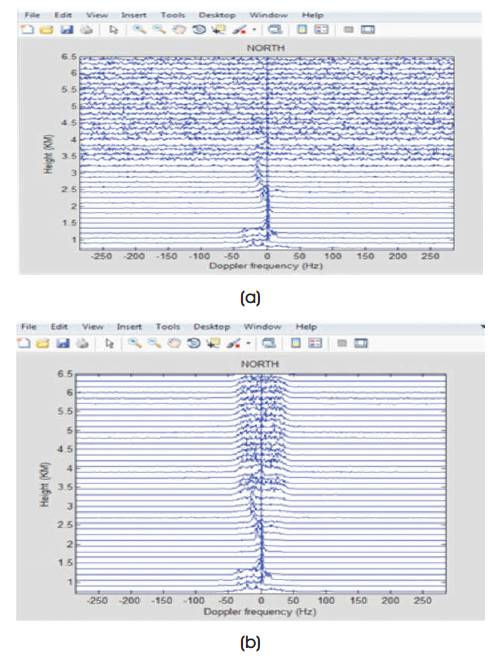
Figure 10. Doppler obtained for LAWP Data in North Direction (a) Before Denoising (b) After Denoising using Db11 Wavelet
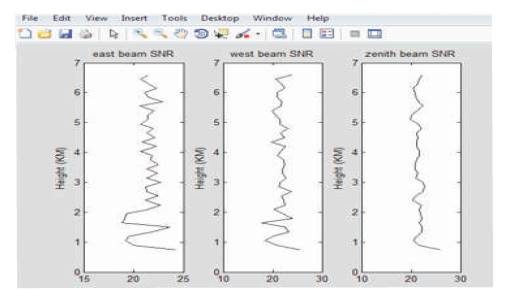
Figure 11. SNR in East, West, and Zenith Directions
Denoising using peak detection algorithm and Db 11 Wavelet has been applied to LAWP Data and compared. One vertical beam and four oblique beams pointed 0 towards 15 away from zenith are used to obtain the doppler velocities in the radial directions. The radial velocities of the wind profiler in U (East-West), V (North-South) and W (Zenith) directions have been shown in Figure 12. The improvement is observed by comparing before denoising data. The denoised data by using Peak Detection Technique and Daubechies Wavelet is 15 dB and 21.5 dB respectively. From the above discussion, it is concluded that an improvement of 21.5 dB is observed after denoising.
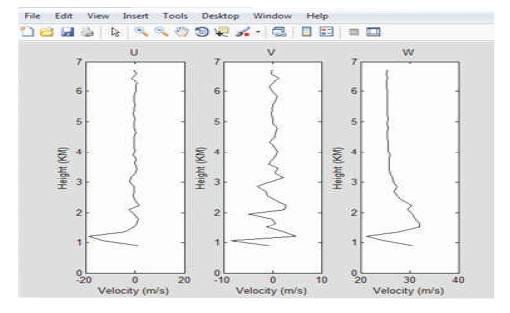
Figure 12. Wind Velocity in U,V and W Directions
Prof. D. Jayaraman, Director, Smt. P. Yashoda, Scientist/Engineer - SD, and P. Kamaraj, Scientist/Engineer - SD from NARL, Dept. of Space, Gadanki is gratefully acknowledged for supporting and providing the data.