Figure 1. Pedestrian Accidents by Year on Year in India (MORTH, 2019)
It is estimated that 1.35 million individuals expire from road collisions and that over 50 million people are injured globally last year. Road traffic deaths were predicted to be the world's third important reason of death by 2020, and minute work is done to reverse this trend. Road injuries include several dynamic variables that impact the accident to varying degrees and how to identify these variables and differentiate between relationships are the most important problems in trying to avoid and minimize black spots on the route. Based on the category of roads, five road stretches are selected for the study. Data collection are made by collecting the existing road features condition. 223 First Investigation Report (FIR) copies related to study area were obtained from the concerned 12 police stations for three years (2017,2018,2019). The main objectives of the project are analysis of different characteristics of the blackspot such as time of occurrence, type of injuries and the type of vehicle involvement in pedestrian accidents along the stretch. Weighted severity index is used to determine the severity of accidents. Identification of black spot location for pedestrians using kernel density tool in ArcGIS software. Identification of parameters contributing for accidents, and provide countermeasures to reduce the accident rate.
Road accident and fatalities has been increasing day by day leading to a major threat to the public across the globe. Road injuries arise from the interplay of various variables, some of which are road network length, number of cars, human population and adherence/enforcement to road safety regulations etc. Road crash causes accidents, deaths, disability and hospitalization in the world with significant socio-economic costs.
IRC definition for Blackspot on a road or stretch of road up to 500 m witnessing five or more road accidents or three fatalities in a calendar year. MORTH definition for Road accident Blackspot is a stretch of 500 m in length in which either 5 road accident (in all three years put together involving fatalities/grievous injuries) took place during last three calendar years or 10 fatalities (in all three years put together) took place during last three calendar years. There are several factors which are responsible for the road accidents in turn related to the severity of road accidents (Guifang et al., 2009; Latour, 2019).
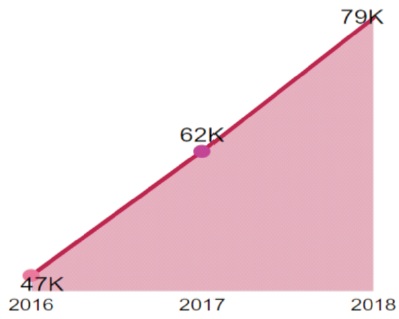
Pedestrians, cyclist and motorcyclists particularly those who are living in developing countries are disproportionately carrying the burden. It has been said that 3,11,614 pedestrians have died in the road traffic accidents in the global statistics. From the total road accidents of 4,67,000 it has been observed that there are 14.62 percent of pedestrian accidents involved in the year 2018 in India as shown in Figure 1. From the total road accidents of 41,700 is has been observed that there has been 10.81 percent of pedestrian accidents involved in the year 2018 in Karnataka state as shown in Figure 2 (Abdel-Aty & Radwan, 2000).
Figure 1. Pedestrian Accidents by Year on Year in India (MORTH, 2019)
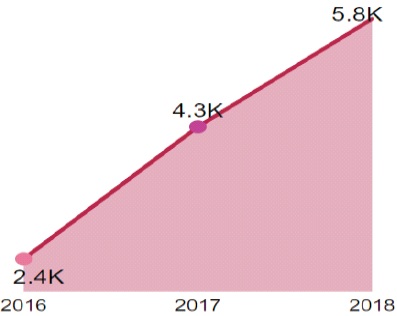
Figure 2. Pedestrian Accidents by Year on Year in Karnataka (MORTH, 2019)
The Ministry of Road Transport is more concerned with the formulation of specific broad policies regarding the regulation of road transport in the country. Improving the country's public road safety scenario in road transportation wing is the most critical and demanding task. Improving the vehicle technologies for the prevention of accidents is made a mandatory for all the vehicles.
Modern Methods for identification of blackspots are as follows:
The need for excessive computational resources, especially those considering different types of collisions as individual weights must be calculated for each of EB approaching them. Implementation is often avoided due to data restrictions particularly in comparatively sophisticated EB approaches. To overcome such shortcomings and to enable collection of higher amounts of data, a clusterbased procedure has been developed based on an evaluation method developed by Persaud et al. (1999).
It is a general belief that road accidents are unintentional occurrences and demonstrate a property of random distribution. In reality, road accident is a combination of the effects of numerous factors such as road condition, road environment, vehicle characteristics and pedestrian characteristics. In the recent years, Geographic Information Systems (GIS) have gained popularity as a spatial analysis tool making it easier to identify accident blackspots and to correspondingly rank them (Vemulapalli et al., 2017). It precisely displays the blackspots on the map and also stores the characteristics of each individual accident. GIS has the capacity to handle large amounts of assorted data, accident spot visualization and easy spatial analysis of traffic accidents (Erdogan et al. 2008; Lloyd 2010). Therefore, in order to overcome such shortcomings network-based spatial methods (network based kernel method, network-based K-function, network-based spatial auto correlation etc.) have been proposed by numerous studies in recent years. Due to the intense nature of the computation involved, the use of network-based spatial method are forbidden despite its rising popularity (Liu, 2013; Vemulapalli et al., 2017).
The KDE method is a regularly used BSID method (Harirforoush & Bellalite 2016; Vemulapalli et al., 2017). In KDE study, there is a spatial accumulation of the number of the accidents in road segments and with the help of segment wise accident concentration, blackspots are calculated for each segment. Typically, the road network can be divided into uneven or even-length cells although the previous is less favored because densities are not exactly comparable in network cells. SANET-KDE has been designed to resolve this shortcoming by expanding the standard KDE into unbiased, non-parametric continuous incidence in estimating injuries (Okabe & Sugihara, 2012). A network histogram is then created, despite its ease and simplicity of application. This method generates skewed findings because the predicted distribution of likelihood density is not a continuous process because it should be in the real world (Zahran et al., 2019). SANET-KDE has been designed to resolve this shortcoming by expanding the standard KDE into unbiased, non-parametric continuous incidence estimate of road injuries. (Hauer, 1980; Okabe & Sugihara, 2012). Network KDE analysis has found greater suitability in Points analysis (e.g., traffic accidents) which happens inside a one-dimensional space (e.g., a road). The Road Analysis Centre has established a comparatively modern approach (Chen et al., 2018; Xie & Yan, 2008). It is an extension of the KDE approach which estimates the probability density function of the event points through the use of a kernel function (Bíl et al., 2016). Another significant improvement made to the KDE method is its ability to perform early analysis of each individual road traffic accident occurrence in two-dimensional space conducted in one-dimensional space instead (Harirforoush & Bellalite, 2016). The kernel function based on Euclidean space and network distances is given in Figure 3. The general form of KDE is given below:
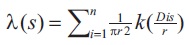
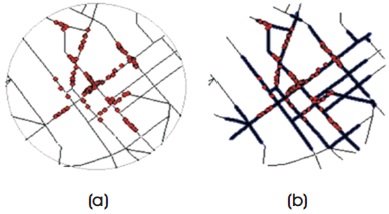
Figure 3. (a) Kernel Function Based on Euclidean Space and (b) Kernel Function Based on Network Distances (Source: Mohaymany et al., 2013)
Here, (s) is the density at location s, r is the search radius (bandwidth) of the KDE (only points within r are used to estimate (s)), k is the weight of a point i, at distance Dis to location s. The parameter k is usually modelled as a function (called kernel function) of the ratio between Dis and r (Xie & Yan, 2008).
Kriging is another advanced form of spatial analysis and has wound a wide application in numerous domains (Ver Hoef et al., 2018). In comparison to Kernel Density Estimation, Kriging has proven to be a superior method of BSID based on its application in the United States (Thakali et al., 2015).
In the interface between pedestrians and vehicles zone unit it has been observed that the preliminary issue is that the actions of pedestrians have disturbed the cars and so affected the smoothness of urban transportation. In a study it is observed that the general trends in pedestrian accidents based on a geographic layer has been used to classify all signalized traffic intersections, lighting, and road users at the fault. In addition, to the concerns of protection of pedestrian act of various kinds by evaluation of crosswalks by visual roadway inventory methods. In a study Pedestrian enumeration signals are installed for estimation of timer clocks, which shows the entire time left out in seconds for pedestrians to cross the intersection before the end of their crossing time. A study has been made on the existing problems for the pedestrians on the footpaths based on a data sets collected in different streets in cities and the counter measures required to solve the problem has also been established.
Extensive work has been done for identification of vehicular black spots but insufficient work is done for identification of pedestrian black spot (Chen & He, 2012; Dereli & Erdogan, 2017).
The main objectives of the work are:
Major steps involved in methodology are shown in Figure 4. Selection of road stretches based on the category of roads, data collection by collecting the existing road features condition, FIR copies from the traffic police station for three years (2017, 2018, 2019). In Data analysis, the collected FIR are classified based on the time, day, type and nature of accidents.
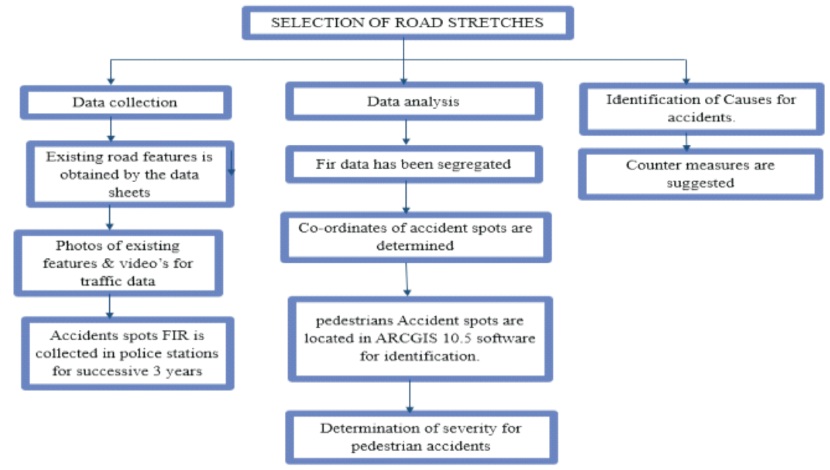
Figure 4. Steps Involved in Methodology
ArcGIS software is used for identification of vehicular and pedestrian accident locations based on the accident density rather Weighted severity index is used to determine the severity of accidents. Identification of defects and counter measures are suggested (Abdulhafedh, 2017).
Five different road stretches are considered based on category of the road. Details of the stretches are shown in the Table 1.
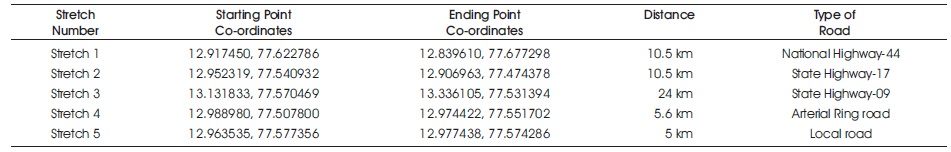
Table 1. Details of Road Stretches
Stretch 1: In this study we have considered 10.5 kilometer stretch of road starting from Rupeena Agrahara to Veerasadra junction which includes major junctions like Singasandra junction, Naganathpura and Konnapana Agrahara.
Stretch 2: In this study we have considered 10.5 kilometer stretch of road starting from Byataranapura to Doddabele junction which includes major junctions like Nayandahalli junction, Raja Rajeshwari Nagar junction and Mailsandra junction.
Stretch 3: In this study we have considered 24 kilometer stretch of road starting from Avalahalli to Palanjogihalli which includes major junctions like Honnenahalli, Rajanukunte, Marsandra, Bashettihalli and Doddaballapur cross.
Stretch 4: In this study we have considered 5.6 kilometer stretch of road starting from Ashraya hospital to Prasanna theatre which includes major junctions like Vijayanagar tollgate, Kamakshipalya, Kottigepalya and Sunkadakatte.
Stretch 5: A local road stretch of 5 km has been selected for the study which connects the locations like Annapoorna Junction, Minerva circle and Tank bund roads which is in the center of Bangalore city.
Field existing road features in the accident spots are obtained by the data sheets which consist of location details, road geometric details, road surface conditions, pedestrian facility details, road safety furniture details and speed of vehicles are recorded using radar gun.
223 First Investigation Report (FIR) copies related to study area were obtained from the concerned 12 police stations. Later FIR data were classified into their detailed site location, time, date, type of vehicle, human involved in accidents and other details.
Based on the classification of data, in stretch 1 it is determined that in night time there are 14 and in day time there are 20 pedestrian accident, stretch 2 it is determined that in night and day time there are 15 pedestrian accidents, stretch 3 it is determined that in night time there are 3 and in day time there are 9 pedestrian accidents, stretch 4 it is determined that in night time there are 1 and in day time there are 3 pedestrian accidents and in stretch 5 it is determined that in night time there are 12 pedestrian accidents and in day time there are 12 pedestrian accidents as shown in Figure 5. Highest day pedestrian accidents are seen in the Stretch 1.
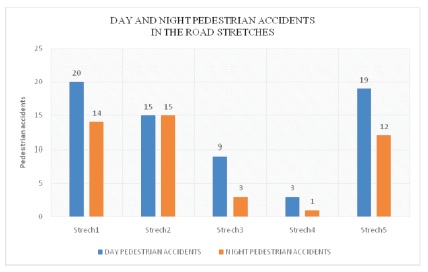
Figure 5. Pedestrian Accidents Based on Time in the Five Road Stretches
Based on the classification of data on type of injuries it is identified that in stretch 1 minor injuries are 19, grievous injuries are 7 and fatal are 8 for the pedestrian accidents, stretch 2 minor injuries are 19, grievous injuries are 2 and fatal are 6 for the pedestrian accidents, stretch 3 minor injuries are 10 and fatal are 4 for the pedestrian accidents, Stretch 4 minor injuries are 3 and fatal is 1 for the pedestrian accidents and in stretch 5 minor injuries are 17, grievous injuries are 4 and fatal are 13 for the pedestrian accidents, as shown in Figure 6. Highest minor and Grievous injuries are seen in stretch 1 and highest fatalities in stretch 5.
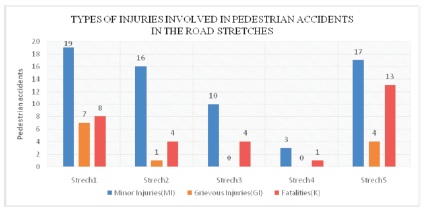
Figure 6. Pedestrian Accidents Based on Type of Injury in the Five Road Stretches
In motorized vehicle categories causing pedestrian accidents it is realized that two-wheelers accounted for the highest share in total road accidents (40%) followed by the combined cars category of vehicles (19%), auto rickshaws (3%), buses (22%), then the combined vehicle category comprising trucks, lorries, tempos, tractors and other articulated vehicles (8%) and low commercial vehicle like tempo traveller, tata ace and canters (8%) as shown in Figure 7.
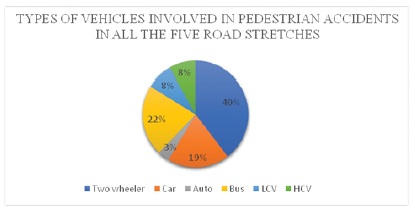
Figure 7. Pedestrian Accidents Based on Type of Vehicle in Five Road Stretches
The key purpose of the study is to recognize the possible accident-prone areas in the stretches of the road considered. Data collection is the inclusion of the gathering of on-road crash data for the previous three years (2017-2019) from the police department concerned and the accident data were analyzed using a weighted severity index method (WSI). This severity method assigns values founded on amount of accidents and their severity at that specific location. The number of deaths has been in
three degrees, including fatality, serious injury and minor injury. Weight of the injuries were found by incident attributes such as the place of the crash, number of wounded people and number of fatal incidents in the accident. To determine the severity of accidents in the blackspots based on weights assigned for minor, grievous and fatal injuries the formula is given by:
WSI = (41 x K) + (4 x GI) + (1 x MI) (Source: Sandeep Verma and Jubed Khan)
where,
GI- Grievous Injury (GI)
K-Fatal (K)
MI-Minor Injuries (MI)
Locations with WSI value above 40 is termed as blackspot and above 100 were considered high severity blackspots. The locations and their rankings are provided in the Table 2.
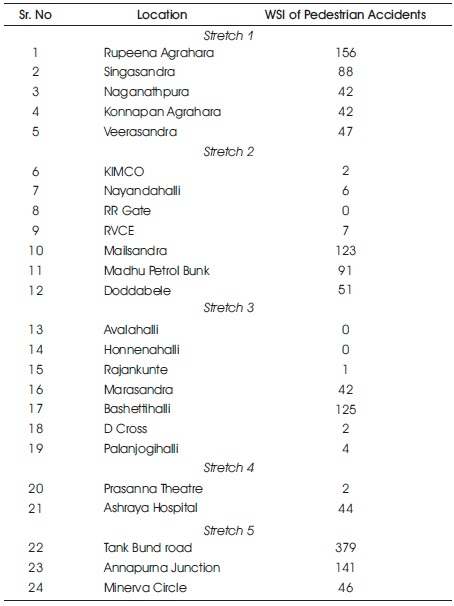
Table 2. WSI Value of Pedestrian and Total Accidents in All the Five Stretch
In Stretch 1, pedestrian blackspots identified are Rupeena Agrahara and Singasandra locations. Amongst them Rupeena Agrahara has been designated as a high severity blackspot with WSI of 156.
In Stretch 2, pedestrian blackspots identified are Mailsandra, Madhu petrol bunk and Doddabele locations. Amongst them Mailsandra has been designated as a high severity blackspot with WSI of 123.
In Stretch 3, pedestrian blackspots identified are Marsandra and Bashettihalli locations. Amongst them Bashettihalli has been designated as a high severity blackspot with WSI of 125. In Stretch 4, pedestrian blackspots identified are Ashraya hospital locations with WSI of 44.
In Stretch 5, pedestrian blackspots identified are Tank bund road, Annapoorna junction and Minerva locations Tank bund road and Annapoorna junction amongst them has been designated as a high severity blackspot with WSI of 125.
The latitude and longitude of accidents locations from the FIR data are located and the blackspots for pedestrians in these five stretches are identified using kernel density which is a spatial analyst tool in ArcGIS software. Calculates a point or polyline region per device using a kernel feature to match a smoothly balanced surface to either point or polyline. Larger parameter values of the search radius generate a simpler, more universal raster of densities and the measured bandwidth may seem excessively high as shown in Figure 8.
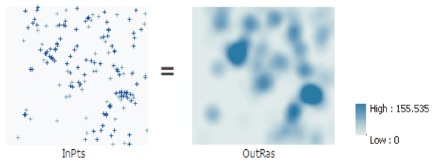
Figure 8. Kernel Density Output for Cluster of Points
The pedestrian accident locations in the stretch 1 are located and the kernel density output is obtained as shown in Figure 9.
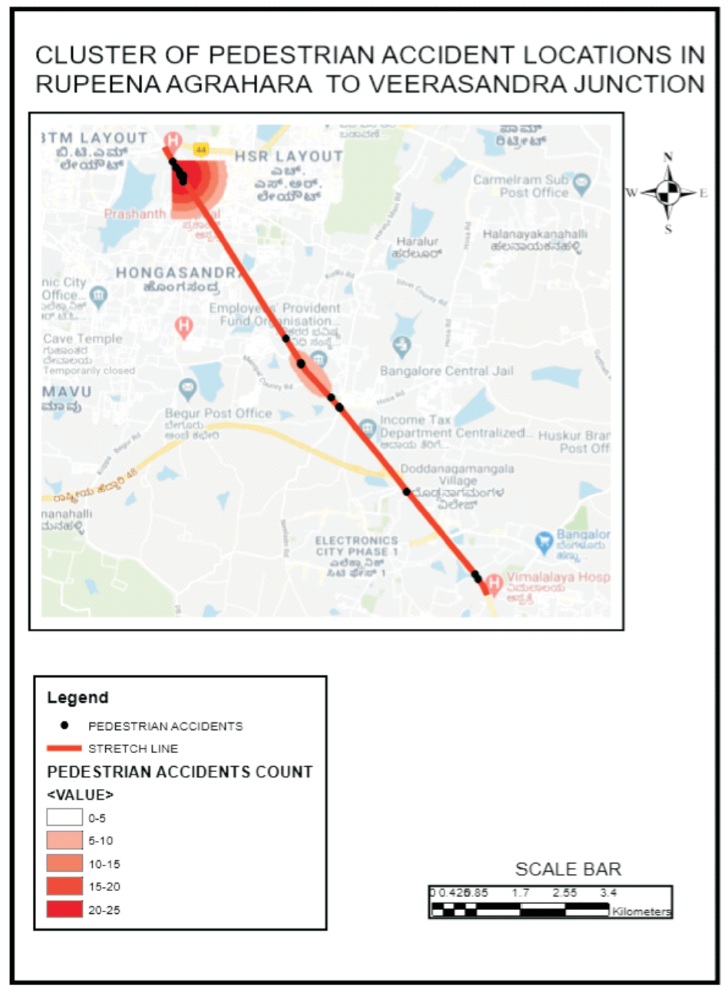
Figure 9. Kernel Density for Pedestrian Accidents Locations in Stretch 1
It is determined that high pedestrian accidents clusters are seen in the Rupeena agahara and Singasandra locations.
The pedestrian accident locations in the Stretch 2 are located and the kernel density output is obtained as shown in Figure 10.
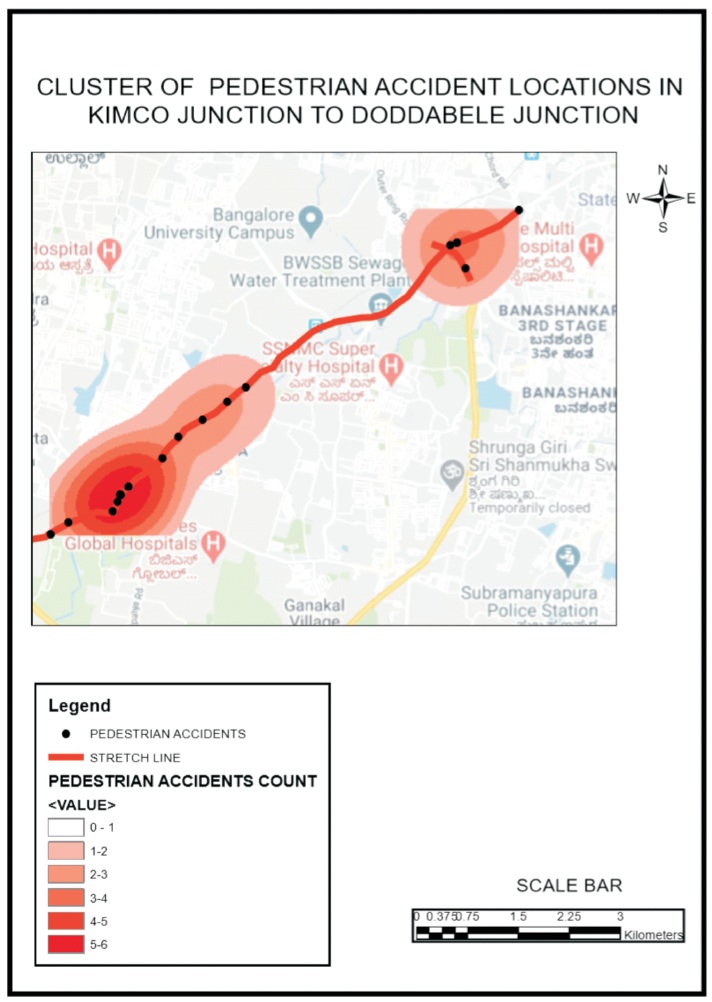
Figure 10. Kernel Density for Pedestrian Accidents Locations in Stretch 2
It is determined that high pedestrian accidents clusters are seen in the Mailsandra, Madhu petrol bunk and Doddabele junctions.
The pedestrian accident locations in the stretch 3 are located and the kernel density output is obtained as shown in Figure 11. It is determined that high pedestrian accidents clusters are seen in the Marsandra and Bashettihalli.
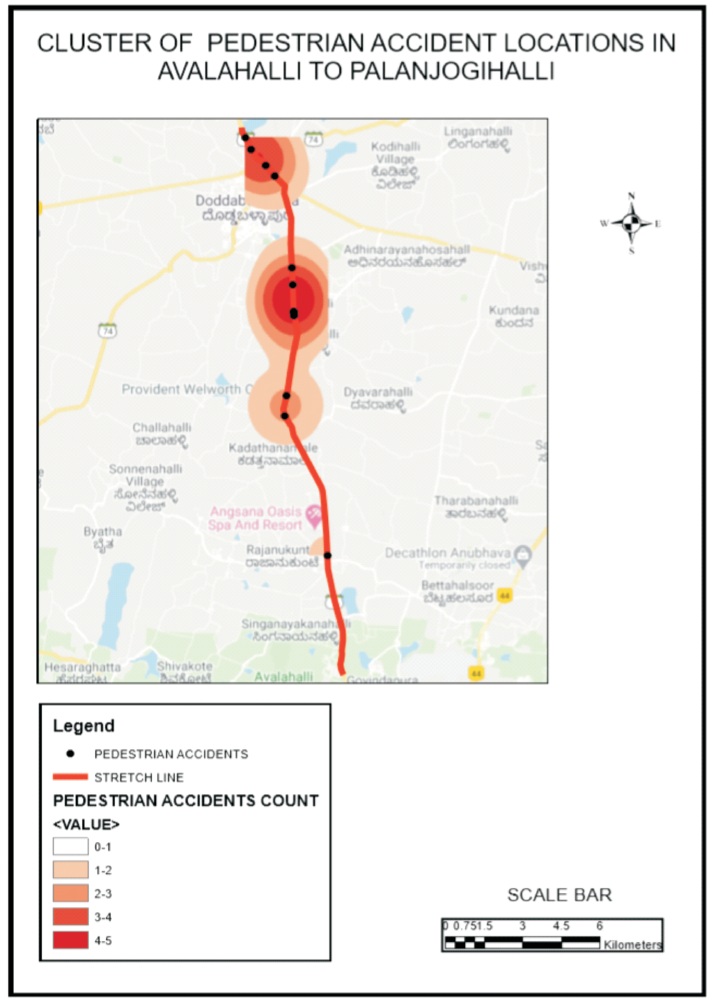
Figure 11. Kernel Density for Pedestrian Accidents Locations in Stretch 3
The pedestrian accident locations in the stretch 4 are located and the kernel density output is obtained as shown in Figure 12.
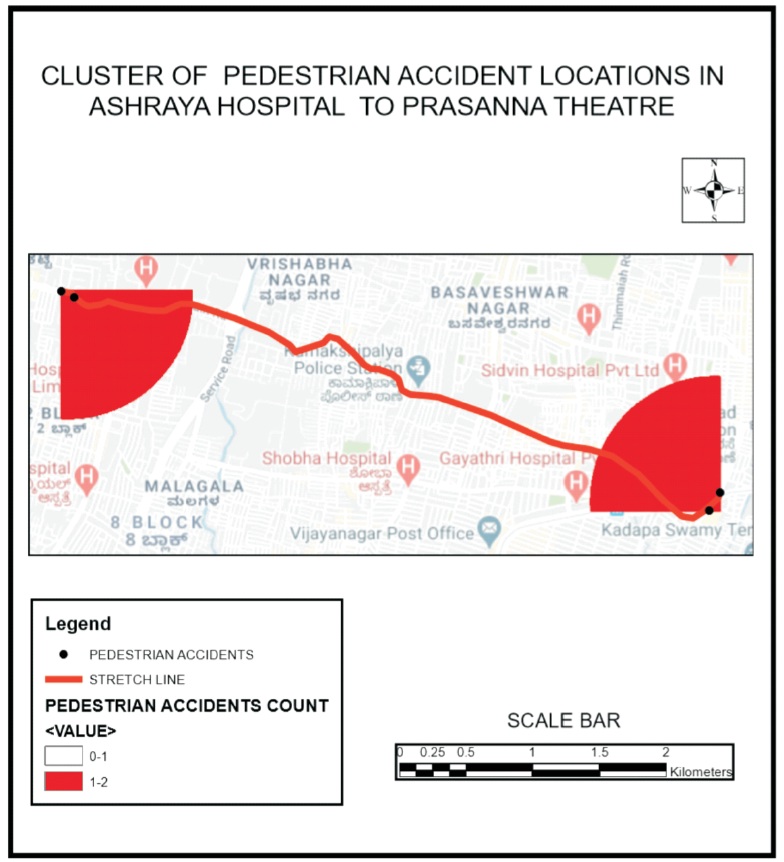
Figure 12. Kernel Density for Pedestrian Accidents Locations in Stretch 4
It is determined that high pedestrian accidents clusters are seen at Ashraya hospital and Prasanna theatre.
The pedestrian accident locations in the stretch 5 are located and the kernel density output is obtained as shown in Figure 13.
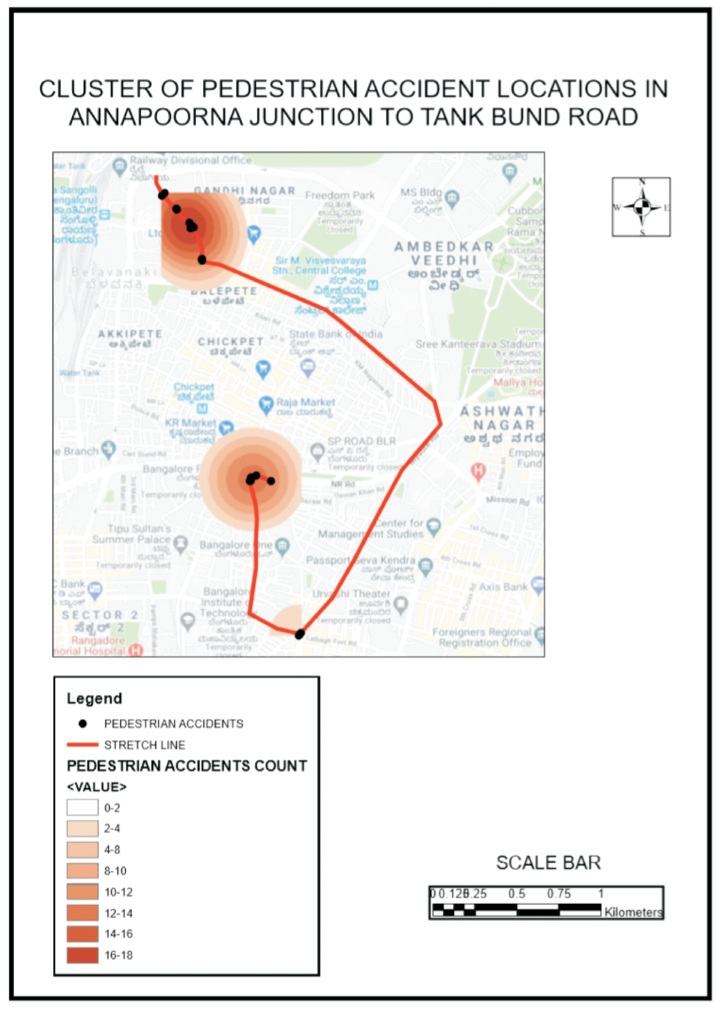
Figure 13. Kernel Density for Pedestrian Accidents Locations in Stretch 5
It is determined that high vehicular and pedestrian accidents clusters are seen at Tank bund road, Minerva junction and Annapoorna junction.
The defects identified and suitable countermeasures for improvement in the road stretches are discussed as follows:
Pedestrian accident blackspots can be potentially identified by ArcGIS software and WSI values were determined for pedestrian and total accidents. A few number of solutions have been studied and proposed in order to reduce the accidents in the study areas. It can be concluded from the study as follows:
Pedestrian volumes in the road stretch is to be considered for the study to provide a much precise countermeasures for the improvements of pedestrian safety
After the improvement in pedestrian blackspots, post improvement studies need to be conducted to study the performance of improvement measures.