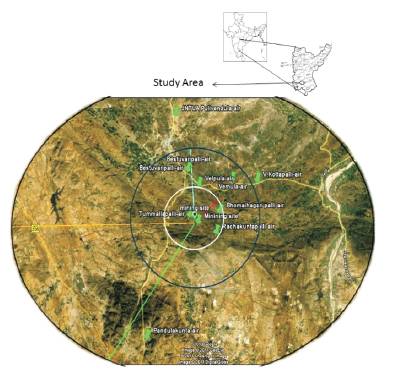
Figure 1. Geographical View of Study Area (Courtsey: Murad Bhasha et.al, 2013)
Monitoring and reporting of air pollutants released from mining activities is a mandatory routine practiced all over the world. Air quality modeling was performed using WRF-CALPUFF model to predict dispersion of the emissions from mining operations. PM2.5 and PM10 emissions were observed continuously using high volume air samplers at two ambient monitoring locations (AML-1&AML-2) near Tummalapalle Uranium mine in Y.S.R. Kadapa district, Andhra Pradesh, India. Prime concern was to assess current possible discharge of PM10 , PM2.5 and to predict potential emission of particulate matter, SO2 , NOx and airborne dust containing uranium into the atmosphere from mine. Measured concentrations of PM10 and PM2.5 from monitoring locations were compared with CALPUFF model predictions. Four statistical indicators have been computed to determine the models' ability to simulate observations. Statistical analysis indicated that, California Puff (CALPUFF) model has a tendency to under predict and the overall model's performance for two monitoring stations (AML-1&AML-2) was found to be good for PM10 when compared with PM2.5 (at AML-2 some statistical values were beyond the model acceptance range). The index of agreement varied from 0.39 to 0.43 and the total NMSE ranged from 0.08 to 8.36. The average 24hr peak concentrations of CALPUFF estimated pollutants (PM, SOx , NOx ) including uranium containing dusts were well within the Air Quality Standards (NAAQS and CPCB).
Nuclear power generation has gained importance recently with the increased energy needs in India. The mining in Y.S.R. Kadapa district by Uranium Corporation of India Limited (UCIL) is proposed to meet the requirements of Uranium for nuclear power industry in India. Different mining activities might contribute to the release of numerous air borne contaminants into the atmosphere, ensuing significant health effects.
Murad Basha, A. et.al (2013, 2014) carried out various studies to analyze different aspects of environmental impact of particulate matter released from the Tummalapalle mine, regarding trace-metals analysis, estimation of Combined Air Quality Index (CAQI) and assessment of Uranium levels in and around Tummalapalle mining site. Radioactive emissions from this mine were reported by Rana B.K. et.al (2015). Ambient monitoring of mine emissions and their sources simply cannot account for the complete assessment of air pollutants dispersion. Employing air dispersion modeling techniques will explain their distribution in space and time. Pollutant Dust dispersion modeling is a systematic computational procedure for predicting concentrations downwind of the source, based on the emission data characteristics (stack exit velocity & diameter, plume temperature), terrain (surface roughness, local topography, nearby buildings) and state of the atmosphere (wind speed, stability, mixing height, etc.). AERMOD and the California Puff model (CALPUFF) are used extensively (preferred by USEPA) to assess air pollution phenomenon. CALPUFF is a puff dispersion model designed to obtain the dispersion of gases and particles from different source like point, line, area and volume. This model considers the dry deposition using the resistance method with deposition velocities and wet removal by means of precipitation intensity and type. It provides hourly calculations of dispersed concentrations from different emission sources. RAMS /CALMET /CALPUFF were used to investigate winter time dispersion and to simulate a particle pollution occurrence over Christ Church, New Zealand (Barna M.G, 2002). Weather Resource Forecasting model (WRF) generates meteorological data. Hyung Don Lee et.al (2014) used WRF–CALPUFF coupled modeling system to estimate the PM10 and SO2 concentration distributions and its performance was compared with CALPUFF model. DongXie (2012) carried out extensive work on measuring and distribution of Radon from Uranium ventilation shaft using three dimensional CFD models and they recommended considering complete wind-profile, large physical model, ambient temperature, shaft height and outlet flow rates for accurate simulations.
CALPUFF model used to simulate pollutant dispersions and health consequences of gaseous and suspended metal particulate pollutants from various pollution sources and regions (Villasenor R, 2003, Lopez M.Z, 2005, Song Y.Z, 2006 and Ghannam K, 2013). A good deal of the research has been focused on large-scale by employing various dispersion models with the help of high volume air samplers (Sivacoumar R. K, 2001, Hall D.J, 2002, Caputo M.M, 2003). Vardoulakis S.F. et.al (2003) and Ellis K.M, et.al (2001) employed meteorological data, to estimate the potential impact of industrial releases on sensitive and residential areas as well as on surrounding environment. W.R. Reed et.al (2005) reviewed different dispersion models for mining operations. Hurley P.P, (2003) suggested CALPUFF and TAPM as useful tools for regulatory purposes. Jeong H.J et.al (2005), discussed increasing demand of dispersion models and their importance in nuclear applications and biological toxins releases. Wein L.M. et.al (2003) summed up the significance of analytical advances in dispersion modeling in their review.
The emission of heavy metals into the terrestrial environment from various industrial processes such as smelting, refining, processing and manufacturing and from transport has been extensively studied (Cawse P. P,1972, 1974) and (Duggan M. B, 1983). From the literature mentioned, it was observed that CALPUFF presents a rational agreement with pollutant concentrations in the validation studies. However, CALPUFF model was sparsely used in India and very few works were reported on air quality modeling of mine emissions. In this regard, an effort is made to model the air quality around the mine using CALPUFF model and to understand the atmospheric dynamics. Predicted values from CALPUFF model were validated with the measured PM10 and PM2.5 values using high volume air sampler.
Tummalapalle mine area measures 973.61 ha, encircling agricultural land (432.76 ha), infertile land (475.85 ha) and grazing land (65.00 ha). Geographical view of the mining site was shown in Figure 1. Study site is in the vicinity of a rural hilly area and is 15 kilometers away from Pulivendula town (by road) towards the north-west direction. The ore from this underground mine is processed by a hydro-metallurgical process to extract the uranium as crude salt, Magnesiumdi- uranate (yellow cake) and then the salt is sent for further processing (MECON Limited 2011). The mine area and bordering villages lie in the tropical region in south India, with the climate of very hot summers (maximum 46o C - minimum of 15o C), mild winters (maximum 40o C - minimum of 10o C)and monsoon rains (June-September) .
Figure 1. Geographical View of Study Area (Courtsey: Murad Bhasha et.al, 2013)
To study the behavior of pollutants released from the mine, a 50X50 km modeling domain (Table 1) with mining facility at the centre was considered. The study area is in the UTM Zone 44P and two ambient monitoring locations (AML-1- Near mine (205.398/15849.49) & AML-2-Bhumaigaipalle village (208.903/1585.971)) were selected within the modeling domain. AML-1 was within 0.52 km radial distance and the other monitoring station AML-2 was within a radial distance of 3.9 km from the mine reference point (Boiler Stack-205. 815, 1584.694) (Figure 1). This domain encompasses many villages, agricultural, infertile and grazing areas. This domain was chosen large enough to incorporate the major emission sources related to the study area, to interpret land differences in elevation and land use, and to include sensitive receptors (only schools) of concern.
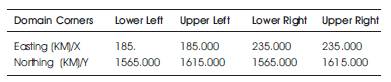
Table 1. CALMET Modeling/Study Area Co-ordinates
Terrain elevations and land use within the domain with a topographical view were shown in Figure 2. The gridded geophysical data including land use and terrain height were generated from the U.S. Geological Survey (USGS) terrain and the land use database.
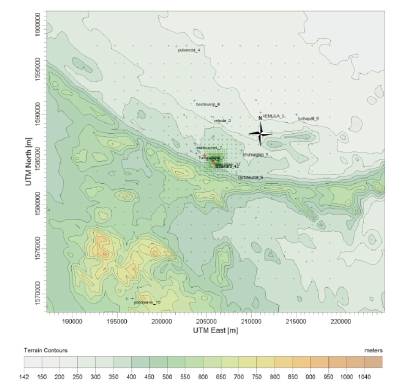
Figure 2. Topographical Representation of Modeling Domain
Simulated wind roses for the study area were generated using WR PLOT software (Figure 3). Wind rose was imposed on mine area using Google Earth, for better understanding of wind flow (Figure 4). PM10 and PM2.5 were measured using high volume air samplers at two ambient monitoring locations (AML-1& AML-2) for five days period from 15-07- 2013 to 19-07-2013.
Figure 3. Wind Rose Diagram from 15-07-2013 to 19-07- 2013
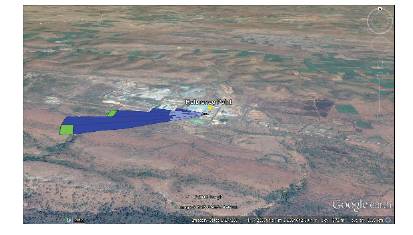
Figure 4. Wind Rose imposed on Site using Google Earth
Site specific data (site plan, estimate emission rate and source emission parameters) and site meteorological conditions during this five day period were collected. Weather Research and Forecast (WRF) model ready data for CALMET-CALPUFF model with a WRF resolution of 4 km and a 50x50 km domain was used to produce CALMET meteorological fields for this study period. This domain had 35 vertical layers, with lower layer at 20 m from the ground level. The produced CALMET output file was used as theinput file for the CALPUFF model. PM10 , PM2.5 , SO2 and NOx and airborne dust containing uranium were predicted using the CALPUFF model.
Atmospheric pollution may result due to long term, continuous releases from the mine emissions of the following pollutant sources.
Three open piles of uranium ore and milling operation wastes and vehicular discharges may be responsible for PM10 , PM2.5 and uranium containing dust. Boiler stack, the vehicles used for personnel transportation and the ore and waste carrying trucks were considered as the potential sources of emission for SO2 and NOx , in CALPUFF simulation input.
For the model validation and performance evaluation, PM10 , PM2.5 , SO2 , NOx and airborne dust containing uranium concentrations were predicted using the CALPUFF model at two locations namely, AML-1& AML-2. To assess the model performance, Fractional Bias (FB), Index of agreement (IOA) (Willmott J.Cort, 2012) commonly referred as (d), Pearson Correlation co-efficient (R), Normalized Mean Squared Error (NMSE) corresponding values were calculated. IOA is a standardized measure of the degree of model prediction error and varies between 0 (theoretical minimum) and 1 (perfect agreement between the observed and predicted values). If the value of IOA is in the range 0.4 < d < 1.0, then the model is said to be performing well. In the Normalized Mean Square Error (NMSE), the deviations (absolute values) are added instead of the differences thereby, it illustrates the most prominent distinctions among models. NMSE gives an estimation of the overall deviations between predicted and measured values when population is small and it is the Root Mean Squared Error (RMSE) divided by data's standard deviation. If a model has a very small NMSE (varies between 0 and 1) then it is executing the sound both in space and time. Fractional Bias (FB) normalizes the concentration values to dimensionless values and these values vary between –0.5 and +0.5; negative values of FB indicates the model is over predicting, positive value implies the model is under predicting and zero represents an ideal model (Chang J.C. et.al 2004). The Pearson correlation co-efficient R explains the correlation between simulated and observed values. R, a perfect correlation coefficient is only a necessary, but not sufficient, condition for a perfect model. In the present study, we mainly focused on IOA and NMSE for testing the model performance and skill.
The main objective of this work is to predict the air pollutants released from the uranium mine using CALPUFF model and evaluate the model performance by comparing the predicted values with the HVAS measured values. Both concentrations of airborne HVAS measured PM10 and PM2.5 and the predictions from the CALPUFF model at the selected locations AML-1 & AML-2 were reported in the Table 2. Furthermore, SO2 and NOx and airborne dust containing Uranium were also predicted using the CALPUFF model and were reported in Table 2 as well.
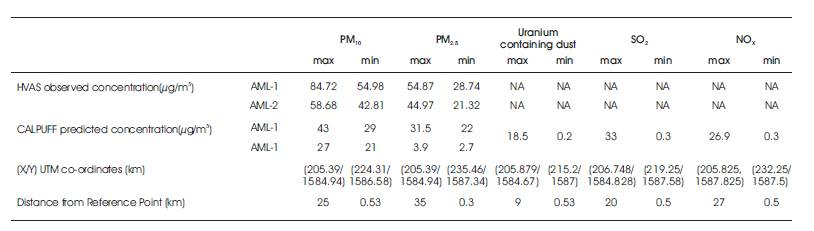
Table 2. Quantitative Comparison of the Model Results
Graphs 1 and 2 shows the graphical representation of measured and predicted values of PM10 for five days study period, at AML-1 & AML-2. Further, in 24hr, the averaged values of PM10 were presented in Table 2. PM10 maximum concentration of 84.72μg/m3 was observed and minimum concentration of 54.98μg/m3 was observed at AML-1. Maximum concentration of 58.68μg/m3 and minimum concentration of 42.81μg/m3 was observed at AML-2 with HVAS. Whereas, maximum average 24 hr concentration of 48μg/m3 and a minimum average 24 hr concentration of 37μg/m3 were predicted at AML-1. At AML-2, PM10 simulated plume concentration varied from a maximum of 45μg/m3 to a minimum of 39μg/m3 . Concentration distribution of PM10 simulated plume ranged from 61 μg/m3 inside the mine premises to a minimum of 0.7μg/m3 at discrete receptor with UTM co-ordinates (224.31, 1586.58) for the modeling period.
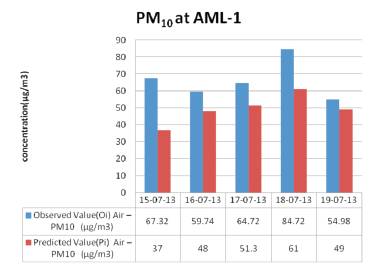
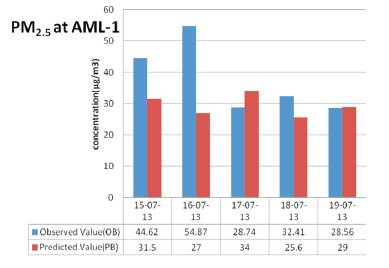
Graph 1. Observed Values and CALPUFF VS Predicted Values at AML-1
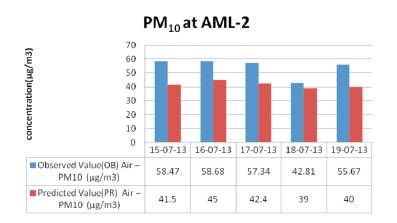
Graph 2. Observed Values and CALPUFF VS Predicted Values at AML-1
Figure 5 depicts an instance of simulated plume dispersed up to 25 km from the reference point towards North-east direction. Figure 6 displays the imposition of PM10 plume on Google Earth, apparently demonstrates the synchronized dispersion of PM 10. Figure 7 clearly illustrates the terrain elevation changes in the form of 3-Dimensional vertical exaggerated view. Land use type codes were shown in Figure 8, explains that the modeling domain consisted mainly of agricultural and range lands with a rural background.
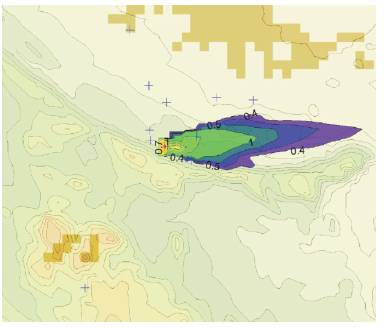
Figure 5. PM10 (averaged 24hr) Plume Dispersion over Modeling Domain
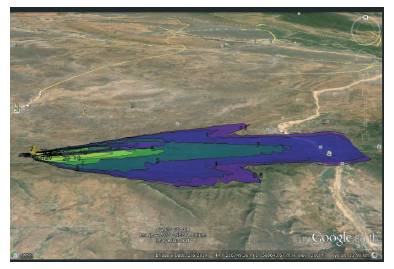
Figure 6. PM10 Dispersion imposed over Modeling Region using Google Earth
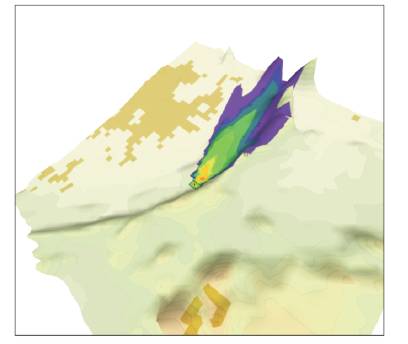
Figure 7. D-Vertical exaggeration of PM10 plume dispersion over modeling terrain
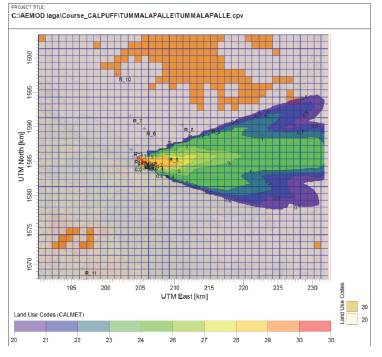
Figure 8. Land use codes simulated from CALMET processor
High volume air sampler recorded a maximum concentration of 54.87μg/m3 for PM2.5 and minimum concentration of 28.56μg/m3 at AML-1 and a maximum concentration of 44.97μg/m3 and minimum concentration of 21.32μg/m3 were observed at AML-2 (Graphs 3 and 4). PM2.5 plume dispersed up to 35 km towards North East direction (Figure 9). For PM2.5 maximum concentration of 59μg/m3 was recorded near mine entrance and a minimum concentration of 0.3μg/m3 was noticed at receptor located at (235.46, 1587.34). Maximum average 24 hr concentration of 34μg/m3 and a minimum average 24 hr concentration of 25.6μg/m3 were predicted at ambient monitoring location 1 (AML-1). A maximum average 24 hr concentration of 3.9μg/m3 and a minimum average 24 hr concentration of 2.7μg/m3 for PM2.5 were predicted in CALPUFF simulation at AML-2.
Graph 3. PM2.5 Observed values and CALPUFF vs. Predicted Values at AML-2
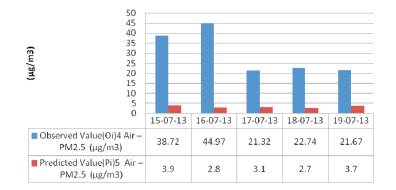
Graph 4. Observed Values and CALPUFF vs. Predicted Values at AML-2
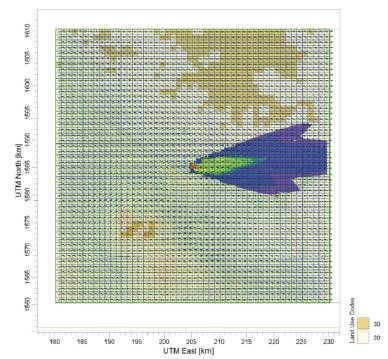
Figure 9. PM2.5 dispersion (avg.24hr) with land use and wind field distribution
Figures 10 and 11 show the airborne dust containing Uranium plume dispersion with wind field distribution and vertical amplified vision. We can observe that, the wind speeds were in the range of 6.6-16.8 m/s. Air borne dust containing Uranium plume dispersed upto 10 km in North- East direction (Figure 10). Maximum concentration of 18.5μg/m3 was predicted at a receptor located nearer to the mine fencing and a minimum concentration of 0.2μg/m3 was predicted at discrete receptor (215.2, 1587) which is approximately at a distance of 1 km from the reference point.
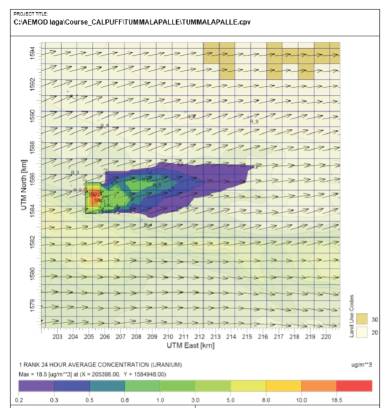
Figure 10. Uranium Dust (avg. 24hr) Dispersion over Modeling Domain
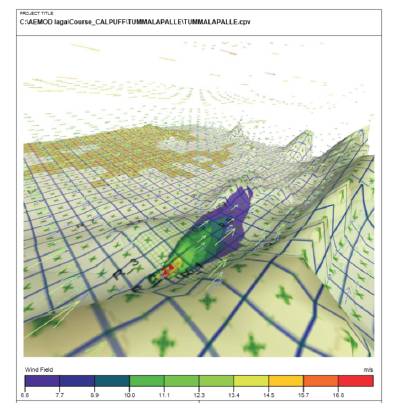
Figure 11. Uranium Plume 3D Vertical Exaggeration with Wind Field Distribution over Modeling Domain
SO2 plume was extended upto 20 km (Graph 5), with a maximum concentration of 33.2μg/m3 at discrete receptor (206.748, 1584.828) and minimum concentration of 0.3μg/m3 at discrete receptor (219.25, 1587.58).
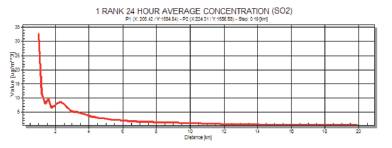
Graph 5. CALPUFF Predicted values of SO2concentration vs. distance
NOx simulation plume dispersed up to 27 km (Graph 6)with maximum concentration of 26.9μg/m3 at discrete receptor (205.825, 1587.825) and minimum concentration of 0.3μg/m3 at discrete receptor (232.25, 1587.5) respectively.
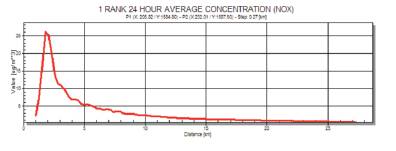
Graph 6. CALPUFF Predicted values of NOx concentration vs. distance
The agreement of model predictions with observations was evaluated using statistical analysis and following ascertains were perceived. Statistical parameters were reported in Table 3. The results in Table 3 show that, Index of Agreement (IOA) which is also known as degree of model prediction error (d) ranged from 0.3869 to 0.4247 at AML-1 and AML-2 [typical values: IOA (0.4247 and 0.4341 for PM10 , 0.4177 and 0.3869 for PM2.5 )]. IOA values above 0.4 indicate that model is said to be performing good. NMSE values for PM10 are 0.1124 and 0.0844 and 0.1838 to 8.3599 for PM2.5 respectively. The small NMSE values entail that model is good for PM10 at AML-1 and AML-2 and for PM2.5 at AML-1. But NMSE value for PM10 at AML-2 is beyond the model acceptance range implies that model performance is poor. Fractional Bias (FB) values were 0.2949 and 0.2706 for PM 10 , 0.2504 and 1.6087 for PM2.5 , all the values of FB were positive means, thus, CALPUFF model is under predicting. The Pearson correlation co-efficient ”R” illustrates the correlations between simulated and observed PM10 and PM2.5 concentrations at all sites. R values (0.5453 and 0. 7182 for PM10 , 0.2818 and 0.0197 for PM 2.5 ) were high, with the exception of AML-2 (0.019 for PM2.5). Overall quantitative comparison of the model results (Table 3) imply that, values predicted using the CALPUFF were marginally below the observed values and suggest that, CALPUFF has a greater tendency to under predict the observed maximum concentrations.
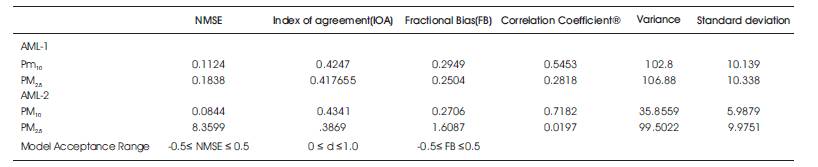
Table 3. Statistical evaluation of CALPUFF model Predicted values with the Observed values of PM10 and PM2.5
The statistical analysis (Table 3) indicates that, the CALPUFF model performance is good. Five statistical indicators showed good agreement with the observed data expect for PM2.5 at AML-2. The regional PM10 and PM2.5 concentrations were predominantly associated with AML-1 than AML-2 and model skill was outside the model acceptance range at AML-2. This may be due to uncertainties associated with inbuilt confines of CALPUFF. Mainly for two reasons, 1) the background concentrations (uncertain emissions and/or local baseline pollutant levels) were not incorporated in CALPUFF simulation input and 2) pollutant contribution from other sources outside the study area were not taken into account. The transported air pollutants into study area, from line sources, agricultural and human activities at AML-2 which is located in Bhumaigaripalle village, significantly contribute to the elevated difference in concentrations of particulate matter, thus a large variation in model performance here and hence the poor performance of model.
Traces of PM 10 , PM2.5 , SO2 , and NOx were predicted at the imaginary sampling locations, no hint of uranium containing dust was predicted beyond 10 km from the core zone. The pollution concentrations simulated in the CALPUFF model portray that, much of the particulate matter released from mining activities does not go beyond 35 km from the reference point. The simulated concentrations were high only near the mining premises within 1 km from the reference point. Beyond this distance negligible concentrations were detected all over this 35 km area towards North direction. All the simulated plumes were prominently dispersed towards North and slightly in North- East directions. The sensitive receptors were located on land to the North and West of the Mining site, while the area to the South and South-West is hilly area. Therefore, consequences of fugitive emissions from mining activities, which were very nominal, will trivially affect air quality at sensitive receptors and surroundings, only when winds are from the South-East, South and East (Figure 11). On the other hand, the observed concentrations using HVAS were high, when compared to CALPUFF predictions and explain that spatial variations (including maximum values) were associated with daily meteorological conditions such as wind speed, direction, and local winds (reverse winds from hilly area, Figures 8 and 9) local human activities and certainly not the mining fugitive emissions alone.
In this study, CALPUFF dispersion modeling system was employed to simulate PM10 , PM2.5 , SO2 and NOx and airborne dust containing Uranium concentrations in fugitive and process emissions from Tummalapalle Uranium mine. Maximum concentrations were observed only near mine site illustrates that, impact of mining activities was very circumstantial. The agreement of model predictions and HVAS observations for PM10 at 2 ambient monitoring locations as well for PM2.5 at AML-1, were better when compared with PM2.5 at AML-2. The large deviations at AML 2 were due to local pollutants. Terrain elevations and wind velocities were identified as important factors that may affect pollutant dispersion and atmospheric concentrations in the region. The simulated data was useful in visualizing the overall dispersion distribution for PM10 and PM2.5 and other pollutants and for identifying the primary contributors to air quality problems. From the results, we can conclude that, the effect of fugitive and process emissions from mining activities is minimal on the surroundings.
Thorough sensitivity analysis for accurate long-range dispersion models like CALPUFF, it would be needed to investigate the uncertainties associated with in the model. This model, may aid the regulatory authority like C.P.C.B (Central Pollution Control Board) in analyzing guidelinerelated information. Nevertheless, obtaining meteorological data in India for a particular location except for few cities is very difficult, improved monitoring atmospheric monitoring network might add up to the efficiency of CALPUFF modeling scenario. We could not set up more outlying monitoring locations in our study, as getting site specific meteorological data for individual locations was difficult. In order to ascertain the CALPUFF model predicting capability, it is recommended to establish more atmospheric monitoring locations far away from the mining area and to consider other regional dispersion models also to validate our results.