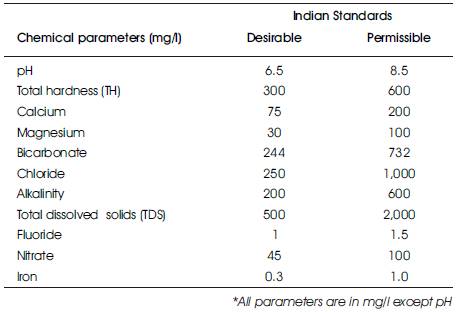
Table 1. Indian Standards for Drinking Water
Groundwater quality has a major significance, being the major alternate source of domestic, industrial and drinking water supply and therefore it needs greater attention of all concerned. The present study demonstrates the spatial distribution of various chemical parameters, such as pH, F, Cl, iron, nitrate, alkalinity, TDS, total hardness etc. using GIS techniques for Hilauli block of Unnao district, Uttar Pradesh. A Water Quality Index (WQI) was calculated to find the suitability of water for drinking purpose. The overall analysis of the water quality index in the study area revealed that most of the area with > 50 value exhibited poor, very poor and unsuitable water quality.
Fresh water being one of the basic necessities for sustenance of life, the human race through the ages has striven to locate and develop it. Water, a vital source of life in its natural state is free from pollution but when man tampers the water body it loses its natural conditions. Ground water has become an essential resource over the past few decades due to the increase in its usage for drinking, irrigation and industrial uses etc. The quality of ground water is equally important as that of quantity. Groundwater is an essential source of drinking water for people around the world, especially in rural India. Contamination of groundwater has been observed worldwide, and it is becoming self evident that concentrated human activities lead to groundwater contamination. Contamination of groundwater reduces the supply of safe drinking water which affects the public health. Geographical Information System (GIS) is a computer-based system designed tool applied to geographical data for integration, collection, storing, retrieving, transforming and displaying spatial data required for proper planning and management of natural resources (Remesan and Pande, 2008). The present study attempts to understand the spatial variation and influence of external factors on groundwater composition for taking preventive measures to protect the groundwater resources in the study region. The present study was undertaken in Hilauli block, Unnao district, Uttar Pradesh, India (i) to assess spatial distribution of various chemical parameters affecting ground water quality (ii) to statistically correlate the concentrations of measured parameters, and (iii) to derive the water quality index to evaluate the suitability of water for drinking purpose. Indian Standards for drinking water are given in Table 1.
Table 1. Indian Standards for Drinking Water
The Hilauli block is a part of Unnao district (UP), with geographical area of 356.70 km2. It lies between latitudes 26º 19′ to 26º 35´ North and longitudes 80° 50´ 18´´ to 81° 03´ 12´´ East (Figure 1).
The maximum temperature is 45°C in summer and minimum 3°C in winter. The block has Loni River in the western part and Sai River in the eastern part; both of these rivers being are perennial in nature. The alluvium formation of the block comprises of sand, silt and clay with occasional gravel. The older alluvium called bhangar, forms slightly elevated terraces usually above the flood levels.
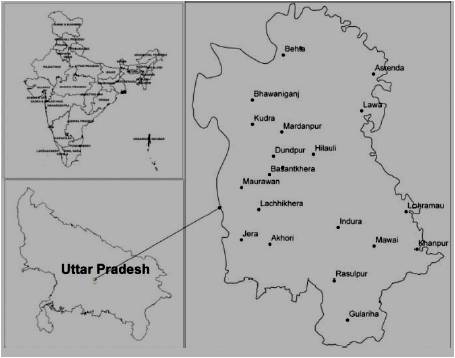
Figure 1. Study Area
The overall methodology adopted for the present study is presented in the form of flow chart in Figure 2. Data of twenty monitoring wells have been considered for the sampling of groundwater contaminants of Hilauli block, Unnao district. The locations of different wells are also displayed in Figure 1. These samples were analyzed for different parameters (Table 2) following standard methods (APHA, 1998). All the parameters were compared with the guidelines suggested by Bureau of Indian Standards (BIS, 2003). The obtained water quality data from the attribute database which is used to generate the spatial distribution maps for the present study area. Inverse distance weighted (IDW) raster interpolation technique of spatial analyst module in ArcGIS (version 9.0) software has been used for the present study to delineate the locational distribution of various water pollutants. The different locations of the sampling stations were imported into GIS software through point layer. Each sample point was assigned by a unique code and stored in the point attribute table. The data base file contains values of all chemical parameters in separate columns along with a sample code for each sampling station. The geodatabase was used to generate the spatial distribution maps of selected water quality parameters namely pH, fluoride (F), chlorides (Cl), iron (Fe), nitrate, alkalinity, total dissolved solids (TDS), total hardness (TH) and water quality index (WQI).
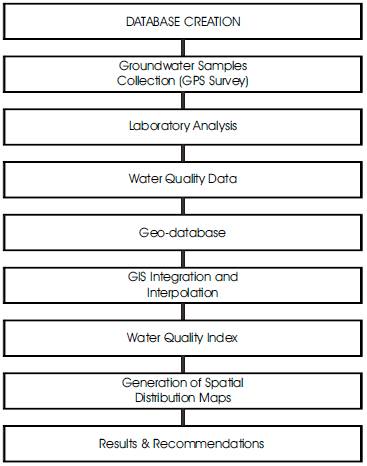
Figure 2. Flow Chart showing the Process Flow
Water Quality Index (WQI) is a very useful and efficient method for assessing the quality of water. WQI is a very useful tool for communicating the information on overall quality of water (Assadi et. al., 2007). To determine the suitability of the groundwater for drinking purposes, WQI is computed adopting the following steps (Ramakrishnian et. al., 2009):
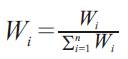
where, Wi is the relative weight, wi is the weight of each parameter and n is the number of parameters.
| qi = (Ci / Si) x 100 | (2) |
where, qi is the quality rating, Ci is the concentration of each chemical parameter in each water sample in mg/l (milligram/litre), and Si is the Indian drinking water standard for each chemical parameter in mg/l according to the guidelines of the BIS (1991).
| SIi = Wi . qi | (3) |
| WQI = ∑SIi | (4) |
Sii is the subindex of ith parameter; qi is the rating based on concentration of ith parameter and n is the number of parameters.
The results of chemical parameters analyzed are given in Table 2. Understanding the quality of groundwater is as important because it is the main factor for determining its suitability for drinking, domestic, agricultural and industrial purposes.
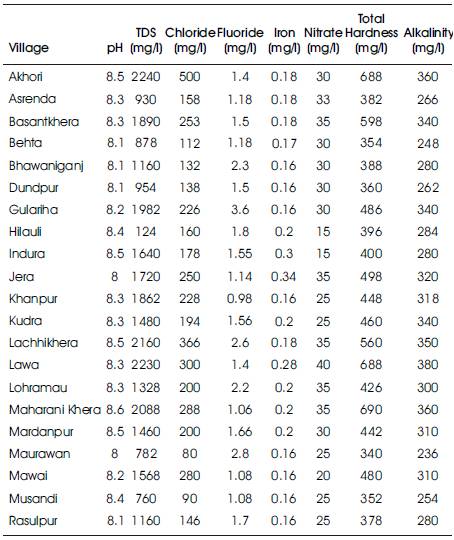
Table 2. Concentration of Various Chemical Parameters in Groundwater Samples
Nitrogen (N) is an essential input for the sustainability of agriculture. Contamination of groundwater by nitrate leached from agricultural land use is a problem in many countries of the world. It affects the drinking water quality and the ecology of surface water. Nitrate is soluble and negatively charged and thus has a high mobility and potential for loss from the unsaturated zone by leaching. Higher nitrate concentrations in drinking water can cause blue baby disease (Methamoglobinamia) in infants and stomach cancer in adults (Anayah and Almasri, 2009). High level may form carcinogens and can accelerate eutrophication in surface waters. Sources of nitrates include sewage, fertilizers, air pollution, landfills and industries (CPCB, 2008). In the study area, nitrate lies between 15 to 40 mg/l with a mean of 28 mg/l which is less than the value, as suggested by BIS (1991).
TDS (Total Dissolved Solids) is the term used to describe the inorganic salts and small amounts of organic matter present in solution in water. The principal constituents are usually calcium, magnesium, sodium, and potassium cations and carbonate, hydrogen carbonate, chloride, sulphate, and nitrate anions. The palatability of drinking water has been rated by panel of tasters in relation to its TDS level as follows: excellent- less than 300 mg/l; good- between 300 and 600 mg/l; fair- between 600 and 900 mg/l; poor- between 900 and 1200 mg/l; and unacceptable- greater than 1200 mg/l. Water with extremely low concentrations of TDS may also be unacceptable because of its flat, insipid taste. At a high TDS concentration, water becomes saline. Water with a TDS above 500 mg/l is not recommended for use as drinking water. Water with a TDS above 1,500 to 2,000 mg/l is generally considered problematic even for irrigation use on crops with low or medium salt tolerance (WHO, 1996). In the study area, Akhori, Lawa, Lachhikhera Maharani Khera villages are affected by high TDS value.
Water hardness is the traditional measure of the capacity of water to react with soap; as hard water requiring considerably more soap to produce lather. It is not caused by a single substance but by a variety of dissolved polyvalent metallic ions, predominantly calcium and magnesium cations, although other cations (e.g. barium, iron, manganese, strontium and zinc) also contribute. Hardness is most commonly expressed as milligrams of calcium carbonate equivalent per litre. Water containing calcium carbonate at concentrations below 60 mg/l is generally considered as soft; 60–120 mg/l, moderately hard; 120–180 mg/l, hard; and more than 180 mg/l, very hard (WHO, 2010). The principal natural sources of hardness in water are dissolved polyvalent metallic ions from sedimentary rocks, seepage and runoff from soils. Calcium and magnesium, the two principal ions, are present in many sedimentary rocks, the most common being limestone and chalk. They are also present in a wide variety of industrial products and are common constituents of food. Maharani Khera and Akhori villages have the high total hardness value in the study area.
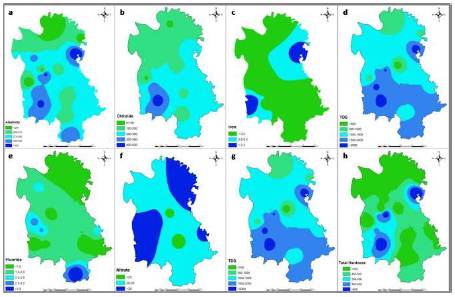
Figure 3. Spatial distribution of (a) Alkalinity (b) Chloride (c) Iron (d) TDS (e) Fluoride (f) Nitrate (g) pH (h) Total Hardness, obtained by IDW interpolation in Hilauli block, Unnao district, Uttar Pradesh
Chloride concentration of the groundwater samples in the study area varies from 80 to 500 mg/l, with average value of 213 mg/l. The acceptable limit for chloride in groundwater is 250 mg/l and permissible limit is 1000 mg/l (WHO, 1996). Almost all natural water contains chloride and sulphate ions. Their concentrations vary considerably according to the mineral content of the earth in any given area. In small amounts they are not significant. In large concentrations they present problems. In the study area, chloride content lies between 90 to 366 mg/l.
High pH causes a bitter taste, water pipes and water-using appliances become encrusted. It depresses the effectiveness of the disinfection of chlorine, thereby causing the need for additional chlorine when pH is high. Low-pH water will corrode or dissolve metals and other substances. In the study area, pH lies between 8.0 to 8.6 which is approximately within the acceptable range, as suggested by BIS (1991).
Fluoride, the most common occurring form of fluorine, is the natural contaminant of water. Groundwater usually contains fluoride dissolved in geological formation (Agarwal et. al., 2010). Fluoride has long been recognized as one of the most significant natural groundwater quality problems affecting arid and semi-arid regions of India. Fluoride (F) is known to contaminate groundwater reserves globally. The occurrence of fluoride in groundwater is mainly a natural phenomenon influenced not only by the local, regional geological settings and hydrological conditions but it also depends upon the retention and leaching of fluoride in soil (Jha et. al., 2010). Maurawan, Lohramau, Bhawaniganj and Mardanpur villages of Hilauli block are highly affected by high fluoride concentration.
High concentrations are expected in anaerobic groundwater conditions and under strongly acidic conditions. In the study area, iron concentration lies between 0.16 to 0.34 mg/l which is less than the permissible limits suggested by BIS (1991).
Water with low alkalinity is more likely to be corrosive, which could cause deterioration of plumbing and an increased chance for lead in water, if present in pipe, solder or plumbing fixtures. Sources of alkalinity are pipes, landfills, hazardous waste landfills. In the study area, alkalinity lies between 254 to 360 mg/l.
Using the above parameters, WQI has been computed for the study area. The computed WQI values range from 45.69 to 180.72, and were categorized into five types “excellent water” to “water unsuitable for drinking”. Figure 4 shows the spatial distribution of water samples that falls under different quality. The high value of WQI at these stations has been found to be mainly from the lower values of nitrate and higher values of total dissolved solids, hardness, and fluorides in the groundwater.
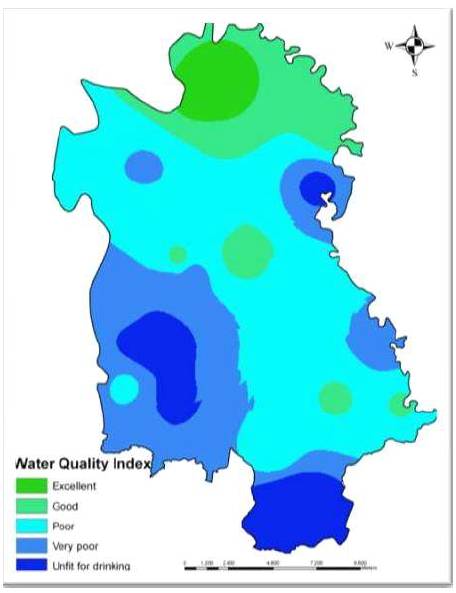
Figure 4. Water Quality Index Map of Hilauli block, Unnao district
The study has demonstrated the utility of GIS technology combined with laboratory analysis in evaluation and mapping of groundwater quality. About 10% of the area under study comes under unfit for drinking, 70% comes in poor and very poor and rest 20% area comes in good to excellent category revealed by the WQI studies. The spatial distribution maps generated for various physicochemical parameters using GIS techniques could be useful for planners and decision makers for initiating groundwater quality development in the area.